Article Text

Abstract
Background Global longitudinal strain (GLS) is a robust, well validated and reproducible technique for the measurement of LV longitudinal deformation. We sought to assemble evidence that GLS is an accurate marker in predicting cardiovascular outcomes, compared to LVEF.
Methods We undertook a systematic review of the evidence from observational studies which compared GLS against LVEF in predicting major adverse cardiac events. The primary outcome was all-cause mortality. The secondary outcome was a composite of cardiac death, malignant arrhythmia, hospitalisation due to heart failure, urgent valve surgery or heart transplantation, and acute coronary ischaemic event. A random effects model was used to combine HR and 95% CIs. A meta-regression was undertaken to assess the impact of potential covariates.
Results Data were collated from 16 published articles (n=5721 adults) comprising 15 prospective and 1 retrospective observational studies. The underlying cardiac conditions were heart failure, acute myocardial infarction, valvular heart disease, and miscellaneous cardiac diseases. Mortality was independently associated with each SD change in the absolute value of baseline GLS (HR 0.50, 95% CI 0.36 to 0.69; p<0.002) and less strongly with LVEF (HR 0.81, 95% CI 0.72 to 0.92; p=0.572). The HR per SD change in GLS was associated with a reduction in mortality 1.62 (95% CI 1.13 to 2.33; p=0.009) times greater than the HR per SD change in LVEF.
Conclusions There is strong evidence of the prognostic value of GLS, which appears to have superior prognostic value to EF for predicting major adverse cardiac events.
- speckle tracking
- ejection fraction
- mortality
- outcome
Statistics from Altmetric.com
Assessment of global LV systolic function has an important role in assessing the prognosis of a variety of cardiac diseases, and also influences treatment strategies.1 The most widely used parameter is LVEF, and this is commonly obtained by echocardiography. However, this has a number of important limitations, including geometric assumptions, load dependency, reproducibility, inter-observer variability, and the influence of heart rate and translational motion.2 The association of LVEF with outcome is greatest in moderately and severely impaired ventricles, and may not be a good marker of LV function in the setting of LV hypertrophy3
Strain imaging has emerged as a powerful tool to quantify accurately myocardial mechanics, including longitudinal, circumferential, and radial shortening and torsion.2 Although clinical measurement of LV strain started with a Doppler based approach, this has largely been superseded by two dimensional (2D) speckle tracking.2 Global longitudinal strain (GLS) appears to be the most robust parameter, and this has been shown to identify subclinical LV dysfunction in a number of circumstances, including myocardial and valvular disease.2 A number of individual studies have shown GLS to be a prognostic marker in unselected populations with known or suspected cardiovascular disease, including heart failure (HF), valvular heart disease (VHD), cardiomyopathy, and ischaemic heart disease.4–6 However, LVEF is established as the routine prognostic parameter of LV global dysfunction. The aim of this meta-analysis was to compare EF and GLS in the prediction of death and a composite of death, malignant arrhythmia, and HF hospitalisation.
Methods
Search strategy
We conducted a search strategy for this study in adherence to the PRISMA (preferred reporting items for systematic reviews and meta-analyses) statement for reporting systematic reviews and meta-analysis.7 This literature search of PubMed, EBSCO HOST, and EMBASE via Medline was performed using the key words ‘strain’, ‘speckle tracking’, ‘mortality’, ‘cardiovascular events’, ‘survival’, ‘outcome’, and ‘prognosis’. We limited the paper search to English language and human studies. Reference lists were thoroughly searched for additional studies. We contacted the authors wherever study data were incomplete.
Inclusion and exclusion criteria
We included studies in which GLS was evaluated as a predictor of mortality and major adverse cardiac events. Due to the limitations of Doppler based strain, we only included studies that calculated strain by 2D strain. Due to paucity of studies analysing global circumferential strain and wall motion score index (WMSI), we excluded these modalities from the final draft. We excluded studies where strain analysis was restricted to the RV.
Endpoints
The studies were included only if their primary and secondary endpoints matched the specified inclusion criteria. The primary outcome was all cause mortality. Secondary outcomes included the composite of cardiac death, HF hospitalisation, and malignant arrhythmias (sustained ventricular tachycardia, ventricular fibrillation, and recorded automatic implantable cardioverter defibrillator (AICD) shocks).
Data extraction
Data were independently extracted and reviewed by two of the investigators (KK and THM). All discrepancies were mutually reviewed and resolved by consensus. For systematic review, we extracted the following population data: study design, months of follow-up, age, sex, number, primary cardiac condition, outcomes, GLS, LVEF, and clinical variables.
Echocardiography
All the patients in the studies underwent standard echocardiographic assessment8 by experienced physicians or sonographers using commercially available ultrasound systems. LVEF was measured using the biplane Simpson's approach8 and LV mass was mostly calculated from LV linear dimension in the parasternal long axis view.8 LA volume index was calculated by the area length method. Diastolic function and LV filling pressures were investigated by assessment of transmitral flow. Colour and spectral Doppler were used to assess valvular regurgitation and stenosis.
GLS
Most studies recorded strain from standard 2D grey scale recordings at a frame rate >50/s. GLS was calculated using a variety of proprietary software (EchoPAC, GE Medical Systems, Milwaukee, Wisconsin, USA; Syngo velocity vector imaging, Siemens, Mountain View, California, USA; LV analysis, TomTec GmbH, Unterschlessheim, Germany). The common steps were definition of the systolic ejection phase, allocation of fiducial points, outlining a region of interest, and automatic tracking of speckles from frame-to-frame in the apical four-chamber, two-chamber, and long axis views. The final results of GLS were displayed on a 16-segment polar map with segmental strain values and a mean GLS (figure 1).
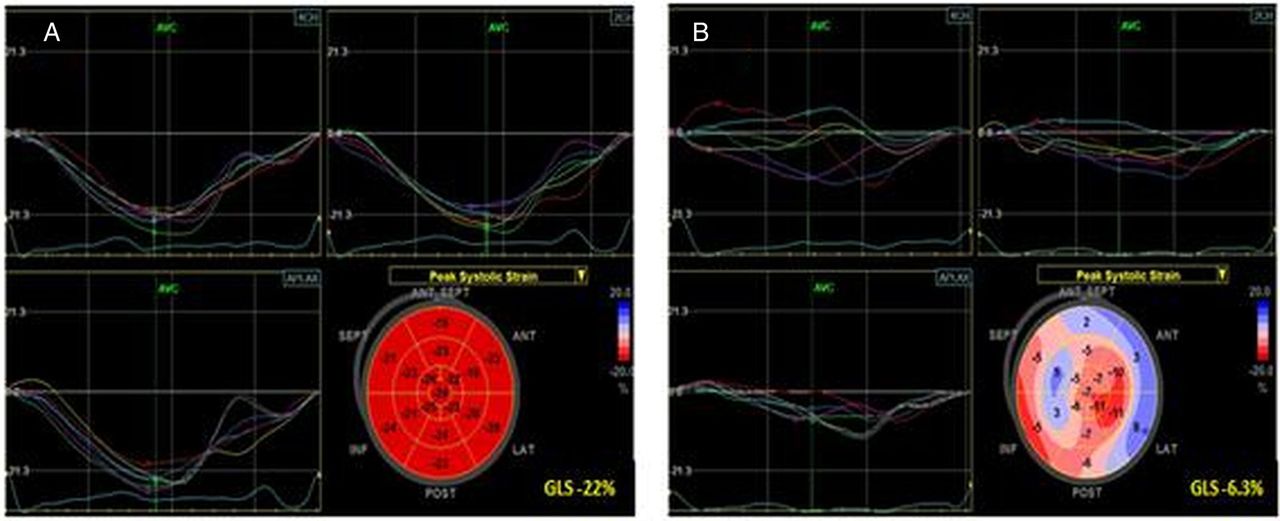
Calculation of regional and global strain in a normal (A) and abnormal ventricle (B). Normal strain is characterised by uniform waveforms of comparable timing, uniform colour on the polar map display, and a global strain of approximately −20%. Impaired strain often shows variation in the timing and magnitude of contraction, with a reduction of global strain, −12% being analogous to an EF<35%.
Statistical analysis
Pooled HRs and 95% CIs were computed using random effect models of the association of GLS and LVEF with mortality and the composite endpoints. We only included studies that had estimated HRs for both GLS and LVEF to the same endpoint. Some analyses showed very low heterogeneity; however, for consistency and due to the diverse nature of the populations and adjustment factors, a random effects method was chosen for all pooled analyses. Most studies reported HR effect sizes relative to a 1% increase in GLS and LVEF, but some studies reported effects relative to larger changes in GLS or LVEF. To allow comparison of GLS and LVEF, all studies were rescaled by the within-study SD to represent a standardised change in the absolute value of each parameter (either GLS or LVEF) before pooling. Scaled in this way, each SD change represents a reduction in hazard. We used bivariate meta-regression to compare directly the effect sizes for GLS and LVEF and examine heterogeneity. Within-study correlations were unknown for these bivariate meta-regressions and we therefore used the Riley method for estimation. In one model that did not converge, we used a within-study correlation estimate of 0.5.9 We report the absolute strength of GLS relative to LVEF when directly comparing the two effects; a value >1 indicates that a change of 1 SD in GLS is associated with a greater hazard reduction relative to 1 SD change in LVEF. Cochrane's Q test for heterogeneity between the studies and the I2 measure of inconsistency is reported. Heterogeneity was explored from proportions of sample characteristics within studies, such as female gender, and diagnoses of hypertension, diabetes mellitus, and dyslipidaemia, as well as for four study subgroups according to the underlying cardiac condition: HF, acute coronary syndrome (ACS), VHD, and other miscellaneous cardiac conditions (MC). Begg's funnel plot, Egger's test, and Duval and Tweedie's trim and fill were used to examine publication bias. Forest plots were constructed to show the overall effect of GLS and LVEF. Statistical analysis was performed using Stata V.12.1 (Stata Statistical Software, release 12, StataCorp 2011, College Station, Texas, USA) with two-tailed p values; a value of p<0.05 was considered significant.
Results
Study selection
Sixty-one studies were considered to be potentially eligible for systematic review after full text review (see online supplementary appendix figure 1). Our initial analysis comprised 20 prospective studies and one retrospective study,4–6 10–27 from which we included 16 studies that provided outcome data on both GLS and LVEF so that a paired analysis could be undertaken. Thus, 45 studies were excluded on the basis of inability to match our inclusion criteria (n=2), different methodology (n=11), different endpoints (n=27), and inability to pair match studies (n=5).
Fourteen studies provided univariable analysis and five studies provided multivariable analysis after adjusting for significant factors. Seven studies provided data on primary outcome and 15 studies on secondary outcome. Six studies provided data on both primary and secondary outcome. Data extracted from 16 studies included HR and 95% CIs.
Patient characteristics
There were 5721 patients in the 16 included studies (table 1). Fifteen studies were prospective (n=5554) and one was retrospective (n=167). The clinical characteristics of the patients and the definition of endpoints are provided in table 1. Overall follow-up averaged 26.6±13.3 months (13–26), most patients were >60 years, and there were 1751 female participants (30.6%). The most commonly studied condition was ACS (five studies, n=3242), followed by HF (four studies, n=801), VHD (four studies, n=513), and MC (three studies, n=1165). The most prevalent medical conditions were hypertension, HF, diabetes mellitus, hypercholesterolaemia, and ischaemic heart disease.
Patient characteristics
Outcomes
Among 5721 patients, there were 1045 reported deaths (18%) and 1226 patients (21%) reached the composite endpoint.
Mortality
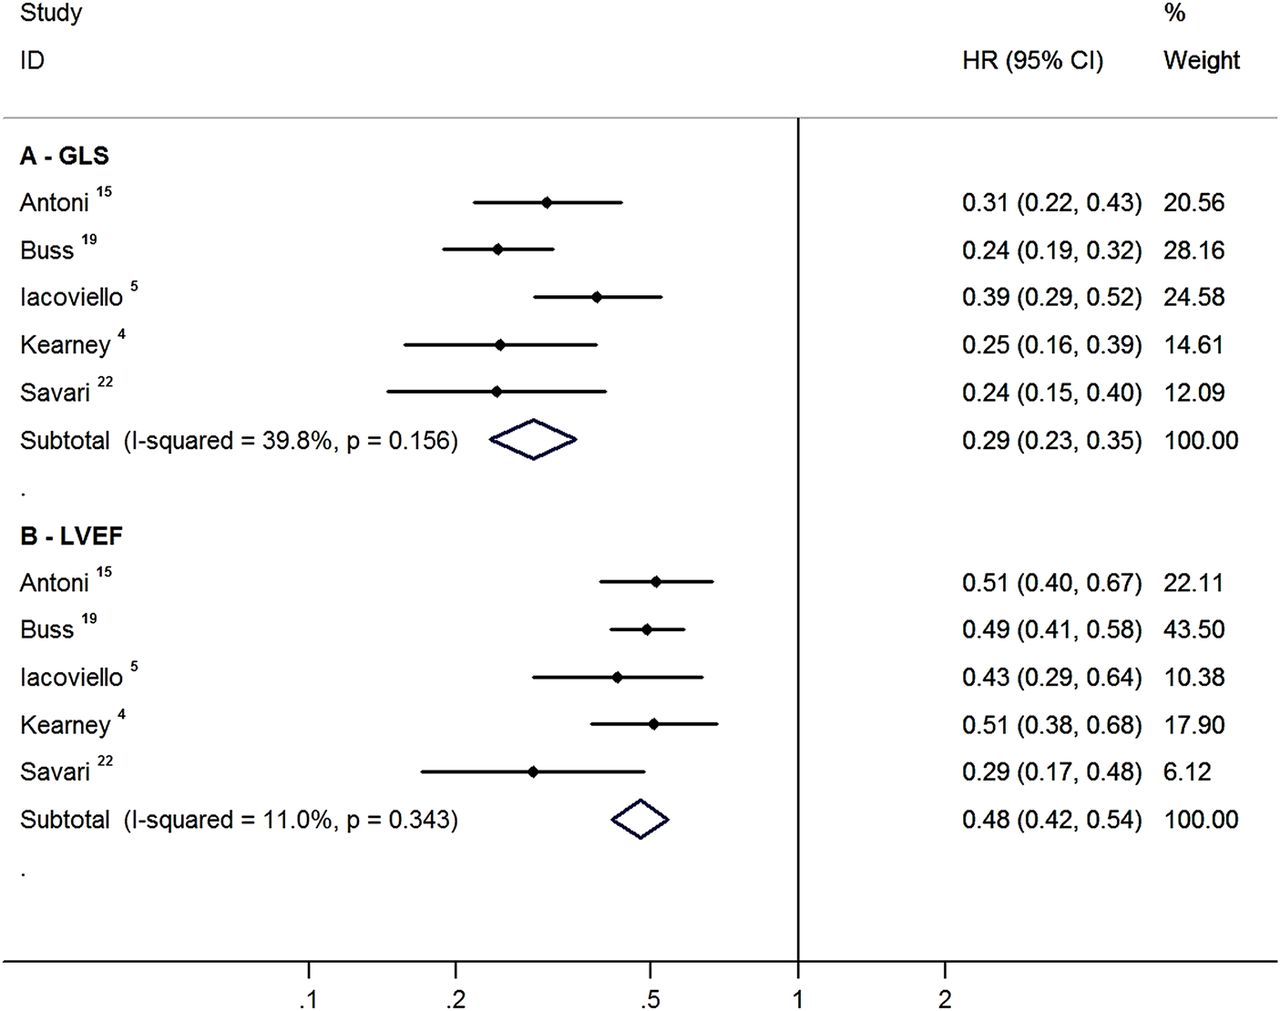
Figures 2 and 3 show the association of GLS and LVEF with mortality on univariable and multivariable models. In univariable (unadjusted) analysis, a 1 SD change in absolute GLS was associated with reduction of all-cause mortality (HR 0.29, 95% CI 0.23 to 0.35) as was an SD change in LVEF (HR 0.48, 95% CI 0.42 to 0.54). On bivariate meta-analysis (meta-regression) the HR per SD for GLS was 1.67 (95% CI 1.34 to 2.08; p<0.001) times greater than that of the HR per SD for LVEF.

Global longitudinal strain (GLS) and LVEF as predictors of all-cause mortality on univariable paired matched analysis. HR is per SD change in absolute GLS/LVEF percentage. The value for the I2 statistic and the p value associated with the heterogeneity Q test are shown in brackets for each subtotal.

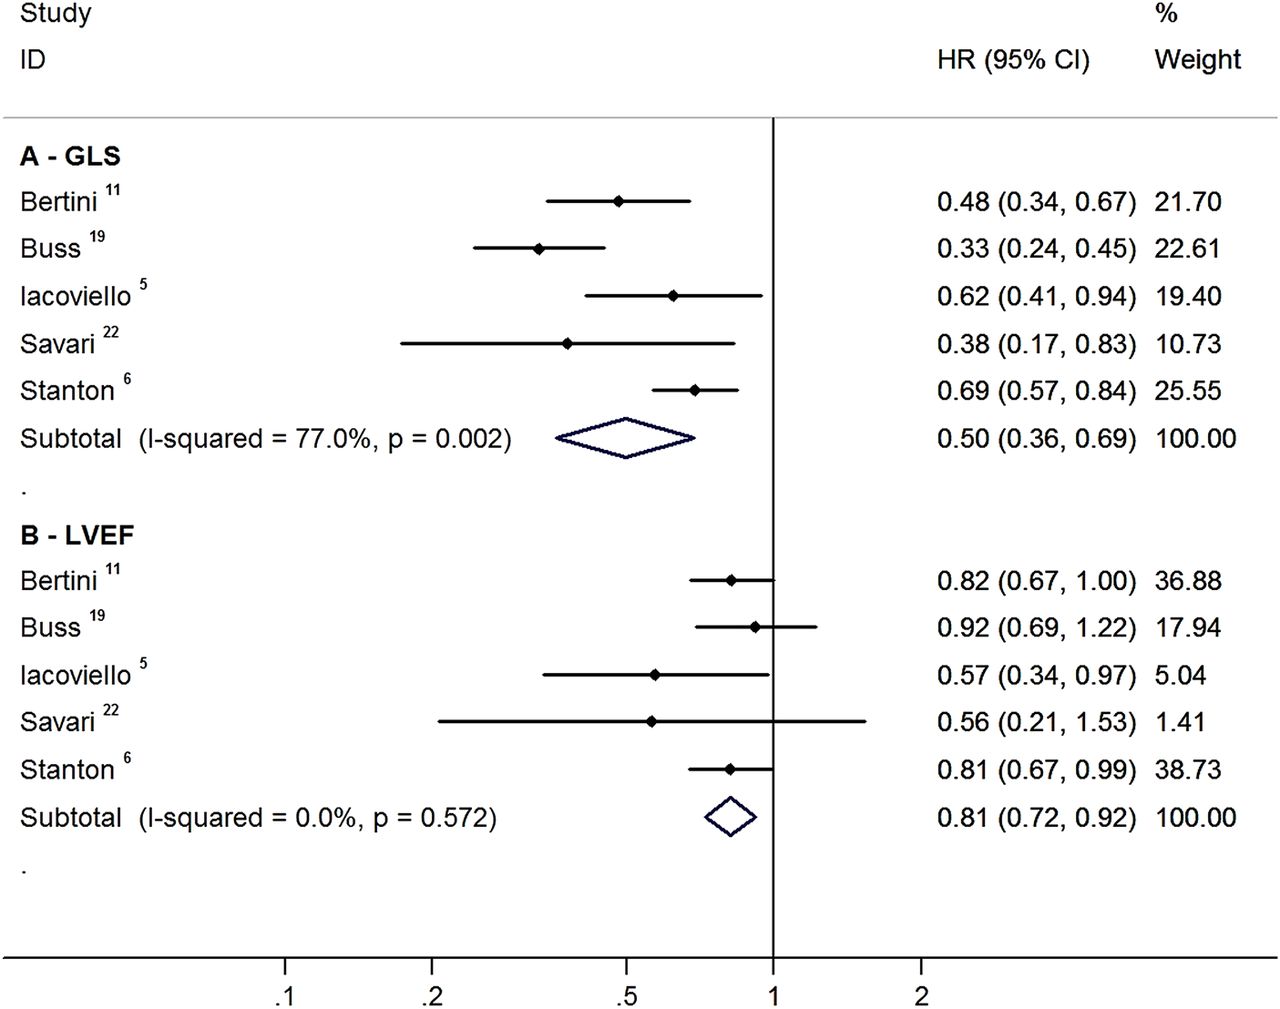
Global longitudinal strain (GLS) and LVEF as predictors of all-cause mortality on multivariable paired matched analysis. HR is per SD change in absolute GLS/LVEF percentage. The value for the I2 statistic and the p value associated with the heterogeneity Q test are shown in brackets for each subtotal.
In a multivariable (adjusted) analysis that included age, gender, hypertension, diabetes mellitus, dyslipidaemia, and the underlying cardiac condition (HF, ischaemic heart disease, VHD, and other cardiac conditions), GLS was also independently associated with all-cause mortality (HR 0.50, 95% CI 0.36 to 0.69) compared to LVEF (HR 0.81, 95% CI 0.72 to 0.92). The HR per SD for GLS as an independent correlate of outcome was 1.62 (95% CI 1.13 to 2.33; p=0.009) times greater than that of LVEF.
Composite endpoint
Figures 4 and 5 show the association of GLS and LVEF with the composite endpoint on univariable and multivariable analysis. In univariable analysis, GLS was associated with the composite endpoint (HR 0.56, 95% CI 0.48 to 0.64), as was LVEF (HR 0.66, 95% CI 0.57 to 0.76). The strength of effect for the HR per SD for GLS was 1.19 (95% CI 1.08 to 2.31; p<0.001) times greater than that of LVEF. In a multivariable analysis, GLS was independently associated with the composite outcome (HR 0.50, 95% CI 0.43 to 0.60), analogous to LVEF (HR 0.72, 95% CI 0.53 to 0.98). The HR per SD for GLS was 1.39 (95% CI 0.95 to 2.02; p=0.089) times greater than that of LVEF.

Global longitudinal strain (GLS) and LVEF as predictors of composite endpoint on univariable paired matched analysis. HR is per SD change in absolute GLS/LVEF percentage. The value for the I2 statistic and the p value associated with the heterogeneity Q test are shown in brackets for each subtotal.

Global longitudinal strain (GLS) and LVEF as predictors of composite endpoint on multivariable paired matched analysis. HR is per SD change in absolute GLS/LVEF percentage. The value for the I2 statistic and the p value associated with the heterogeneity Q test are shown in brackets for each subtotal.
Publication bias
Funnel plots for all-cause mortality and composite endpoints are shown in online supplementary appendix figures 2–5. Concerns about the potential for publication bias are not supported by the results of Duval and Tweedie's trim and fill method (see online supplementary appendix table 1), in which none of the pooled estimates was manifestly altered by this technique.
Exploration of heterogeneity
Bivariate meta-regression analyses comparing subpopulations (HF, ischaemic heart disease, VHD, MC) were only possible for the univariable composite endpoint analyses due to insufficient numbers in subgroups for mortality and/or multivariable analyses. The HR per SD change was stronger for GLS when compared with LVEF for almost all subpopulations and varied from 1.03 times to 1.30 times stronger for univariable composite analyses (ACS: 1.26, 95% CI 1.11 to 1.42; HF: 1.03, 95% CI 0.90 to 1.19; VHD: 1.30, 95% CI 1.12 to 1.49; and MC: 1.26, 95% CI 0.84 to 1.91), with the HF and miscellaneous groups not showing statistical significance. As seen in table 2, the average LV function in two-thirds of the studies was normal or near normal. However, figure 3 (independent associations of all-cause mortality) shows that both studies with preserved function (Buss et al19 and Stanton et al6, average EF>45%), as well as most of those with impaired function (Bertini et al11 and Sarvari et al22, EF<45%), showed GLS to be more strongly associated than EF with outcome. Likewise, figure 5 (independent associations of composite endpoint) shows that studies by Bertini et al11, Dahl et al26, and Iacoviello et al5 (EF<45%) demonstrated the hazards of impaired GLS exceed those of impaired EF, in the same way as studies showing preserved EF (Munk et al10, Woo et al17, average EF>45%). Thus, it appears that the risks associated with impaired GLS exceed those associated with reduced LVEF in both HF with reduced EF (HFrEF) and HF with preserved EF (HFpEF).
Comparison of reported LVEF and global longitudinal strain among studies
We were unable to find any significant associations between heterogeneity of effect size for either GLS or LVEF and the proportion of persons with hypertension or diabetes mellitus, or gender. The heterogeneity of effect sizes for proportions of patients with dyslipidaemia could not be studied as there were too few studies reporting this statistic.
Discussion
This meta-analysis confirms the prognostic significance of GLS when compared to LVEF in patients with different underlying cardiac abnormalities. A 1 SD change in GLS was a stronger predictor of all-cause mortality when compared with the same change in LVEF in both univariable and multivariable models. A similar HR was maintained for composite endpoints.
Use of GLS and EF for assessment of global LV function
Estimation of LV systolic function is the mainstay of risk evaluation and management of cardiac diseases. Historically the most common means of obtaining LVEF have been echocardiography and nuclear ventriculography, with the more recent addition of cardiac CT, cardiac MR (CMR), and 3D echocardiography. Although the performance of echocardiography has shown prognostic benefit in patients with underlying cardiac diseases, and the simplicity and ready availability of echocardiography have made this test the instrument of choice for LVEF assessment, this technique carries a number of potential limitations. The use of standard 2D echocardiography to examine 3D cardiac structure is limited by geometric assumptions, foreshortening and difficulties in proper delineation of the endocardial borders. Moreover, all assessment of LVEF is affected by load, heart rate, and beat to beat variability (eg, atrial fibrillation). Disturbance of haemodynamic load may contribute to the transition into HF, and potentially this transition may be hidden in the setting of reduced afterload—a situation where a more sensitive index of systolic performance may facilitate recognition of LV deterioration.2
In these and other situations, subclinical LV impairment may be identified by reduced longitudinal function—perhaps because subendocardial fibres are most susceptible to injury.2 GLS is a semi-automated tool to assess multidimensional myocardial mechanics which is more reproducible, unaffected by tethering effects and non-reliant on geometric assumptions.2 CMR measurement of EF showed a better correlation with GLS (r=−0.69, p<0.0001) than did 2D EF (r=0.58, p<0.0001).28 GLS is well validated as a marker for the measurement of LV longitudinal deformation, which has emerged as a sensitive and specific marker to detect early and subtle myocardial dysfunction. GLS can identify patients with early stages of HF, subclinical chemotherapy related cardiotoxicity, early stages of cardiomyopathies or infiltrative heart diseases, and hence provide vital guidance about diagnosis and management.
Specifically, while echocardiographic EF is capable of differentiating between severe, moderate and mild LV impairment, its high test-retest variability has led to reclassification of normal to mild LVEF in up to 13% of patients. The limitations of near normal LVEF likely account for the better correlation of GLS and EF when EF is <35% (r=0.74, p<0.001) than with EF>35%.6
GLS and risk evaluation
It is well known that patients with impaired LVEF pose a high risk of all-cause and operative mortality, but this effect is less apparent in patients with EF>45%.3 The inherent limitations of EF may limit its ability to identify mild degrees of LV systolic impairment.29 GLS has also been proven to offer incremental predictive value of prognosis on multiple logistic regression models when compared to LVEF and WMSI,6 ,11–13 ,19 and a number of studies have shown impaired GLS in the setting of normal LVEF (table 2).
Limitations
As with many meta-analyses of observational studies, non-uniform design and variations in the inclusion criteria, follow-up periods and endpoints are all potential sources of heterogeneity among studies (table 1). Nonetheless, both measured heterogeneity and publication bias appear limited. For this meta-analysis we used 2D speckle tracking imaging and not tissue Doppler based parameters due to their inherent limitations of poor signal-to-noise ratio, angle dependency and alignment issues in patients with ischaemic cardiomyopathy. We did not add WMSI in our meta-analysis because only a few studies reported these findings. Likewise, although we provided sub-analyses according to clinical presentation, the subgroups are small. In some situations, GLS (rather than LVEF) was shown to be an independent predictor of primary and secondary outcome—for example, after acute myocardial infarction15 and in moderate to severe aortic stenosis. On the other hand, there were only four HF studies, and the analysis was underpowered to show differences in the performance of EF and GLS in this setting.
Additional potential limitations of GLS are its dependency on high quality 2D images and appropriate imaging settings. 2D speckle tracking seems to work best at frame rates between 50–70/s, and tachycardia may result in under-sampling. Increasing the frame rate risks compromising spatial resolution. Like EF, strain is dependent on both preload and afterload, and alterations in loading can result in increasing and reducing strain, irrespective of myocardial status. Lack of reproducibility and out of plane motion, although much less compared with tissue Doppler based strain, remains a potential problem. However, while both EF and GLS are potentially limited by technical factors, the interclass correlation coefficients between and within observers with EF (0.67 and 0.80) are inferior to GLS (0.92 for both). Similarly, Munk et al30 have shown that GLS has better intra-observer and inter-observer reproducibility when compared with LVEF and end systolic volume index (ESVI) for predicting infarct size. The one specific limitation of GLS is that there is a lack of standardisation between multiple vendors, causing inter-vendor variability.
Conclusions
In this meta-analysis, we have shown the independent prognostic significance of GLS in patients with (on average) mild LV global impairment. The prognostic value of this information seems likely to be superior to that provided by LVEF. While image quality and load dependence remain potential limitations, these findings add to other reasons to support the wider use of GLS, including avoidance of geometric assumptions, less variability, and sensitivity to subclinical change.
Key messages
What is already known on this subject?
-
Global LV strain is a physiological parameter of global cardiac function, obtainable with echocardiography, which has been available for a number of years. Strain appears to provide prognostic information when EF is normal, or near normal. However, comparative studies are of limited size.
What might this study add?
-
The data show that there is indeed a significant benefit in the use of strain over EF, especially in the group with relatively preserved systolic function. Because of the different units of measurement of these techniques, a comparison was based on the SD of each parameter. Mortality was independently associated with each SD change in the absolute value of global longitudinal strain (GLS) (HR 0.50, 95% CI 0.36 to 0.69; p<0.002) and less strongly with LVEF (HR 0.81, 95% CI 0.72 to 0.92; p=0.572). The HR per SD change in GLS was associated with a reduction in mortality 1.62 (95% CI 1.13 to 2.33; p=0.009) times greater than the HR per SD change in LVEF.
How might this impact on clinical practice?
-
As half of heart failure is acknowledged to be associated with normal EF, strain may be a more useful tool than EF. The role of EF is central in cardiovascular disease, so the implications are far reaching. Strain should be quoted with EF and may eventually replace it.
References
Supplementary materials
Supplementary Data
This web only file has been produced by the BMJ Publishing Group from an electronic file supplied by the author(s) and has not been edited for content.
Files in this Data Supplement:
- Data supplement 1 - Online appendix
Footnotes
-
Contributors KK: obtained data, started analysis, wrote the first draft. PO: assisted analysis and revised text. THM: designed the study, assisted data acquisition, assisted analysis and revised text. THM is the guarantor of this paper.
-
Competing interests None.
-
Provenance and peer review Not commissioned; externally peer reviewed.