Article Text

Abstract
Background and aim: Colon cancer tumorigenesis is a multistep process of mutation accumulation in a number of oncogenes and tumour suppressor genes. NF1 gene protein, neurofibromin, acts as a tumour suppressor by turning the active form of Ras into an inactive form. This molecular switch has an important role in the control of the cell cycle and differentiation, and changes in Ras activity are present in many different cancers. This is the first study to investigate the role of NF1 in sporadic colon cancer.
Methods: We investigated loss of heterozygosity (LOH) at the NF1 locus. Real time reverse transcription-polymerase chain reaction was used to determine NF1 mRNA expression in tumours and corresponding normal tissue. Expression of neurofibromin was analysed by immunohistochemistry. Relative ratio of NF1 mRNA type I and II isoform expression was also examined.
Results: LOH of the NF1 gene was detected in 20.7% of heterozygous samples. NF1 mRNA expression was significantly increased in tumour tissue compared with corresponding normal tissue (p = 0.04291). There was a statistically significant increase in NF1 type I isoform expression (p = 0.0005) in tumour tissue compared with corresponding normal colon tissue. NF1 isoform type II was predominantly expressed in normal tissue while the NF1 isoform type I prevailed in tumour samples. The transition from dominant expression of isoform type II in normal mucous tissue 15 cm away from the tumour to dominant expression of isoform type I in tumour tissue itself was detected. Total neurofibromin expression increased as tumours were more advanced but expression of wild-type neurofibromin remained the same.
Conclusions: Our findings suggest that the NF1 gene may play a role in the development and progression of colon cancer and the NF1 gene may be a potential tumour marker and a new potential target for colon cancer therapy.
- LOH, loss of heterozygosity
- GAPs, GTPase activating proteins
- NF1-GRD, GAP related domain
- RFLP, restriction fragment length polymorphism
- VNTR, variable number of tandem repeats
- RT-PCR, reverse transcription-polymerase chain reaction
- NF1 gene
- loss of heterozygosity
- neurofibromin
- sporadic colon cancer
- colon cancer
Statistics from Altmetric.com
- LOH, loss of heterozygosity
- GAPs, GTPase activating proteins
- NF1-GRD, GAP related domain
- RFLP, restriction fragment length polymorphism
- VNTR, variable number of tandem repeats
- RT-PCR, reverse transcription-polymerase chain reaction
Colon cancer is one of the most common cancers and a leading cause of cancer related deaths in Western countries.1 Colorectal tumorigenesis is a multistep process in which many oncogenes (beta-catenin, K-ras) as well as tumour suppressor genes (APC, DCC, DPC4, p53, E-cadherin, nm23) are involved.2 The majority of colon cancers are sporadic while 5–10% arise from an inherited mutation.3
The NF1 gene is a large gene with 60 exons spanning over 350 kb of genomic DNA on chromosome 17q11.2.4 It encodes an 11–13 kb mRNA which is translated into the 2818 amino acid protein product neurofibromin.5 Neurofibromin is a highly conserved protein and its central region (exons 21–27a) contains a functional GTPase activating protein related domain (NF1-GRD) that shows homology to yeast and mammalian GTPase activating proteins (GAPs).6 NF1-GRD downregulates Ras activity by accelerating the rate of GTP hydrolysis.7 Ras protein plays a central role in cellular growth and differentiation and its aberrant activation is involved in the development of many different cancers.8 This negative regulation of Ras activity classifies NF1 gene as a tumour suppressor gene.9
Several different isoforms are formed by alternative splicing of NF1 mRNA. Isoform type I was the first isolated that lacks any insertions. Isoform type II contains an additional 63 bp insertion (exon 23a) that encodes 21 amino acids in the centre of NF1-GRD.10,11 Due to the specific position of exon 23a in the NF1-GAP related domain, isoform types I and II have different Ras-GTP binding and catalytic activities.12 These two isoforms are expressed in varying ratios in different cell types.13,14 Several studies have shown that alterations in the type I versus type II mRNA ratio can be associated with the development of certain malignancies.15,16
Nishi et al found that isoform type I was the dominantly expressed isoform in fetal brain and undifferentiated neuroectodermal tumours while isoform type II was present in well differentiated tumours.14 Iyengar et al analysed expression of these two isoforms in ovarian carcinoma and detected a significant decrease in isoform type II expression and an increase in isoform type I expression in ovarian carcinoma cell lines and tumour tissue compared with expression of these two isoforms in normal ovarian epithelial cells.16
As neurofibromin acts as a negative regulator of Ras, which is involved in the tumorigenesis of many cancers, including colon cancer, the aim of our study was to investigate the role of the NF1 gene in the development and progression of sporadic colon cancer. Here we analysed loss of heterozygosity (LOH) at the NF1 gene locus, NF1 mRNA expression, NF1 mRNA isoform type I and II expression, and neurofibromin expression in sporadic colon cancer.
MATERIALS AND METHODS
Tumour and normal DNA
Tumour and adjacent normal colon tissue from patients with sporadic colon cancer used in our research analysis were obtained from the Croatian Tumour Bank.17 All specimens were obtained during routine surgery performed in patients (n = 100) with colon adenocarcinoma. Fresh samples of resected colon carcinoma were snap frozen in liquid nitrogen and stored in the Human Tumour Bank at −80°C until needed. Before use in the study, each specimen was verified by a histopathologist. All specimens were examined by routine haematoxylin-eosin staining to determine the proportion of tumour cells in the sample (>80%). Control normal DNA was extracted from histologically normal colon mucous adjacent (15 cm from the tumour) to the adenocarcinoma. Frozen tissue DNA extraction was performed using proteinase K digestion and phenol chloroform extraction.
Polymerase chain reaction (PCR)
For LOH analysis at the NF1 gene locus, three sets of primers were used. The sequences of specific oligonucleotides used were: 5L (5′-CAT GTG GTT CTT TAT TTA TAG GC-3′) and 5R (5′-TCA ATC GTA TCC TTA CCA GCC-3′) for NF1 exon 5; AluI (5′-CAA GAA AAG CTA ATA TCG GC-3′) and AluII (5′-GGA ACC TTA AGT TCA CTT AG-3′) for IVS27AAAT2.1; and 53.0A (5′-CAG AGC AAG ACC CTG TCT-3′) and 53.0B (5′-CTC CTA ACA TTT ATT AAC CTT A-3′) for IVS38GT53.0.18–20
Genomic DNA (100 ng) was used as a template in a reaction volume of 25 μl containing 5 pmol of each primer, 50 μM of each dNTP, and 1 U Taq Gold DNA polymerase (Applied Biosystems, Foster City, California, USA). PCR reactions were carried out in an Applied Biosystems GeneAmp PCR System 2400 for 30 cycles. Annealing temperatures for each primer set were optimised in pilot studies before processing experimental samples.
RsaI NF1 exon 5 restriction fragment length polymorphism (RFLP) analysis
For RFLP analysis, 5 μl of the PCR product were digested overnight with 2 U of RsaI in a volume of 25 μl at 37°C. After addition of loading buffer the samples were analysed by non-denaturing polyacrylamide electrophoresis.
Variable number of tandem repeats (VNTR) and LOH analysis
RsaI RFLP was analysed by non-denaturing polyacrylamide electrophoresis. RFLP product (12 μl) were mixed with 3 μl of loading buffer and loaded onto 1 mm thick, 35×30 cm, 10% non-denaturing polyacrylamide gel. Electrophoresis was performed in 1× TBE (Tris/borate/EDTA) buffer for six hours at 10 V/cm, at room temperature. The gels were silver stained.
Polymorphic marker IVS38GT53.0 analysis was performed by non-denaturing polyacrylamide electrophoresis. For VNTR analysis, 5 μl of PCR product were mixed with 3 μl of loading buffer and loaded onto 1 mm thick, 35×30 cm, 10% non-denaturing polyacrylamide gel. Electrophoresis was performed in 1× TBE buffer for 16 hours at 10 V/cm, at room temperature. The gels were silver stained.
Polymorphic marker IVS27AAAT2.1 analysis was performed by submerged gel electrophoresis. PCR product (1 μl) was analysed by electrophoresis on a precast Spreadex EL 800 gels (Elchrom Scientific, Cham, Switzerland). Electrophoresis was performed in 0.75× TAE (Tris/acetate/EDTA) buffer for 750 minutes at 10 V/cm, at 20°C. The gels were SyberGold stained (Molecular Probes, Leiden, the Netherlands).
LOH was defined by visible change in allele:allele ratio in tumours compared with matching normal tissue. Allelic deletion of the NF1 gene was judged by positive LOH at any of the three sites.
RNA extraction and reverse transcription (RT)
Total RNA was extracted from fresh samples of resected colon carcinoma and corresponding normal tissue using Trizol reagent (Invitrogen, Life Technologies, Carlsbad, USA), and 1 μg of RNA was used for RT (TaqMan, Reverse Transcription Reagents; Applied Biosystems) according to the manufacturer’s protocols.
Real time RT-PCR analysis of NF1 mRNA expression
Real time RT-PCR analysis for NF1 gene and internal housekeeping gene RPLP0 was performed using an ABI PRISM 7000 Sequence Detection System (Applied Biosystems) and predeveloped TaqMan assay reagents, Hs00169714 for NF1 gene and Hs99999902 for RPLP0. The PCR reaction was carried out according to the manufacturer’s protocol. To compensate for inter-PCR variation, normalisation of the target gene (NF1) with an endogenous control (RPLPO) was performed. The results are shown as ΔCt values. The results are shown as ΔCt values, which is the difference in cycle number required to raise the amount of PCR product above threshold. ΔCt is therefore inversely proportional to the amounts of mRNA.
NF1 mRNA isoform type I and II expression analysis
NF1 mRNA isoform type I and II expression was analysed by quantitative RT-PCR using specific oligonucleotide primes that amplify part of NF1 exon 23: ISOF (5′-CAG AAT TCC CCC CTC AAC TTC GAA GT-3′) and ISOR (5′-TGC GTG CTG CAT CAA AGT TGC TTT TCA C-3′) in 55 selected tumour samples and their corresponding normal mucous tissue. These primers amplify both NF1 gene isoforms. The PCR reaction mixture was prepared and the optimal PCR cycle for product analysis (exponential phase of PCR reaction) was determined by quantitative PCR. Amplification was performed by incubating the mixture for 35 cycles of denaturation (45 seconds at 96°C), annealing (45 seconds at 64°C), and extension (30 seconds at 72°C). The size of the NF1 isoform type I PCR product was 303 bp while the size of the NF1 isoform type II PCR product was 366 bp. PCR products were fractionated electrophoretically on 2.5% agarose gels (Sigma Chemical Co., Deisenhofen, Germany) and stained with ethidium bromide. The intensity of each band in each PCR sample was analysed using Image Master VDS (Amersham Pharmacia Biotech, Vienna, Austria) and the exponential phase of the PCR reaction was determined. The relative ratio of NF1 mRNA isoform type I and II expression was analysed in each sample.
Immunohistochemistry
Immunohistochemistry was performed on formalin fixed paraffin embedded tissue. Expression of neurofibromin in 100 samples of sporadic colon cancer was analysed using polyclonal rabbit antibodies that detect N terminus neurofibromin (N) (Santa Cruz Biotechnologies, Santa Cruz, California, USA) and C terminus of the protein, neurofibromin (D) (Santa Cruz Biotechnologies). After deparaffinisation in xylene, slides were washed in phosphate buffered saline (3×3 minutes). Endogenous peroxidase activity was quenched by 15 minutes incubation in methanol with 3% hydrogen peroxide (Sigma Chemical Co.). Target retrieval procedure involved immersion of tissue sections on slides in Dako Target Retrieval Solution (Dako Corporation, California, USA, USA) and heating in a water bath (95–99°C) for 3× 5 minutes. Slides were then allowed to cool for 30 minutes at room temperature. Non-specific binding was blocked by applying Dako Protein Block Serum-Free (Dako Corporation) in a humidity chamber for 10 minutes at room temperature. Slides were blotted, and the primary polyclonal rabbit antibodies at a concentration of 2 µg/ml were applied for one hour at room temperature. Slides were then washed three times in phosphate buffered saline. Dako EnVision+System, HRP (DAB) (Dako Corporation) was used for visualisation of the positive reaction according to the manufacturer’s instructions. The slides were counterstained with haematoxylin for 30 seconds, dehydrated, and mounted in Canada balsam. Each slide was evaluated in the entire tumour area. Results were expressed as negative or positive staining.
Statistical analysis
Correlations between the NF1 LOH status and clinicopathological characteristics were explored from contingency tables. Tables were analysed using the χ2 test or Fisher’s exact test (in the event of small expected frequencies). Correlations were considered significant when the two tailed p value was less than 0.05. All evaluations were performed using the computer program SAS Stat v 6.12. Box-Whisker plots were generated in the basic module of the program Statistica. Correlations were analysed using the Wilcoxon rank sum test.
RESULTS
Loss of heterozygosity analysis at the NF1 gene locus
DNA from 100 sporadic colorectal tumours were examined for LOH at the NF1 gene locus using three intragenic polymorphic markers: IVS27AAAT2.1, IVS38GT53.0, and NF1 exon 5 RsaI RFLP.
At the NF1 exon 5 RsaI locus, 45 of 100 patients were heterozygous (45%) and six of 45 (13.3%) demonstrated LOH (fig 1A). At the IVS27AAAT2.1 locus, 52 of 100 patients were heterozygous (52.0%) and seven of 52 (13.5%) demonstrated LOH. The heterozygosity of the IVS38AC53.0 marker was 70.0% (70 of 100 patients were heterozygous) and 14 of the 70 (20.0%) demonstrated LOH (fig 1B). Individual results for all three NF1 LOH analyses are displayed and summarised in table 1. Using these three intragenic polymorphic markers, total heterozygosity achieved was 92% (92 of 100 samples tested) and in 19 of 92 heterozygous tumours (20.7%) LOH was detected (table 1).
Heterozygosity and results of loss of heterozygosity (LOH) analysis for three NF1 gene markers

Loss of heterozygosity (LOH) analysis of the NF1 gene in sporadic colon cancer. M, DNA marker pBR322/MspI; N, normal colon tissue; T, tumour tissue. (A) LOH analysis of RsaI NF1 exon 5 RFLP polymorphic marker. 1, homozygous A2/A2 sample; 2, homozygous A1/A1 sample; 3, heterozygous sample without LOH; 4, heterozygous sample with LOH. (B) LOH analysis of IVS38GT53.0 polymorphic marker. 1, 2, heterozygous sample without LOH; 3, heterozygous sample with LOH.
LOH at the NF1 gene and clinicopathological characteristics
The results of LOH analysis were correlated to the clinicopathological features of patients and their tumours (age, sex, tumour size, tumour grade, Dukes’ stage of tumour). There was no correlation between the LOH of the NF1 gene and clinicopathological characteristics of patients and tumour samples (table 2).
Clinicopathological features of 92 heterozygous patients with colon cancer stratified by NF1 loss of heterozygosity (LOH) status
No statistically significant correlation was found between the LOH of the NF1 gene and age or sex of patients, but NF1 LOH was more frequent in males (24.4%, 10 of 41 patients) and in patients younger than 70 years (23.1%, 12 of 52 patients) (table 2).
NF1 LOH was more frequent in tumours smaller than 5 cm in diameter (14 of 52 tumours; 26.9%) than in larger ones (3 of 18 tumours; 16.7%) but this difference was not statistically significant (table 2).
A positive trend was observed between NF1 LOH and histological grade of the tumour: in tumours of a higher histological grade, NF1 LOH was more frequent. In 21.9% (7 of 32 tumours) of well differentiated tumours, 26.3% (5 of 19 tumours) of moderately differentiated tumours, and 33.3% (4 of 12 tumours) of poorly differentiated tumours LOH was detected, but this trend was not statistically significant (table 2).
NF1 LOH was more frequent in tumours that were classified as Dukes’ A (6 of 18 tumours; 33.3%) and Dukes’ C (11 of 45 tumours; 24.4%) then in tumours classified as Dukes’ B, but this was not statistically significant (table 2).
NF1 mRNA expression analysis
NF1 mRNA expression was analysed in 55 selected tumour samples and their corresponding normal mucous tissue by real time RT-PCR. There was a statistically significant increase in NF1 gene expression in tumour tissue compared with corresponding normal tissue (p = 0.04291) (fig 2). No correlation was found between NF1 mRNA expression and histological grade or Dukes’ stage of the tumours.
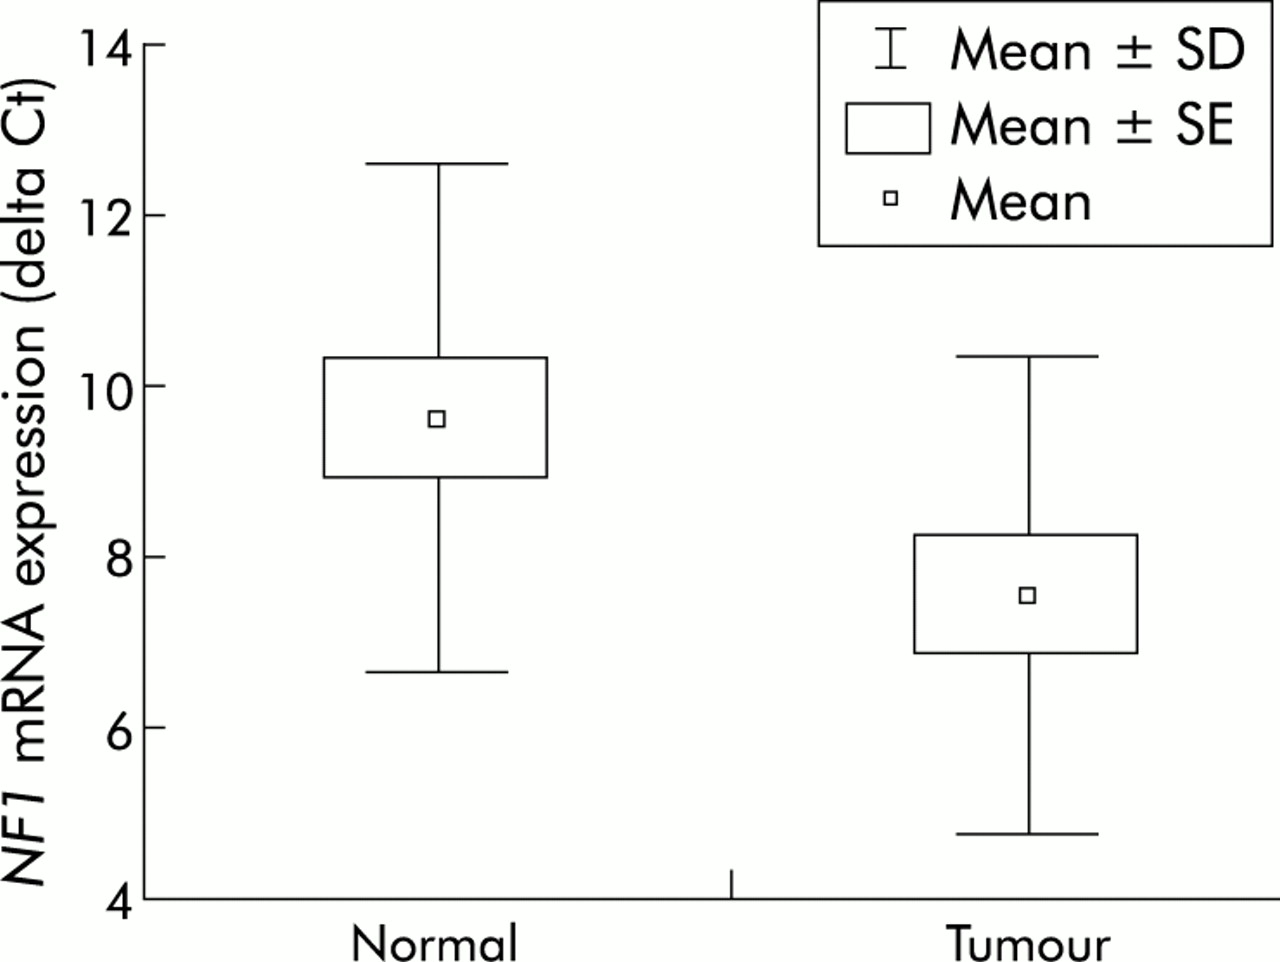
NF1 mRNA expression in sporadic colon cancer and corresponding normal mucous tissue.
NF1 mRNA isoform type I and II expression analysis
In order to examine NF1 mRNA isoform type I and II expression by quantitative RT-PCR in our samples, specific oligonucleotide primers that amplify both isoforms were used. NF1 mRNA isoform type I and II expression was defined as the proportion of isoform type I in analysed samples according to the results of densitometric analysis.
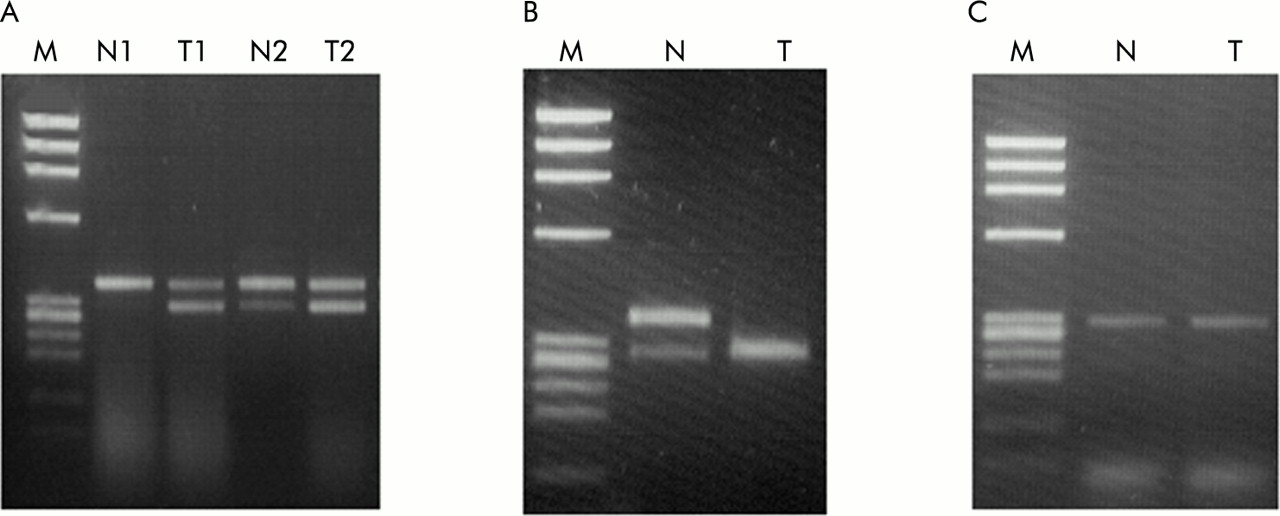
Then, NF1 mRNA isoform type I and II expression was examined in 55 selected tumour samples and corresponding normal mucous tissues by quantitative RT-PCR. Several different expression patterns were observed. In 6/55 (10.9%) normal mucous tissue samples, only isoform type II was detected. In 34/55 (61.8%) normal mucous tissue samples, both isoforms were present and isoform type II was the dominant isoform, while isoform type I was the only isoform detected in 7/55 (12.7%) analysed samples. In 65.5% (36/55) of corresponding tumour samples, both isoforms were detected, with isoform type I being expressed more than isoform type II, while in the remaining 30.9% (17/55) of tumours only isoform type I was detected (fig 3, table 3).
NF1 isoform type I and II expression in normal and tumour colon tissue

Expression of NF1 mRNA isoform types I and II in colon tumour and corresponding normal mucous tissue (15 cm from the tumour). M, DNA marker IX (φx 174/HaeIII); N, normal sample; T, tumour sample. (A) N1, normal sample with only isoform type II expression; T1, tumour sample with both isoforms expressed, isoform type I being the dominant form; N2, normal sample with both isoforms expressed, isoform type II being the dominant form; T2, tumour sample with equal expression of both isoforms. (B) N, normal sample with both isoforms expressed, isoform type II being the dominant form; T, tumour sample with only isoform type I expression. (C) N, normal sample with only isoform type I expression; T, tumour sample with only isoform type I expression.
There was a statistically significant increase in NF1 mRNA type I isoform expression (p = 0.0005) in tumour tissue compared with corresponding normal colon tissue (fig 4). There was no correlation between NF1 mRNA isoform type I and II expression and histological grade or Dukes’ stage.

NF1 isoform type I and II expression in sporadic colon cancer and corresponding normal mucous tissue.
In 10 tumour pairs it was possible to analyse expression of these two isoforms in normal mucous tissue at variable distances (5, 10, and 15 cm) from the tumour, as well as in corresponding tumour tissue. In eight samples analysed there was a sequential transition from the dominant expression of isoform type II in normal mucous tissue samples 15 cm away from the tumour to dominant expression of isoform type I in corresponding tumour tissue. As the analysed sample was closer to the tumour, expression of isoform type I was higher (fig 5A). In the remaining two normal mucous tissue samples analysed, isoform type I was the only detected isoform, even at a distance of 15 cm from the tumour, as well as in the corresponding tumour tissue sample where its expression was higher (fig 5B).

Expression of NF1 mRNA isoform types I and II in colon tumour and corresponding normal mucous tissue at variable distances from the tumour. M, DNA marker IX (φx 174/HaeIII); N, normal sample; T, tumour sample (A) Transition from dominant expression of NF1 isoform type II in normal mucous tissue 15 cm away from the tumour to dominant expression of NF1 isoform type I in the tumour itself. Isoform type I expression was higher as the analysed sample was closer to the tumour. (B) NF1 isoform type I was the only isoform expressed in tumour and the corresponding normal mucous tissue, independent of its distance from the tumour.
Immunohistochemical analysis of neurofibromin
Expression of neurofibromin in sporadic colon cancer was analysed by immunohistochemistry on formalin fixed paraffin embedded tissue sections. Expression of neurofibromin was evaluated using antibodies specific for the N and C terminus of the protein. Of 100 sporadic colon cancers studied, 77/100 (77.0%) stained positively for the N terminus of neurofibromin (fig 6A) and 68/100 (68.0%) stained positively for the C terminus of neurofibromin (fig 6B). All C terminus positive samples stained positively for the N terminus also while 23/100 (23.0%) stained negatively for both ends of neurofibromin.

Immunohistochemical analysis of neurofibromin in sporadic colon cancer. Positive staining in colon adenocarcinomas was seen as membranous/cytoplasmic staining of tumour cells with negative surrounding tissue. Original magnification: ×400. (A) Neurofibromin (N). (B) Neurofibromin (D).
Results of immunohistochemical analysis were correlated with grade and Dukes’ stage of tumours and no statistically significant difference in staining was found.
When we examined the results of immunohistochemical analysis for LOH positive tumours, 6/19 (31.6%) were found to be positive for both the N and C terminus of neurofibromin, 10/19 (52.6%) were found to be negative for both the N and C terminus of neurofibromin, and 3/19 (15.8%) were found to be positive for the N terminus and negative for the C terminus of neurofibromin.
DISCUSSION
Colon cancer arises from progressive accumulation of genetic and epigenetic changes that cause the transformation of normal colon mucous cells into adenocarcinomas.3,21 The role of NF1 gene/protein in the development and progression of colon cancer is not known. The aim of our study was to investigate the role of NF1 gene in sporadic colon cancer tumorigenesis. In an effort to elucidate this role, we analysed loss of heterozygosity (LOH) and expression of the NF1 gene at the mRNA and protein levels in sporadic colon tumours.
LOH of NF1 gene was detected in several studies of NF1 associated malignant tumours. Rasmussen and colleagues22 determined that NF1 gene LOH was present in 13% of dermal neurofibromas, 40% of plexiform neurofibromas, and 60% of malignant peripheral nerve sheath tumours. In the LOH studies, three polymorphic markers were used. LOH observed for polymorphic marker NF1 exon 5 RsaI RFLP, IVS27AAAT2.1, and IVS38AC53.0 was 13.3%, 13.5%, and 20.0%, respectively. The highest percentage of LOH at the NF1 gene locus was detected for VNTR marker IVS38AC53.0. These findings are similar to those of Gutzmer et al in their study of desmoplastic neurotropic melanomas.23 Total heterozygosity achieved using these three intragenic polymorphic markers was 92%, and in 20.7% of heterozygous samples LOH was detected, but there was no statistically significant difference in the frequency of LOH in association with age or sex of the patients, or size, Dukes’ stage, or stage of the tumour.
In this study, NF1 mRNA expression was analysed in 55 selected tumour samples and their corresponding normal mucous tissue by real time RT-PCR. There was a statistically significant increase in NF1 gene expression in tumour tissue compared with corresponding normal tissue (p = 0.04291). This is a very interesting finding because neurofibromin acts as a negative regulator of Ras activity. Ras gene is very often mutated and overexpressed in colon cancer and plays an important role in the development and progression of colon cancer. Increased expression of the NF1 gene raised the new question of whether or not this increase is a type of defence mechanism of tumour cells. Hence we decided to examine expression of different NF1 mRNA isoforms.
Alternative splicing is an important mechanism in creating proteome diversity and regulating gene expression in different tissues and developmental stages.24 Control of alternative splicing can be deregulated in human disease and tumorigenesis.25 The NF1 gene is also subjected to alternative splicing and it was proposed that this mechanism could influence regulation of the Ras/MAPK signalling pathway during development and differentiation of normal tissue, as well as in the development and progression of tumours. NF1 mRNA transcripts that have the exon 23a (type II) and those lacking it (type I) are expressed in different ratios in different cell types and at different stages of cell differentiation.14 Due to the specific location of exon 23a in the NF1-GRD domain, the different abilities of these two isoforms to bind Ras-GTP, and different catalytic activity, it was proposed that they might have different influences on Ras signalling.
In the study of Mochizuki et al, the normal cerebrum predominantly expressed NF1 mRNA isoform type II whereas primitive neuroectodermal tumours predominantly expressed the NF1 mRNA isoform type I. In addition, glioblastomas showed higher type I expression than adjacent brain samples.26 Wimmer et al have shown that isoform type II is the dominantly expressed isoform in normal adult brain and in the majority of other adult tissues (heart muscle, liver, lung, kidney, pancreas, skeletal muscle, and placenta). This was observed for sporadic pilocytic astrocitomas also, as opposed to primary neuroblastomas where isoform type I was dominantly expressed.27 In 1991, Nishi et al found that isoform type I was the dominantly expressed isoform in fetal brain and undifferentiated neuroectodermal tumours while isoform type II was present in well differentiated tumours.14
Iyengar and colleagues16 analysed expression of these two isoforms in ovarian carcinoma and detected a significant decrease in isoform type II expression and an increase in isoform type I expression in ovarian carcinoma cell lines and tumour tissue with respect to expression of these two isoforms in normal ovarian epithelial cells. Dominant expression of isoform type II was detected in normal gastric mucous while both isoforms were equally expressed in gastric cancer cell lines.28
In this study, expression of these two isoforms was examined in sporadic colon tumours and their corresponding normal mucous tissue. There was a statistically significant increase in NF1 mRNA type I isoform expression (p = 0.0005) in tumour tissue compared with the corresponding normal colon tissue. There was no correlation between NF1 mRNA isoform type I and II expression and histological grade or Dukes’ stage of the tumours.
In several tumour pairs we were able to analyse NF1 mRNA isoform type I and II expression in normal mucous tissue at variable distances (5, 10, and 15 cm) from the tumour. In some cases we were able to detect continuous transition from dominant expression of isoform type II in normal mucous tissue samples 15 cm away from the tumour to dominant expression of isoform type I in tumour tissue itself. Expression of isoform type I was higher as the analysed sample was taken closer to the tumour. In two normal mucous tissue samples taken 15 cm away from the tumour, the dominantly expressed isoform was isoform type II. This isoform was dominantly expressed in the corresponding tumour also, and its level was even higher. This result could indicate that molecular changes in NF1 gene expression are present in histologically normal tissue even 15 cm away from the tumour and that they precede the genetic changes present in the tumour.
Expression of neurofibromin was analysed by immunohistochemistry. Expression of neurofibromin was evaluated using antibodies specific for the N and C terminus of the protein. Of 100 sporadic colon cancers studied, 77/100 (77.0%) stained positively for the N terminus of neurofibromin and 68/100 (68.0%) stained positively for the C terminus of neurofibromin. All C terminus positive samples stained positively for the N terminus also while 23/100 (23.0%) stained negatively for both ends of neurofibromin.
When we examined the results of immunohistochemical analysis for LOH positive tumours, 52.6% were found to be negative for both the N and C terminus of neurofibromin and 15.8% were found to be positive for the N terminus and negative for the C terminus of neurofibromin.
Results of immunohistochemical analysis were correlated with grade and Dukes’ stage of the tumours and there was no statistically significant difference
We conclude that although we detected loss of heterozygosity of the NF1 gene in sporadic colon cancer, it seems that this event, as well as neurofibromin expression, are not important in the development and progression of sporadic colon cancer. In our study we observed differential isoform type I and II expression that changed as tumorigenesis progressed and this mechanism may be more important in the regulation of NF1 function in sporadic colon cancer. Discovering the function of different signalling pathways and elucidating the process of tumorigenesis will reveal new diagnostic and prognostic markers of disease as well as potential targets for therapeutic intervention. Our findings suggest that the NF1 gene may a role in the development and progression of colon cancer and the NF1 gene may be a potential tumour marker and a new potential target for colon cancer therapy.
REFERENCES
Footnotes
-
Published online first 19 April 2005
-
Conflict of interest: None declared.