Article Text

Abstract
Objectives We have previously identified a 115-gene signature that characterises the metastatic potential of human primary colon cancers. The signature included the canonical Wnt target gene BAMBI, which promoted experimental metastasis in mice. Here, we identified three new direct Wnt target genes from the signature, and studied their functions in epithelial–mesenchymal transition (EMT), cell migration and experimental metastasis.
Design We examined experimental liver metastases following injection of selected tumour cells into spleens of NOD/SCID mice. Molecular and cellular techniques were used to identify direct transcription target genes of Wnt/β-catenin signals. Microarray analyses and experiments that interfered with cell migration through inhibitors were performed to characterise downstream signalling systems.
Results Three new genes from the colorectal cancer (CRC) metastasis signature, BOP1, CKS2 and NFIL3, were identified as direct transcription targets of β-catenin/TCF4. Overexpression and knocking down of these genes in CRC cells promoted and inhibited, respectively, experimental metastasis in mice, EMT and cell motility in culture. Cell migration was repressed by interfering with distinct signalling systems through inhibitors of PI3K, JNK, p38 mitogen-activated protein kinase and/or mTOR. Gene expression profiling identified a series of migration-promoting genes, which were induced by BOP1, CKS2 and NFIL3, and could be repressed by inhibitors that are specific to these pathways.
Conclusions We identified new direct Wnt/β-catenin target genes, BOP1, CKS2 and NFIL3, which induced EMT, cell migration and experimental metastasis of CRC cells. These genes crosstalk with different downstream signalling systems, and activate migration-promoting genes. These pathways and downstream genes may serve as therapeutic targets in the treatment of CRC metastasis.
- COLORECTAL METASTASES
- CELL BIOLOGY
- CELL MIGRATION
- CELL SIGNALLING
- COLORECTAL CANCER
Statistics from Altmetric.com
Significance of this study
What is already known on this subject?
Aberrant canonical Wnt/β-catenin signalling plays essential roles in initiation and early progression of colorectal cancer, as well as in invasion and metastasis.
Wnt/β-catenin signalling promotes colorectal cancer (CRC) metastasis through upregulating target genes like S100A4 and BAMBI.
Epithelial–mesenchymal transitions (EMTs) are critical steps that allow polarised epithelial colon tumour cells to become mesenchymal like, and to enhance cell migration and invasion.
What are the new findings?
Three new direct Wnt/β-catenin target genes, BOP1, CKS2 and NFIL3, are identified from the previously reported CRC metastasis signature.
BOP1, CKS2 and NFIL3 overexpression in CRC cells promotes experimental metastasis in mice, while knocking down the three genes reduces metastasis.
Overexpression of these genes in CRC cells induces EMTs and enhances cell migration and invasion in tissue culture, while knocking down these genes reduces cell motility, and enhances epithelial features.
The new Wnt/β-catenin target genes are involved in crosstalk with cell migration-related systems, PI3K, JNK, p38 and/or mTOR signalling.
How might it impact on clinical practice in the foreseeable future?
Small-molecule inhibitors of JNK, PI3K, p38 and mTOR, alone or in combinations, can now be examined in further experimental systems and in preclinical settings.
Introduction
Human colorectal cancer (CRC) is prevalent worldwide, with mortality largely caused by metastasis. Substantial work has established an essential role for aberrant canonical Wnt signalling in the initiation and early progression of CRC as well as in later stages of invasion and metastasis.1–3 Recently, our labs have shown that two Wnt/β-catenin target genes, S100A4 and BAMBI, can promote cell migration in culture and experimental metastasis in mice.4 ,5 Moreover, we have identified a CRC metastasis signature of 115 genes, which can distinguish non-metastatic primary tumours from metastatic primary tumours.5 Activated Wnt/β-catenin signalling is also essential in the malignant progression of other carcinomas, such as breast, prostate and bladder cancers.6–9
Cancer metastasis develops through sequential steps, involving the migration of tumour cells from the site of primary growth, invasion through the basement membranes and neighbouring tissues, extravasation into the blood or lymphatic systems, colonisation of distant organs and finally the establishment of metastatic tumours.10 ,11 During these processes, epithelial–mesenchymal transitions (EMTs) are critical steps that allow polarised epithelial tumour cells to become mesenchymal like, enhancing cell migration and invasion and generating stem cell-like properties.2 ,12–15 Cell migration is controlled by extracellular and cell surface components, such as growth factors, cytokines and cell adhesion molecules, as well as intracellular signalling systems, which orchestrate cytoskeleton remodelling.16–18 Three decades of basic and clinical research and more recent genomic sequencing have focused on alterations in human colorectal carcinomas, which have shown that most frequent changes in CRC progression include activators of Wnt/β-catenin, phosphoinositide 3-kinase (PI3K), mitogen-activated protein kinase (MAPK) and mammalian target of rapamycin (mTOR) signalling and inhibitors of TGFβ and TP53 signalling.2 ,10 ,19 These signalling systems also play important roles in cell migration: the PI3K pathway establishes the leading edge of migratory cells towards chemoattractant sources;20–22 the JNK pathway stimulates focal adhesion disassembly to promote cell migration;23 ,24 p38 MAPK signalling induces phosphorylation of several substrates that are important for cell migration;25 ,26 and the mTOR pathway mediates phosphorylation of focal adhesion proteins, and facilitates F-actin reorganisation.27 ,28 Our previous study has shown that BAMBI inhibits TGFβ signalling to facilitate cell migration and experimental metastasis.5
In the present study, we identified three new and direct Wnt/β-catenin target genes from the previously reported CRC metastasis signature,5 BOP1, CKS2 and NFIL3, and found that overexpression of these genes promoted experimental metastasis in mice. Furthermore, these genes induced EMT, and enhanced cell migration in tissue culture. We also showed that the new Wnt/β-catenin target genes were involved in crosstalk with cell migration-related systems, PI3K, JNK, p38 and/or mTOR signalling.
Material and methods
Experimental metastasis assay
All animal experiments were performed by the EPO company (Experimental Pharmacology & Oncology Berlin-Buch) according to European Union and German institutional regulations. Stable LS174T, SW480 and SW620 cell lines were injected into the spleens of 6–8 weeks old male NOD/SCID mice as described.5 Spleens and livers were fixed in 4% formaldehyde (Sigma, Cat No 16005) to prepare paraffin-embedded blocks. Pictures of freshly isolated organs were recorded with a Canon digital camera.
Transwell assay
Single cell migration was evaluated by using 8 or 12 μm polycarbonate nucleopore filter-containing Boyden chambers (Millipore, PIEP15R48/PIXP01250). For invasion assays, Matrigel (100 μg/cm2; BD Biosciences, Cat No 354234) was preloaded to the upper side of the membrane. A total of 104 cells were plated in the upper chambers for 6–8 h to attach. Medium without fetal bovine serum (FBS) was changed in the upper chambers, while complete media (containing 10% FBS and indicated inhibitors) were added to the lower chambers. After 24 h of incubation, migrated/invaded cells were visualised under an inverted microscope (Zeiss Axioskop). Cells were counted in four separate fields per filter; three wells were used for each treatment; each experiment was repeated two to three times.
Results
New β-catenin/TCF4 transcription target genes from a metastasis signature
In an effort to identify Wnt/β-catenin target genes from the 115-gene metastasis signature, which was previously characterised,5 human CRC cell lines were employed, including HCT116 and LS174T cells with activating β-catenin mutations, and DLD1, HT29 and SW480 cells with truncating APC mutations.29 ,30 Wnt/β-catenin signalling could be further activated in these cells by the GSK3β inhibitor Chir98014, leading to upregulation of the classical Wnt target gene AXIN2 (figure 1A; left group of cells).31 Conversely, transfection of β-catenin siRNA in HCT116, SW480 and HT29 cells led to reduced expression of AXIN2 (figure 1B; left group of cells). Remarkably, the expression of three genes from the 115-gene signature, BOP1, CKS2 and NFIL3, was markedly upregulated on treatment with Chir, and downregulated on β-catenin siRNA transfection (figure 1A,B; middle and right groups of cells. The expression of other genes from the signature is provided in online supplementary table S1).

BOP1, CKS2 and NFIL3 are direct β-catenin/TCF4 transcription target genes. (A) Real-time quantitative PCR (RT-qPCR) analysis of enhanced mRNA levels of AXIN2, BOP1, CKS2 and NFIL3 in the colorectal cancer (CRC) cell lines HCT116, HT29, DLD1, SW480 and LS174T treated with the GSK3β inhibitor and Wnt activator Chir98014. Expression levels in control cells treated with solvent were normalised to 1.0. Unless indicated separately, all p values are provided in the online supplementary statistical data. (B) RT-qPCR analysis of reduced mRNA levels of AXIN2, BOP1, CKS2 and NFIL3 in the CRC cell lines HCT116, HT29 and SW480 transfected with β-catenin siRNA. Expression levels in control cells transfected with scrambled siRNAs were set as the basis. (C) Schematic representation of the human BOP1, CKS2 and NFIL3 promoters. 2500 bp upstream and 500 bp downstream sequences from the TSS (transcriptional start site) were analysed, and potential TCF4 transcription factor binding sites are indicated as blue boxes; chromatin immunoprecipitation-quantitative PCR (ChIP-qPCR) was performed to cover all the potential binding sites. PCR products indicate enriched areas. (D) Enrichment of TCF4 and β-catenin on promoter regions of BOP1, CKS2 and NFIL3 in (C) was analysed by ChIP-qPCR in SW480 (upper panel) and HCT116 cells (lower panel); AXIN2 was used as positive, GAPDH as negative control. (E) SW480 cells were cotransfected with Renilla plasmid and reporter vectors containing wild type TCF4-binding sites (TOP-FLASH, FOP-AXIN2/BOP1/CKS2/NFIL3-FLASH) or mutant binding sites (FOP-Flash, FOP-mAXIN2/mBOP1/mCKS2/mNFIL3-FLASH; m indicates mutant), and treated with Chir98014 for 24 h. Luciferase activity was normalised to Renilla, and FOP-Flash-transfected cells were normalised arbitrarily to 1.
We analysed the promoter sequences of the human BOP1, CKS2 and NFIL3 genes in the TRANSFAC database,32 which revealed potential TCF4-binding sites upstream and downstream of the transcriptional start sites (figure 1C; blue boxes). To test whether these genes were direct Wnt/β-catenin/TCF4 targets, we performed chromatin immunoprecipitation (ChIP) in SW480 and HCT116 cells using antibodies against TCF4 or β-catenin. Real-time quantitative PCR (RT-qPCR) revealed enrichment of TCF4 and β-catenin in the proximal binding sites from promoters of BOP1 and NFIL3, and in the central binding site of CKS2 (figure 1C; PCR products, figure 1D, see online supplementary figure S1A–C). Both anti-TCF4 and anti-β-catenin antibodies immunoprecipitated the same chromosomal regions of each gene, indicating that β-catenin/TCF4 transcriptional complexes form around these sites.
To further assess the functionality of the TCF4-binding sites, we cloned short ChIP-qPCR fragments of the promoters into the FOP-Flash vector, which does not respond to canonical Wnt stimulation (figure 1E and see online supplementary figure S1D–F; left columns).33 Upregulation of luciferase activity was observed after insertion of fragments from the AXIN2, BOP1, CKS2 or NFIL3 promoters containing TCF4-binding sites, followed by transient transfection in SW480 and HCT116 cells and activation with Chir98014 or Wnt3a (figure 1E, see online supplementary figure S1D–F; right columns). Upregulation was similar as transfection of wild-type TOP-Flash plasmids, while point-mutated versions of the plasmids were inactive (figure 1E, see online supplementary figure S1D–F. Apparently, BOP1, CKS2 and NFIL3 are direct transcription target genes of Wnt/β-catenin/TCF4 signals.
Overexpression of BOP1, CKS2 and NFIL3 promotes experimental metastasis in LS174T CRC cells
In microarray profiling of human patient samples, BOP1, CKS2 and NFIL3 were upregulated in metastatic primary tumours and metastases, compared with non-metastatic tumours and normal tissues (shown for BOP1 in online supplementary figure S2A, and for CKS2 and NFIL3 in ref. 5). We established stable cell lines of the human LS174T cells that overexpressed BOP1, CKS2 and NFIL3 cDNAs; LS174T cells are widely used in experimental metastasis assays.5 ,34 ,35 As seen by northern and western blotting, endogenous expression of BOP1, CKS2 and NFIL3 was low or absent; in contrast, transfected clones abundantly overexpressed BOP1, CKS2 or NFIL3 mRNA and protein (figure 2A). LS174T cells that overexpressed the three genes did not change their proliferation properties (see online supplementary figure S2B).

BOP1, CKS2 and NFIL3 overexpression promotes experimental metastasis of LS174T cells. (A) Examination of BOP1 (left), CKS2 (middle) and NFIL3 (right) levels by northern (upper panel) and western (lower panel) blotting in stably transfected LS174T cell lines. A control clone and various BOP1, CKS2 and NFIL3 clones are shown and used in the experiments shown below. (B and C) Cells of parental LS174T and the indicated stable cell lines were injected into the spleens of NOD/SCID mice. Numbers of mice injected and their metastatic status are indicated in (C). Arrowheads in (B) indicate macrometastatic nodules; all the images of organs were processed at the same scale. (Right) In situ hybridisation with human BOP1, CKS2 or NFIL3 probes of corresponding tumorous livers confirmed the human origin of metastatic cells. Magnitude, ×50. (D) The percentages of liver surfaces covered with macrometastatic nodules from the experiments in (B) were quantified.
We employed spleen injection to measure experimental liver metastasis of the stable cell lines.36 A total of 2×10⁶ cells from each clone were injected into spleens of immunocompromised NOD/SCID mice. After 4 weeks, spleens were examined for primary tumours and livers for metastases (figure 2B). The majority of mice injected with LS174T cells that overexpressed BOP1, CKS2 or NFIL3 developed multiple macroscopic liver metastases (figure 2B, C), while parental LS174T or control cells were metastasis free, with the exception of one cell line that displayed a small lesion in the liver (figure 2C). High metastatic burden was observed in mice injected with the BOP1-transfected, CKS2-transfected or NFIL3-transfected clones, which covered 10%–15% of the liver surfaces (figure 2D, see online supplementary figure S2C). In situ hybridisation of tumorous livers and spleens confirmed the strong expression of human BOP1, CKS2 and NFIL3 in the lesions (figure 2B; right panel, see online supplementary figure S2D). In addition, Ki67 staining revealed highly proliferative cells in both primary and metastatic tumours (see online supplementary figure S2E). Taken together, overexpression of BOP1, CKS2 or NFIL3 strongly promotes experimental metastasis of LS174T cells in the spleen injection model.
BOP1, CKS2 and NFIL3 induce EMT, enhance cell migration and promote experimental metastasis in SW480 cells
In order to characterise cell biological properties, we examined the transfected LS174T cells, and also used retrovirus transduction to establish new stable SW480 cells that overexpressed each gene. Elevated expression of BOP1, CKS2 and NFIL3 was observed in transduced SW480 cells at both mRNA and protein levels (see online supplementary figure S3A, figure 3A; right upper panels). Overexpression of one gene did not markedly affect the endogenous levels of the other two genes (see online supplementary figure S3A, figure 3A; upper panels). As with LS174T cells, stable transduction of the three genes did not change proliferation of SW480 cells (see online supplementary figure S3B), and the localisation of the exogenous proteins were indistinguishable from the endogenous ones (see online supplementary figure S3C).

Overexpression of BOP1, CKS2 or NFIL3 in colorectal cancer cells induces cell scattering and changes of epithelial–mesenchymal transition (EMT) markers, and enhances cell migration and invasion. (A) BOP1, CKS2 and NFIL3 proteins (upper panels) and EMT markers E-cadherin, N-cadherin, fibronectin and vimentin (lower panels) in transfected LS174T and virus-transduced SW480 cells were examined by western blotting. Tubulin was used as loading control. (B, left column) Representative bright-field images of stable SW480 cells. Scale bar, 100 μm. (B, right columns) Stable SW480 cells were stained with fluorescent phalloidin to show actin structures, or by immunofluorescence with anti-E-cadherin, anti-N-cadherin, anti-fibronectin or anti-vimentin antibodies (all in red); DAPI (blue) was used for staining nuclear DNA. Scale bar, 50 μm. (C) Cell migration was measured by wound-healing assays of near-confluent monolayers of stable SW480 cells. (D) Cell migration or invasion of stable SW480 cells in transwell assays without or with Matrigel coating of filters. (E) Cell migration of stable LS174T cell lines in transwell assays.
Remarkably, as shown by bright field microscopy, overexpression of BOP1, CKS2 and NFIL3 induced fibroblast-like cell morphologies in SW480 cells, compared with the cobble stone-like shapes of control cells (figure 3B; left column). Phalloidin staining showed that F-actin structures were elongated in the spindle-shaped BOP1, CKS2 and NFIL3 cells, while control cells showed circumferential actin belts (figure 3B; second column). This indicates the occurrence of EMT, which was further examined by the expression of well-known EMT markers.10 ,12 The protein levels of the epithelial cell adhesion molecule E-cadherin were reduced in BOP1, CKS2 and NFIL3 cells, and remaining E-cadherin was largely located in the cytoplasm, compared with the membrane staining in controls (figure 3B; third columns). In contrast, the mesenchymal adhesion and cytoskeletal proteins—N-cadherin, fibronectin and vimentin—were enhanced in the elongated cells (figure 3B; right columns). Western blotting and RT-qPCR analyses quantified the changes of these EMT markers in the transduced SW480 cells (figure 3A; right lower panels, see online supplementary figure S3D). Stable LS174T cell lines showed morphological alterations less clearly upon overexpression of the three genes (not shown), but exhibited changes of the EMT markers on mRNA and protein levels, similar to those observed in SW480 cells (figure 3A; left lower panels, see online supplementary figure S3E). We also examined crucial transcription factors that regulate EMT, like Snail1/2, Twist1/2, ZEB1/2 and FOXC2:15 Snail1 and Snail2 exhibited upregulation in stable LS174T and SW480 cell lines that overexpressed BOP1, CKS2 and NFIL3 (see online supplementary figure S3F); the expression of other transcription factors changed little, or were not detectable in the cell lines used (not shown).
Since EMT is often associated with enhanced cell motility,2 ,10 ,12 we examined the migration of stable SW480 cells both in wound healing and transwell assays. Stable cells that overexpressed BOP1, CKS2 and NFIL3 migrated into the wounds at levels that were moderately, yet significantly higher than in controls (figure 3C and see online supplementary figure S3G). In transwell assays using 8 µm nucleopore filters, all three stable cell lines showed strongly increased migration to the lower chambers that contained serum (figure 3D and see online supplementary figure S3H; left column). Moreover, stable cells also displayed enhanced invasion in the transwell assays with Matrigel-coated filters (figure 3D and see online supplementary figure S3H; right column). Using 12 µm filters, stable LS174T cell lines that overexpressed BOP1, CKS2 and NFIL3 also exhibited accelerated migration (figure 3E). These findings demonstrate that CRC cells overexpressing BOP1, CKS2 or NFIL3 produce morphologies characteristic of EMT, and show enhanced migration and invasion in cell culture. Moreover, exogenous BOP1, CKS2 and NFIL3 also promoted experimental metastasis of SW480 cells (see online supplementary results and figure S3I–N).
Knocking down BOP1, CKS2 and NFIL3 in SW620 cells promotes epithelial properties and inhibits experimental metastasis
To study potential endogenous functions of BOP1, CKS2 and NFIL3 in CRC cells, we took advantage of the SW620 cell line: SW620 cells are derived from lymph node metastases of the same patient with colon cancer as SW480 cells, but show high capability of experimental metastasis.30 ,37 We established stable SW620 clones, in which endogenous BOP1, CKS2 and NFIL3 were lowered by shRNA transduction (figure 4A and see online supplementary figure S4C,D). Knocking down these genes did not significantly influence cell proliferation (see online supplementary figure S4E). In contrast, both wound healing and transwell assays showed strongly reduced cell migration of the shRNA-transduced clones (figure 4B, C and see online supplementary figure S4F).

Knocking down BOP1, CKS2 or NFIL3 reduces cell migration, and promotes epithelial features of SW620 cells. (A) Western blotting analysis of BOP1, CKS2 and NFIL3 in SW480 and SW620 cells that were stably transduced with control retrovirus or shRNA retroviruses; for clarity, only stable cells used in the following experiments are shown here; the entire blots are in online supplementary figure S4D. Tubulin was used as loading control. (B) Cell migration was measured by wound-healing assays of near-confluent monolayers of stable SW620 cells. (C) Cell migration of stable SW620 cells was measured by transwell assays. (D) Real-time quantitative PCR examination of relative expression levels of E-cadherin, N-cadherin and fibronectin in stable SW620 cells. (E) Expression of E-cadherin in the stable SW620 cells was examined by western blotting. Tubulin was used as loading control. (F) Stable SW620 cells were stained by immunofluorescence with anti-E-cadherin antibody (red); DAPI (blue) was used for staining nuclear DNA. Scale bar, 50 μm. EMT, epithelial–mesenchymal transition.
Knocking down BOP1, CKS2 and NFIL3 did not influence the morphology of SW620 cells significantly (not shown). However, certain markers of EMT exhibited the expected changes: RT-qPCR showed upregulation of E-cadherin and downregulation of N-cadherin and fibronectin mRNAs, respectively (figure 4D), and E-cadherin protein was upregulated (figure 4E). Immunofluorescence with anti-E-cadherin antibody also showed increased membrane staining of E-cadherin (figure 4F). These results suggest that knocking down BOP1, CKS2 and NFIL3 promotes epithelial properties of SW620 cells. We also overexpressed BOP1, CKS2 and NFIL3 in the corresponding knock-down cells to rescue and confirm the effects of shRNA (see online supplementary figure S4G, H).
To study whether high endogenous BOP1, CKS2 and NFIL3 contribute to experimental metastasis of SW620 cells, we injected 1×10⁶ parental, control and shRNA cells into spleens of NOD/SCID mice, and after 30 days, primary spleen tumours and liver metastases were examined. Mice injected with either parental or control cells exhibited more than 100 metastatic nodules in the livers; in contrast, mice injected with shBOP1, shCKS2 or shNFIL3 cells showed strongly reduced numbers of metastatic nodules (figure 5A, B). The reduced metastatic burden could also be confirmed by the lighter relative weight of livers (figure 5C). We confirmed the effects of shRNA treatments with another panel of knock-down cells (see online supplementary figure S5A–C). H&E staining and Ki67 immunohistochemistry revealed that the few metastases generated by the knock-down cells were indistinguishable from those of control cells (see online supplementary figure S5D). We also examined the expression of EMT markers and of BOP1, CKS2 and NFIL3 in the tumorous tissues. Primary spleen tumours generated by shRNA knock-down cells showed the expected upregulation of E-cadherin and downregulation of N-cadherin and fibronectin, as well as the reduced expression of BOP1, CKS2 and NFIL3 (figure 5D, E). In liver metastases, levels of E-cadherin, fibronectin and the three Wnt target genes were similar in control and in knock-down cells; only N-cadherin showed decreased levels (figure 5D, E). These data may indicate that subpopulations without strong knockdown of each gene were enriched in the metastases. Overall, these findings with SW620 cells confirm the importance of endogenous BOP1, CKS2 and NFIL3 for promoting EMT and experimental metastasis.

Knocking down BOP1, CKS2 and NFIL3 inhibits experimental metastasis of SW620 cells. (A) SW620 control cells and shBOP1, shCKS2 and shNFIL3 knock-down cells were injected into the spleens of NOD/SCID mice: primary tumours in the spleens and metastases in the livers were examined. (B) Numbers of mice injected and numbers of visible metastatic nodules. (C) The relative weight of spleens (spleen/body weight) and livers (liver/body weight) from the experiments in (A) was quantified. (D) RT-qPCR examination of relative expression levels of human E-cadherin, N-cadherin and fibronectin in tumour tissues of spleens and livers. (E) RT-qPCR examination of relative expression of human BOP1, CKS2 and NFIL3 in tumour tissues of spleens and livers; the respective expression in tumour tissues generated by control cells was normalised to 1.0. EMT, epithelial–mesenchymal transition; RT-qPCR, real-time quantitative PCR.
BOP1, CKS2 and NFIL3 promote cell migration and EMT through different signalling systems
To study the mechanisms by which BOP1, CKS2 and NFIL3 may regulate cell migration and EMT, we treated the transduced SW480 cells with specific small-molecule inhibitors to block various signalling systems that regulate cell migration,17 and examined cell motility in transwell assays. We employed 12 µm nucleopore filters, which allow higher basic cell migration. Inhibitors were used at concentrations that had no significant effects on cell proliferation, as shown for the example LY294002 (used at 3.3 µm in transwell assays) (see online supplementary figure S6A–C). Remarkably, the compounds did affect cell migration in distinct and intricate ways. We could categorise the effects of the different inhibitors into five groups (figure 6A–D, summarised in figure 6F). (a) The myosin light chain kinase (MLCK) inhibitor ML7, the Rac inhibitor NSC23766, the focal adhesion kinase (FAK) inhibitor TAE226, and the inhibitor PP2 against Src and FAK all blocked cell migration of both control and stable cells that overexpressed BOP1, CKS2 and NFIL3 (figure 6A). This means that these signalling systems are essential for basic cell migration that is not under control of the new Wnt target genes (figure 6F, upper part). (b) The phosphoinositide 3-kinase (PI3K) inhibitor LY294002 specifically repressed cell migration of all three stable cell lines, but not of control cells (figure 6B, F; lower part). (c) The JNK and Notch pathway inhibitors SP600125 and DAPT repressed specifically cell migration of BOP1 cells (figure 6C, F; lower part). (d) The p38 MAPK inhibitor SB203580 suppressed cell migration of both CKS2 and NFIL3 cells, while (e) the mTOR inhibitor rapamycin specifically blocked NFIL3-induced cell migration (figure 6D, F; lower part). Y27632 treatment that inhibits ROCK, the key effector of the small GTPase RhoA,38 did not significantly affect cell migration (see online supplementary figure S6D).
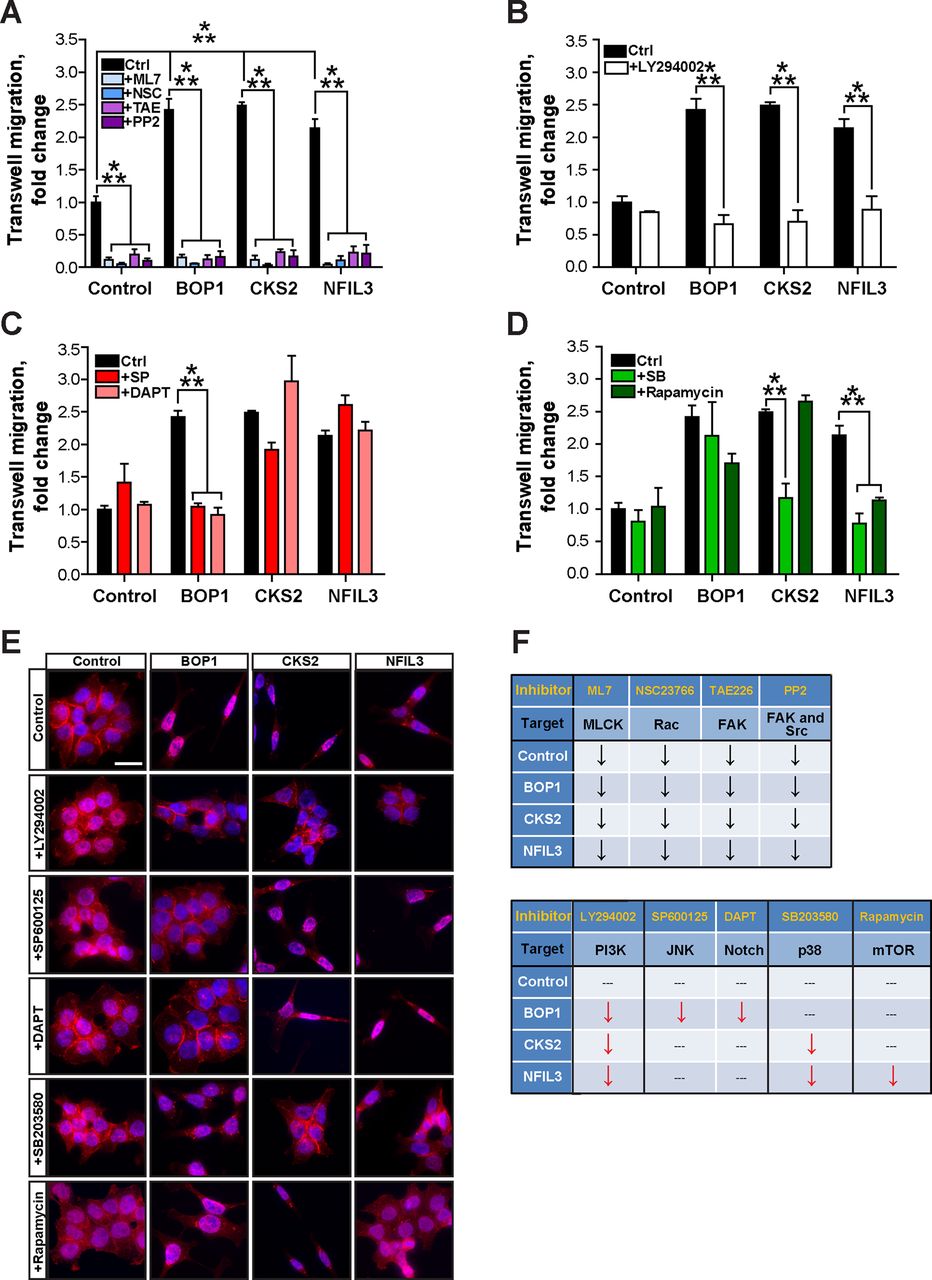
Distinct pathway inhibitors decrease cell migration and reverse epithelial–mesenchymal transition phenotypes of stable SW480 cells that overexpress BOP1, CKS2 or NFIL3. (A) Stable SW480-BOP1, SW480-CKS2 and SW480-NFIL3 cells exhibit enhanced cell migration induced by serum. The inhibitors ML7 (10 µM), NSC23766 (100 µM), TAE226 (5 µM), and PP2 (10 µM) decreased basic migration of both SW480 control cells and BOP1/CKS2/NFIL3 cells. (B) The inhibitor LY294002 (3.3 μM) decreased the migration of BOP1, CKS2 and NFIL3 cells to control levels. (C) BOP1 cells exhibited decreased migration in response to the inhibitors SP600125 (33.3 nM) and DAPT (667 nM), while CKS2 and NFIL3 cells were not affected. (D) CKS2 and NFIL3 cells displayed decreased migration in response to the inhibitor SB203580 (3.3 μM), while BOP1 cells were unaffected. The inhibitor rapamycin (33.3 nM) decreased the migration of NFIL3 cells, but not BOP1 or CKS2 cells. (A–D) ***p<0.005. (E) Stable SW480 cells were treated with inhibitors and stained by immunofluorescence with anti-E-cadherin antibody (red); DAPI (blue) was used for staining nuclear DNA. Scale bar, 50 μm. (F) Summary of the distinct effects of inhibitors on cell migration in stable SW480 cells. Arrows ↓ in black, inhibition of basic cell migration; arrows ↓ in red, inhibition of induced cell migration; ---, not effective.
We also examined the effects of the specific inhibitors on EMT by immunofluorescence and western blotting with anti-E-cadherin antibody. Consistent with the transwell results, the PI3K inhibitor LY294002 could block EMT and increase E-cadherin expression in all three BOP1, CKS2 and NFIL3 cells (figure 6E; second row, see online supplementary figure S6E, F); the JNK and Notch inhibitors SP600125 and DAPT were only effective in BOP1 cells (figure 6E; third and fourth rows, see online supplementary figure S6E, F); the p38 inhibitor SB203580 prevented EMT in both CKS2 and NFIL3 cells (figure 6E; second last row, see online supplementary figure S6E,F), and the mTOR inhibitor rapamycin blocked EMT only in NFIL3 cells (figure 6E; last row, see online supplementary figure S6E,F). These results were confirmed by RT-qPCR for four different EMT markers (see online supplementary figure S6G).
We also performed Illumina BeadChip profiling (GSE50841) in the stable SW480 cells, which identified respective downstream genes and dominant pathways that may regulate cell migration: the JNK pathway for BOP1 cells, the PI3K pathway for CKS2 cells and the p38 and mTOR pathways for NFIL3 cells (see online supplementary results and figure S7A–J).
To confirm the interactions between BOP1, CKS2, NFIL3 and the selected signalling systems identified by gene profiling, we examined downstream effectors of signalling, for example, the levels of phosphorylated JNK, Akt, p38 and mTOR in stable SW480 cells. Thr183/Tyr185-phosphorylated JNK was strongly upregulated, specifically in BOP1 SW480 cells, while total JNK was unchanged (figure 7A; first panel, see online supplementary figure S7K). In accordance, the inhibitor SP600125 abolished phosphorylation of JNK in BOP1 cells, similar to shBOP1 in SW620 cells (figure 7B and see online supplementary figure S7L). The PI3K downstream effector Akt, that is, Ser473-phosphorylated Akt, was elevated in all the three BOP1, CKS2 and NFIL3 cells (figure 7A; second panel, see online supplementary figure S7K), consistent with the inhibitory effects of the PI3K inhibitor on cell migration and EMT. In CKS2 cells, the inhibitor LY294002 blocked phosphorylation of Akt, while knocking down CKS2 inhibited Akt phosphorylation in SW620 cells (figure 7C, see online supplementary figure S7M). Activated Thr180/Tyr182-phosphorylated p38 was high in both CKS2 and NFIL3 cells (figure 7A; third panel, see online supplementary figure S7K), reminiscent of the inhibitory effects of SB203580 in these two cell types. The p38 inhibitor SB203580 blocked phosphorylation of p38 in NFIL3 cells; however, only little change was observed in shNFIL3 SW620 cells (figure 7D, see online supplementary figure S7N). Knocking down NFIL3 had significant effects on Ser2448-phosphorylated mTOR (figure 7E, Supplementary figure S7O), which is also enhanced in both CKS2 and NFIL3 SW480 stable cells (figure 7A; fourth panel, see online supplementary figure S7K). We also examined the activation status of these pathways in LS174T stable cell lines. As in SW480 stable cells, overexpression of BOP1, CKS2 and NFIL3 upregulated p-JNK, p-Akt, p-38 and p-mTOR, which were sensitive to specific inhibitors, respectively (see online supplementary figure S7P–V). Taken together, the newly identified Wnt target genes BOP1, CKS2 or NFIL3 crosstalk with distinct signalling systems to activate subsets of specific cell migration-associated genes that enhance cell motility in CRC cells (summarised in the scheme of figure 7F).

Different signalling systems act downstream of BOP1, CKS2 and NFIL3. (A) Western blotting analysis of phosphorylated and total JNK, Akt, p38 and mTOR in SW480 cells. (B) Western blotting analysis of phosphorylated and total JNK in SW480-BOP1 cells treated with SP600125 and SW620-shBOP1 cells. (C) Western blotting analysis of phosphorylated and total Akt in SW480-CKS2 cells treated with LY294002 and SW620-shCKS2 cells. (D) Western blotting analysis of phosphorylated and total p38 in SW480-NFIL3 cells treated with SB203580 and SW620-shNFIL3 cells. (E) Western blotting analysis of phosphorylated and total mTOR in SW480-NFIL3 cells treated with rapamycin and SW620-shNFIL3 cells. (A–E) Tubulin was used as loading control. (F) Schematic representation of Wnt/β-catenin target genes BOP1, CKS2 and NFIL3 that regulate cell migration genes through distinct signalling systems, leading to enhanced cell motility and metastasis.
Discussion
Comprehensive data recently reported by the Cancer Genome Atlas Network have confirmed findings from more than three decades of cancer research: the most frequent alterations in human CRC progression include activation of Wnt/β-catenin, PI3K, MAPK and mTOR signalling as well as inhibition of TGFβ and TP53 signalling.2 ,10 ,19 Previously, our lab has shown that the Wnt/β-catenin target gene BAMBI, which was selected from a signature of 115 genes implicated in human CRC metastasis, induces cell migration and experimental metastasis by inhibiting TGFβ signalling.5 Here, we have identified three further direct Wnt/β-catenin target genes from the metastasis gene signature, BOP1, CKS2 and NFIL3, and have shown that these genes also generate experimental metastasis in non-metastatic CRC cells. Moreover, expression of each gene in CRC cells induces EMT and enhances cell migration and invasion in tissue culture by activating distinct signalling systems like JNK, PI3K, mTOR and p38 MAPK. Knocking down each of the three genes in highly metastatic CRC cells reduces cell motility and EMT, and inhibits experimental metastasis. Overall, our data, thus, show that the Wnt target genes BAMBI, BOP1, CKS2 and NFIL3 can cooperate with well-established, but distinct, signalling systems in CRC cells to regulate cell migration and EMT, and to promote experimental metastasis.
The direct Wnt/β-catenin target genes induce EMT, cell migration and experimental metastasis
Here, we focused on potential Wnt/β-catenin target genes from our CRC metastasis signature in the search of new drivers of metastasis because aberrant canonical Wnt signalling is fundamental in colon cancer progression, and also contributes to metastasis formation.1 ,2 Several genes previously identified as Wnt transcriptional targets, including S100A4, p16INK4a and BAMBI, can promote metastasis.4 ,5 ,39 ,40 Moreover, hyperactivation of the Wnt pathway is essential in metastasis of tumours that already harbour APC mutations,19 suggesting the importance of strong activation of Wnt signalling in CRC progression. Promoter analysis and ChIP revealed that BOP1, CKS2 and NFIL3 are indeed direct Wnt/β-catenin target genes.
We found that transplantation of individual LS174T and SW480 cell clones that overexpressed BOP1, CKS2 or NFIL3 into mouse spleens led to extensive formation of experimental metastases in the livers. Moreover, knocking down BOP1, CKS2 or NFIL3 individually in the highly metastatic SW620 cells reduced experimental metastasis. In accordance, SW620 cells exhibited high endogenous expression of the three genes BOP1, CKS2 or NFIL3, compared with LS174T and SW480 cells. So, it was surprising that overexpression of each of the three exogenous genes in non-metastatic cells was enough to strongly induce experimental metastasis, while knocking down each one of the endogenous genes in SW620 cells reduced metastasis. Possibly, the high levels of BOP1, CKS2 or NFIL3 driven by the powerful exogenous promoters in LS174T and SW480 cells, which are even higher than in SW620 cells, may have created exceptionally high biological activities of the three genes, so that each one was enough to promote metastasis. It was also noticeable that knocking down the individual genes in SW620 cells reduced metastasis, but did not fully block it. Potential additive effects of the three genes should be further examined.
EMT is a crucial process in the dissemination of primary tumour cells, and we have here taken great efforts to show that the three genes indeed induce EMT. The epithelial cell adhesion molecule E-cadherin is an important controller of EMT.2 ,10 ,41 Thus, overexpression of BOP1, CKS2 and NFIL3 induced fibroblast-like cell morphologies in SW480 cells, and reduced protein levels of E-cadherin. E-cadherin was also reduced in metastatic SW620 cells, and knocking down BOP1, CKS2 or NFIL3 enhanced the levels of E-cadherin. In contrast, the mesenchymal adhesion and cytoskeletal proteins—N-cadherin, fibronectin and vimentin—as well as transcription factors like Snail1/2 were enhanced in the transduced SW480 cells. These findings clearly demonstrate that CRC cells expressing BOP1, CKS2 or NFIL3 produce morphologies and cell biological characteristics of EMT. We also compared the expression of the EMT genes in spleen primary tumours and liver metastases in both SW480 and SW620 settings. Spleen primary tumours exhibited similar expression of EMT markers, as in the cell lines; however, SW480 cells transduced with BOP1, CKS2 and NFIL3 in liver metastases showed higher E-cadherin and lower expression of mesenchymal genes (see online supplementary discussion), consistent with the necessity of generation of epithelial properties for the outgrowth of metastasis.12 ,14
BOP1, CKS2 and NFIL3 control different signalling networks in cell migration
Basic migration of SW480 cells were regulated by MLCK, Rac, FAK and Src kinases. In contrast, Wnt-induced cell migration of SW480 cells and activation of new target genes were found to be under control of JNK, PI3K, p38 MAPK and/or mTOR signals, which regulate different sets of migration-related components (schemes in figures 6F and 7F). The functions of respective downstream ‘cell migration genes’ are summarised in the online supplementary discussion.
We also showed that BOP1, CKS2 and NFIL3 activate the phosphorylation of JNK, Akt, p38 and mTOR. Large-scale assays such as SILAC-based quantitative proteomic analysis or yeast two-hybrid screening can be performed to identify potential interacting proteins of BOP1, CKS2 and NFIL3 in both non-metastatic SW480/LS174T and metastatic SW620 cells. The inhibitors used in the present study may also be examined in experimental metastasis assays and in genetic mouse models with spontaneous metastasis.
Acknowledgments
The authors thank Russ Hodge of the Max-Delbrück-Center for Molecular Medicine for helpful discussion and writing assistance.
References
Supplementary materials
Supplementary Data
This web only file has been produced by the BMJ Publishing Group from an electronic file supplied by the author(s) and has not been edited for content.
- Data supplement 1 - Online supplement
- Data supplement 2 - Online figures
- Data supplement 3 - Online tables
Footnotes
Contributors JQ: design of experiments, acquisition of data, analysis of data, drafting of the manuscript; YY and ÖAÖ: acquisition of data, analysis of data; JDH: critical revision of the manuscript; DB and JF: technical and material support; KE, AW-G and IF: experiments on mice; WB: study concept and design, study supervision, analysis of data, obtained funding, critical revision of the manuscript.
Funding Supported by the Deutsche Krebshilfe (FKZ 106956).
Competing interests None declared.
Provenance and peer review Not commissioned; externally peer reviewed.
Data sharing statement Microarray data have been deposited into the Gene Expression Omnibus (Accession number GSE50841).