Article Text

Abstract
Objective: MicroRNAs (miRNAs) have been shown to offer great potential in the diagnosis of cancer. We investigated whether plasma miRNAs could discriminate between patients with and without colorectal cancer (CRC).
Methods: This study was divided into three phases: (1) marker discovery using real-time PCR-based miRNA profiling on plasma, corresponding cancerous and adjacent non-cancerous colonic tissues of five patients with CRC, along with plasma from five healthy individuals as controls; (2) marker selection and validation by real-time quantitative RT-PCR on a small set of plasma; and (3) independent validation on a large set of plasma from 90 patients with CRC, 20 patients with gastric cancer, 20 patients with inflammatory bowel disease (IBD) and 50 healthy controls.
Results: Of the panel of 95 miRNAs analysed, five were upregulated both in plasma and tissue samples. All the five miRNAs were validated on the plasma of 25 patients with CRC and 20 healthy controls. Both miR-17-3p and miR-92 were significantly elevated in the patients with CRC (p<0.0005). The plasma levels of these markers were significantly reduced after surgery in 10 patients with CRC (p<0.05). Further validation with an independent set of plasma samples (n = 180) indicated that miR-92 differentiates CRC from gastric cancer, IBD and normal subjects. This marker yielded a receiver operating characteristic curve area of 88.5%. At a cut-off of 240 (relative expression in comparison to RNU6B snRNA), the sensitivity was 89% and the specificity was 70% in discriminating CRC from control subjects.
Conclusion: MiR-92 is significantly elevated in plasma of patients with CRC and can be a potential non-invasive molecular marker for CRC screening.
Statistics from Altmetric.com
Colorectal cancer (CRC) is the third most common cancer worldwide with an estimated one million new cases and a half million deaths each year.1 Screening for CRC allows early-stage diagnosis of the malignancy and potentially reduces mortality of the disease.2 Although colonoscopic screening for CRC is currently the most reliable screening tool, the invasive nature and the cost incurred have hampered the wide application of this procedure. On the other hand, the faecal occult blood test (FOBT) has the limitation of low sensitivity and requires meticulous dietary restriction.3 Thus, there is a pressing need for new non-invasive biomarkers to improve the detection of CRC.
Recently, the discovery of small (19–26 nucleotides) non-protein-coding RNAs, so-called microRNAs (miRNAs) that play important roles in oncogenesis, has opened new opportunities of a non-invasive test for the early diagnosis of cancer.4 5 6 Studies have shown that profiles of miRNA expression differ between normal tissue and tumour tissues and vary among tumour types.5 7 Evidence suggests that miRNA expression profiles can cluster similar tumour types together more accurately than the expression profiles of protein-coding mRNA genes.7 Furthermore, miRNA expression signatures have been used to predict prognosis.8 9 10 Since 1999, tumour-associated RNAs have been detected in the serum or plasma from patients suffering from breast, colon and nasopharyngeal cancers.11 12 13 14 15 More recently, several reports also suggest that cell-free circulating miRNAs existed in serum and plasma.16 17 18 19 Accordingly, it raises the possibility of using miRNAs as novel non-invasive molecular markers for cancer detection. In the present study, we evaluated the feasibility of using plasma miRNAs as a non-invasive diagnostic test for CRC.
Patients and methods
Study design and patient samples
This study was divided into three phases: phase I, marker discovery; phase II, marker selection and validation; and phase III, large-scale validation.
Phase I: marker discovery
In this phase, pre-operative plasma, primary cancerous biopsies and their adjacent non-cancerous colonic tissues from five patients with CRC were collected. Plasma from five age-matched healthy subjects was collected as the control. MicoRNA profiles were generated from the following samples: (1) CRC plasma, (2) normal plasma, (3) CRC tissues, and (4) adjacent normal tissues. By comparing miRNA profiles from CRC plasma versus normal plasma and CRC tissues versus adjacent normal tissues, two differential miRNA expression patterns were established and then compared. Upregulated miRNAs in both plasma and tissues were identified for further analysis in phase II.
Phase II: marker selection and validation
Plasma samples were collected from 25 patients with CRC before undergoing endoscopy. Plasma from 20 healthy subjects was collected as normal control. Putative miRNA markers identified in phase I were verified on these plasma samples from 25 patients with CRC and 20 controls. Plasma from another 10 patients with CRC was collected before and 7 days after surgical resection. Markers proceeding to phase III validation had to be significantly elevated in the 25 patients with CRC and reduced after tumour resection.
Phase III: large-scale validation
Plasma was collected from an independent group of 90 patients with CRC before endoscopy. Plasma from a set of 50 healthy subjects was collected as the control. Putative markers identified from phase II were verified on these independent sets of plasma samples. Plasma from 20 patients with inflammatory bowel disease (IBD) and 20 patients with gastric cancer (GC) was also included to examine the specificity of the makers.
Informed consent was obtained from participants for the use of their blood and tissue samples in this study. All patients were considered sporadic cases on the basis that no family histories of CRC were reported. Tumours were staged according to the tumour–node–metastsis (TNM) staging system.20 No patient received chemotherapy or radiotherapy before blood sampling.
Samples processing and microRNA extraction
Total RNA was extracted from tissues using miRNeasy Mini Kit (Qiagen, Hilden, Germany) following the manufacturer’s instructions. EDTA blood was centrifuged at 1600 g for 10 min at 4°C, and plasma was transferred to new tubes followed by further centrifugation at 16 000 g for 10 min at 4°C. Total RNA containing small RNA was extracted from 500 μl of plasma using Trizol LS reagent (Invitrogen, Carlsbad, California, USA) and miRNeasy Mini Kit (Qiagen, Hilden, Germany) according to the manufacturer’s protocol with the following modifications: Trizol LS reagent was added to plasma samples in volumetric ratios as previously described.14 21 After phase separation by chloroform addition and centrifugation, 1.5 volumes of 100% ethanol was added to the aqueous phase and the mixture was loaded into miRNeasy column (Qiagen) according to the manufacturer’s instructions. DNase treatment (Qiagen) was carried out to remove any contaminating DNA. The final elution volume was 30 μl. The concentrations of all RNA samples were quantified by NanoDrop 1000 (Nanodrop, Wilmington, Delaware, USA). The concentration of RNA extracted from plasma ranged from 4.8 to 23.9 ng/μl.
MicroRNA profiling of plasma and biopsy tissues
Plasma and biopsies from five patients with CRC (three male, two female; age, 65 (SD 9.0) years) and plasma from five sex- and age-matched healthy subjects (age, 62 (SD 6.4) years) were used for miRNA profiling.
Profiling was performed using Cancer MicroRNA Array with QuantiMir system (System Biosciences, Mountain View, California, USA) which is a real-time PCR-based array containing a panel of 95 cancer-related miRNA assays and the U6 transcript as a normalisation signal. Briefly, 100 ng of total RNA extracted from plasma and tissue samples was polyadenylated by poly(A) polymerase and then reverse transcribed to cDNA. Real-time qPCR was performed using Power SYBR Master Mix (Applied Biosystems, Foster City, California, USA) using miRNA-specific primers provided by the manufacturer in ABI PRISM 7500 Real-time PCR system (Applied Biosystems). The cycle threshold (Ct) is defined as the number of cycles required for the fluorescent signal to cross the threshold in qPCR. ΔCt was calculated by subtracting the Ct values of U6 from the Ct values of the miRNA of interest. ΔΔCt was then calculated by subtracting ΔCt of the control from ΔCt of disease. Fold change of gene was calculated by the equation 2−ΔΔCt. Most of the miRNAs chosen for the array have been characterised with regard to potential roles in cancer, cell development, and apoptosis. The details describing the platform and selection of miRNAs can be obtained from http://www.systembio.com (accessed 22 April 2009).
MicroRNA quantification by real-time quantitative RT-PCR
SYBR green qRT-PCR assay was used for miRNA quantification in plasma samples. In brief, 40 ng of plasma RNA containing miRNA was polyadenylated by poly(A) polymerase and reverse transcribed to cDNA using miScript Reverse Transcription kit (Qiagen) according to the manufacturer’s instructions. Real-time qPCR was performed using miScript SYBR Green PCR kit (Qiagen) with the manufacturer provided miScript Universal primer and the miRNA-specific forward primers in ABI PRISM 7900 Real-time PCR system (Applied Biosystems). The miRNA-specific primer sequences were
5′-ACGCAAATTCGTGAAGCGTT-3′ for RNU6B
5′-TAGCAGCACGTAAATATTGGCG-3′ for miR-16
5′-TATGGCTTTTCATTCCTATGTG-3′ for miR-135b
5′-ACTGCAGTGAAGGCACTTGT-3′ for miR-17-3p
5′-AGCTACATCTGGCTACTGGGTC-3′ for miR-222
5′-TATTGCACTTGTCCCGGCCTG-3′ for miR-92
5′-TTCAACGGGTATTTATTGAGCA-3′ for miR-95
Sequences were designed based on the miRNA sequences obtained from the miRBase database (http://microrna.sanger.ac.uk/; accessed 22 April 2009). Each reaction was performed in a final volume of 10 μl containing 2 μl of the cDNA, 0.5 mmol/l of each primer and 1× SYBR Green PCR Master mix (Qiagen). The amplification profile was: denaturation at 95°C for 15 min, followed by 40 cycles of 94°C for 15 s, 55°C for 30 s and 70°C for 30 s, in which fluorescence was acquired. At the end of the PCR cycles, melting curve analyses were performed as well as electrophoresis of the products on 3.5% agarose gels in order to validate the specific generation of the expected PCR product. Each sample was run in duplicates for analysis. The expression levels of miRNAs were normalised to RNU6B.
Statistical analysis
The significance of plasma miRNA levels was determined by the Mann–Whitney test, Wilcoxon test, the χ2 test or Kruskal–Wallis test where appropriate. The Spearman rank order correlation test was used to examine correlation relationships between the levels of the miRNA markers. The sensitivity and specificity were calculated according to the standard formulas. Multivariate logistic regression model was established and leave-one-out cross-validation to find the best logistic model. Receiver operating characteristic (ROC) curves were established for discriminating patients with or without CRC. All p values are two-sided and less than 0.05 was considered statistically significant. All statistical calculations were performed by the SPSS software (version 13.0).
Results
Patient characteristics
Patient characteristics and distribution of tumour stages are summarised in table 1. A total of 245 participants including 130 patients with CRC, 75 healthy subjects, 20 patients with IBD and 20 patients with GC were recruited. There were no significant differences of age between patients with CRC (71 (SD 7.5) years), healthy controls (69 (SD 6.4) years), those with IBD (71 (SD 7.7) years) and those with GC (68 (SD 6.7) years) (p = 0.76, ANOVA). The sex distribution in the CRC group was 68:62 (male:female) and in the control group was 39:36 (p = 0.86, χ2 test).
Patient characteristics for plasma miRNA analysis
Identification of CRC-associated miRNAs in both plasma and colorectal cancer tissue
In this marker discovery phase, a strategy for effective identification of CRC-associated miRNAs in plasma was developed. First, real-time PCR-based miRNA expression profiling arrays were performed to identify differential expression patterns of miRNAs in plasma between five patients with CRC and five age-matched healthy normal controls. To rule out plasma miRNAs predominantly derived from sources other than CRC cells, differential expression patterns between cancerous and adjacent non-cancerous tissues from the same five patients with CRC were obtained by analysing their miRNA expression profiles (supplementary table 1A,B). The differential expression patterns between plasma and biopsy tissue samples were then compared. Using 2-fold expression difference as a cut-off level, five upregulated miRNAs (miR-17-3p, miR-135b, miR-222, miR-92 and miR-95) in both plasma and colorectal cancer tissues in the patients with CRC were identified (table 2).
The list of upregulated miRNAs (change >2-fold as a cut-off level) in plasma and biopsy samples of colorectal cancer (CRC) compared to healthy controls, identified using real-time polymerase chain reaction-based miRNA profiling arrays
Marker selection and validation on a small set of plasma samples
To validate the five putative markers identified from the marker discovery phase, qPCR assays were developed to quantify miRNAs in plasma. In this qPCR, relative quantification was applied and thus appropriate internal normalisation control was required to normalise sample-to-sample variations. As no consensus on the use of internal normalisation control in plasma was defined for miRNA qPCR, expressions of U6 small nuclear RNA (RNU6B) and miR-16 in plasma were evaluated. Both have been proposed as the internal normalisation control for microRNA quantification. Our data demonstrated that both RNU6B and miR-16 were readily detectable in the plasma of all controls and of patients with CRC. No significant difference was observed in terms of Ct values of RNU6B (p = 0.47, Mann–Whitney test) and miR-16 (p = 0.11, Mann–Whitney test) between control and CRC samples (supplementary fig 1). Although RNU6B shows less abundance than miR-16 in the plasma, RNU6B was selected as the normalisation control as it displayed expression levels of higher stability and less variability.

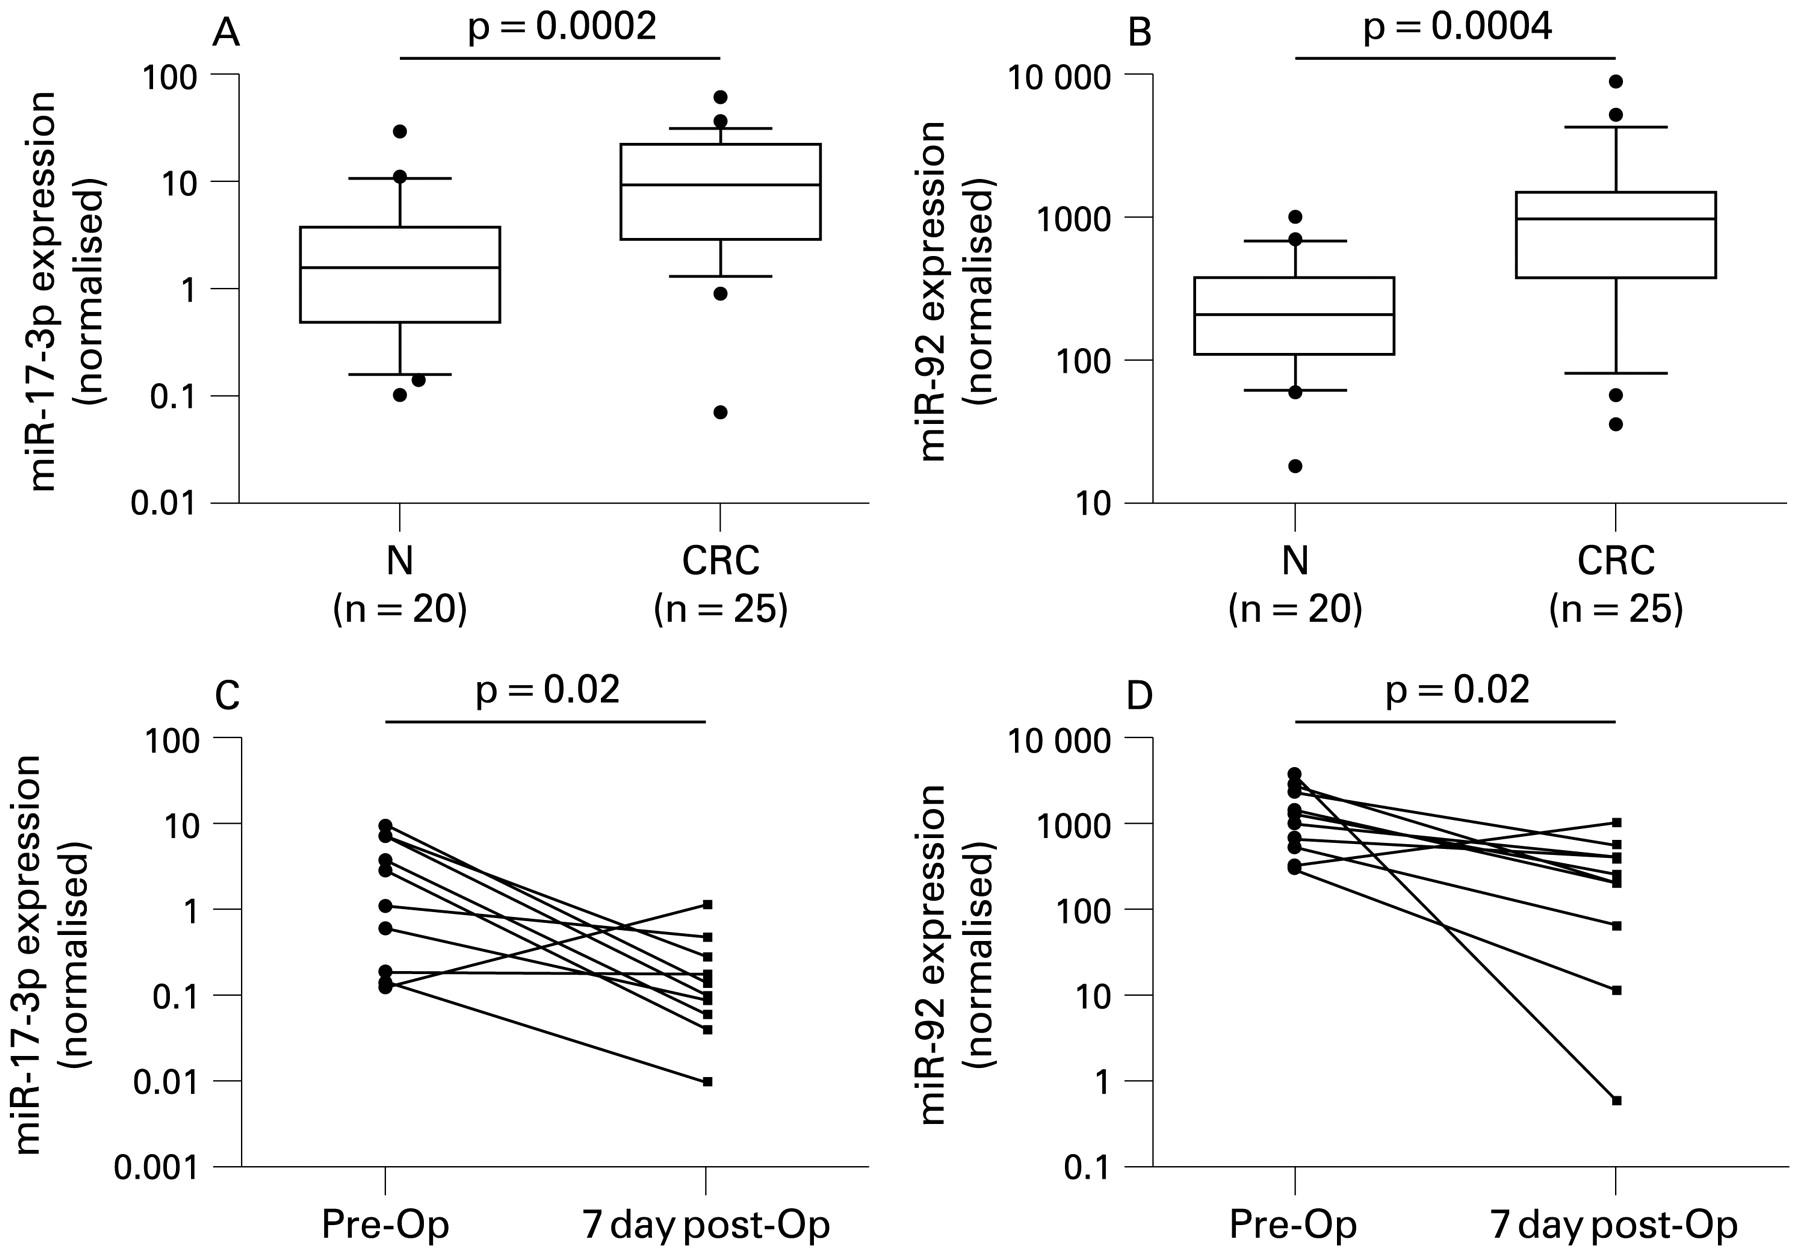
MicroRNA selection and validation (Phase II) by quantitative reverse transcription polymerase chain reaction (RT-PCR) analysis. Box plots of plasma levels of (A) miR-17-3p and (B) miR-92 in healthy normal (N) subjects (n = 20) and patients with colorectal cancer (CRC) (n = 25). Expression levels of the miRNAs (log10 scale at y-axis) are normalised to RNU6B. The lines inside the boxes denote the medians. The boxes mark the interval between the 25th and 75th percentiles. The whiskers denote the interval between the 10th and 90th percentiles. Filled circles indicate data points outside the 10th and 90th percentiles. Statistically significant differences were determined using Mann–Whitney tests. Changes of plasma levels of (C) miR-17-3p and (D) miR-92 in patients with CRC (n = 10) before (pre-Op) and 7 days after (7 day post-Op) surgical removal of the tumour. Expression levels of the miRNAs (log10 scale on the y-axis) are normalised to RNU6B. Statistically significant differences were determined using Wilcoxon tests.
Using RNU6B as normalisation control, expression levels of the five upregulated miRNAs were validated by qPCR on the 45 plasma samples (25 patients with CRC and 20 controls). Our data indicated that detection rates of miR-135b, miR-222 and miR-95 were <50% in both control and CRC plasma samples and no significant difference was observed in their levels between patients with CRC and controls (p = 0.29 for miR-135b, p = 0.18 for miR-222, p = 0.53 for miR-95, Mann–Whitney test). Thus, these three miRNAs were not chosen in further studies. The remaining two miRNAs, miR-17-3p and miR-92, were detectable in all 45 samples and significantly elevated in CRC plasma when compared to controls (p<0.0005, Mann–Whitney test; fig 1A,B).
To verify whether miR-17-3p and miR-92 are associated with CRC, their plasma levels were measured in an independent set of 10 patients with CRC before and 7 days after surgical removal of the tumours. It was found that the levels of both miR-17-3p and miR-92 were significantly reduced in the post-operative samples when compared to the pre-operative samples (p<0.05, Wilcoxon test; fig 1C,D).
Independent large-scale validation on plasma samples
To further verify the discriminating power of the two miRNA markers identified in phase II (marker selection and validation), miR-17-3p and miR-92 were assessed on an independent group of 140 plasma samples including 90 patients with CRC and 50 healthy controls (supplementary table 2A,B). Both miR-17-3p and miR-92 were significantly elevated in plasma of patients with CRC than those in controls (p<0.0001, Mann–Whitney test; fig 2A,B). ROC curve analyses revealed that the plasma levels of both miR-17-3p and miR-92 were useful biomarkers for differentiating patients with CRC from controls with ROC curve areas of 0.717 (95% confidence interval (CI), 0.63 to 0.80) and 0.885 (95% CI, 0.83 to 0.94), respectively (fig 2C,D). At the cut-off value of 3.6 for miR-17-3p (relative expression in comparison to RNU6B snRNA), the sensitivity was 64% and the specificity was 70%. At the cut-off value of 240 for miR-92 (relative expression in comparison to RNU6B snRNA), the sensitivity was 89% and the specificity was 70%. Multivariate logistic regression analysis showed that miR-92 was a potential biomarker (p<0.0005) for CRC detection, but addition of miR-17-3p could not improve the differentiation between patients with CRC and controls, indicating the overlapping of the diagnostic values of miR-92 and miR-17-3p. Spearman rank correlation showed that plasma levels of miR-92 and miR-17-3p were positively correlated (R2 = 0.63, p<0.0001; fig 3A). This further supported the overlapping of the diagnostic values of miR-92 and miR-17-3p. The odds ratio for cases with miR-92>240 being associated with cancer was 18.7 (95% CI, 7.6 to 45.6).
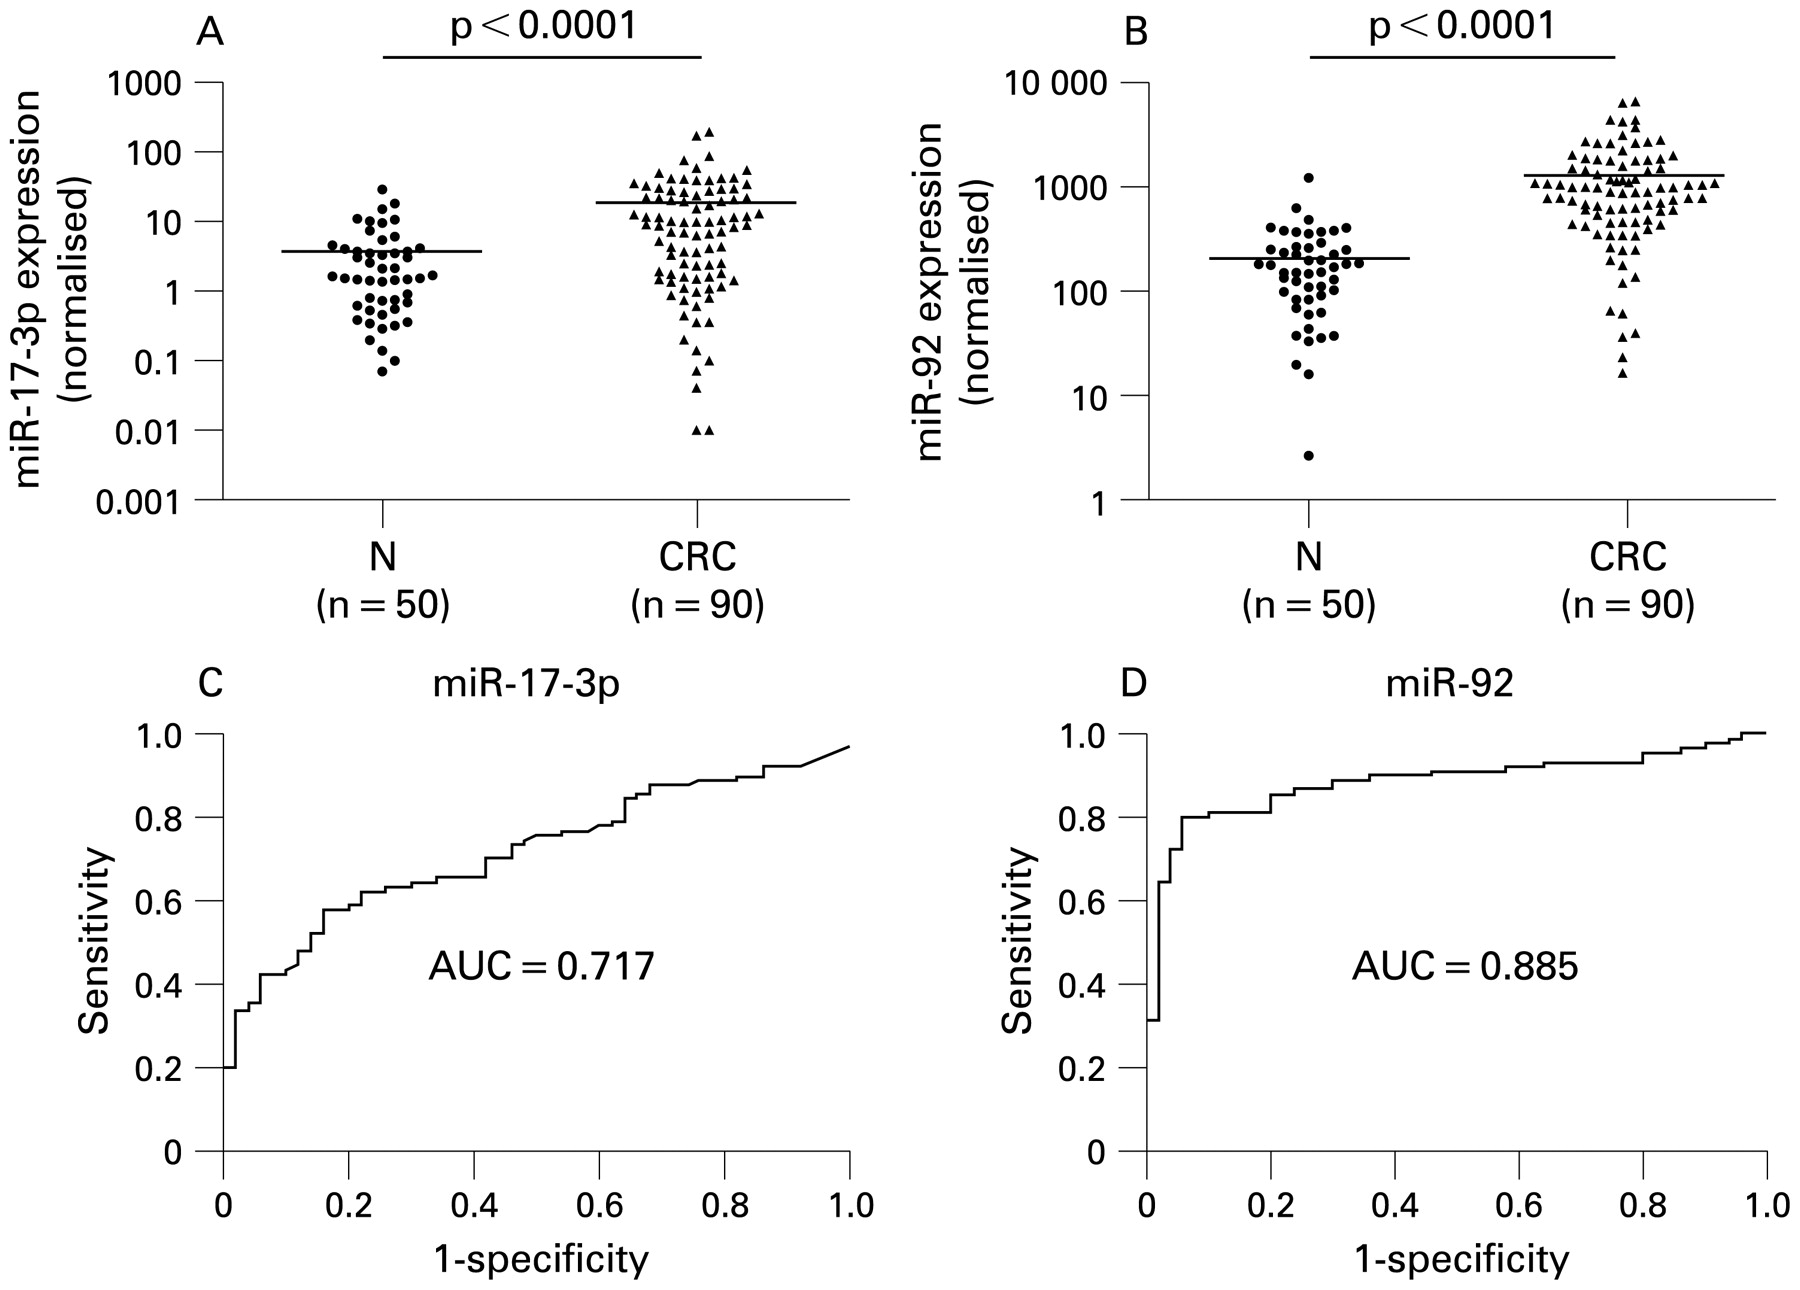
Validation (Phase III) of miR-92 and miR-17-3p on an independent group of plasma samples (n = 140). Scatter plots of plasma levels of (A) miR-92 and (B) miR-17-3p in healthy normal (N) subjects (n = 50) and patients with colorectal cancer (CRC) (n = 90). Expression levels of the miRNAs (log10 scale on the y-axis) are normalised to RNU6B. The line represents the mean value. Statistically significant differences were determined using Mann–Whitney tests. Receiver operating characteristics (ROC) curve analysis using (C) plasma miR-17-3p and (D) plasma miR-92 for discriminating CRC. Plasma miR-17-3p yielded a ROC curve value of 71.7% (95% confidence interval (CI), 0.633 to 0.800), sensitivity of 64%, and specificity of 70% in discriminating CRC. Plasma miR-92 yielded a ROC curve value of 88.5% (95% CI, 0.828 to 0.942), sensitivity of 89%, and specificity of 70% in discriminating CRC.

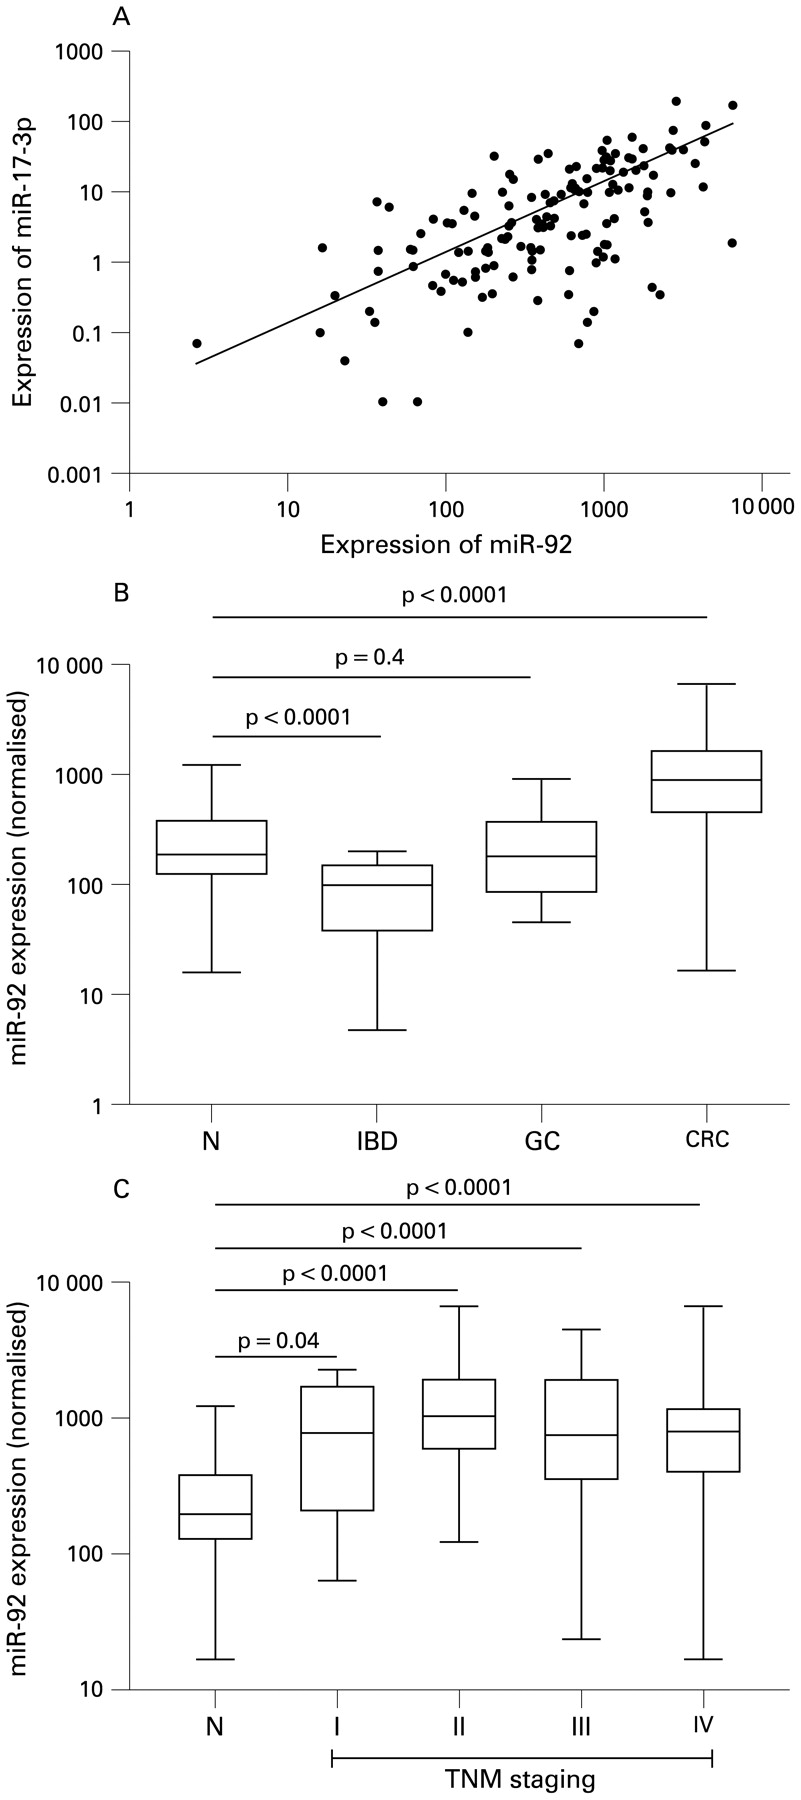
(A) Scatter plot of expression level correlation between miR-92 and miR17-3p from the 140 plasma samples including 90 patients with colorectal cancer (CRC) and 50 healthy controls. Positive correlation was obtained by Spearman correlation, R2 = 0.625, p<0.0001. (B) Box plot of plasma miR-92 level in healthy normal (N) subjects (n = 50), patients with CRC (n = 90), patients with inflammatory bowel disease (IBD) (n = 20) and patients with gastric cancer (GC) (n = 20). (C) Box plot of plasma miR-92 level across stage. The box represents the interquartile range and the line across the box indicates the median value. Expression levels of the miRNAs (log10 scale on the y-axis) are normalised to RNU6B. Statistically significant differences were determined using Mann–Whitney tests.
To rule out that elevation of plasma miR-92 level was simply due to bowel inflammation or other gastrointestinal cancer, plasma from 20 patients with IBD and 20 with GC was included. Our results indicated that plasma miR-92 level in both patients with IBD and those with GC is not significantly higher than that in healthy controls (fig 3B). In fact, plasma miR-92 level in IBD cases is significantly lower than in healthy controls. To examine whether the plasma miR-92 level may be associated with stages of the disease, patients were stratified by TNM staging. Of the 90 patients with CRC, miR-92 levels did not vary significantly across the staging (p = 0.45, Kruskal–Wallis test; fig 3C). However, significant differences were obtained when individual tumour stage was compared with the controls, (stage I, p<0.05; stage II, p<0.0001; stage III, p<0.0001; stage IV, p<0.0001, Mann–Whitney test).
Discussion
This is the first report on the quantitative assessment of plasma miRNAs in patients with CRC. We identified significantly elevated levels of miR-92 and miR-17-3p in the plasma of such patients. Plasma miR-92 alone demonstrated as the best markers for CRC prediction and yielded a ROC curve area of 88.5%. At a cut-off of 240, the sensitivity was 89% and the specificity was 70% in discriminating CRC from control subjects. This makes miR-92 a better marker than miR-17-3p as the latter has a lower sensitivity. The odds ratio for the cases with miR-92 level >240 being associated with CRC was 18.7, which was much higher than the odds ratio (7.6; 95% CI, 1.8 to 31.4) recently reported for a positive first guaiac faecal occult blood test (FOBT).22 Thus, this finding compares favourably with one of the best results using other non-invasive biomarkers such as FOBT for the diagnosis of CRC.
In this study, we have also developed a systematic approach to identify CRC-associated miRNAs in plasma by comparing differential expression pattern between plasma and biopsies. Using pre- and post-operative plasma samples, we confirmed that elevation of plasma miR-92 and miR-17 is likely derived from CRC as most patients have markedly reduced levels after surgical resection of tumours. Intriguingly, the two upregulated miRNAs (miR-17-3p and miR-92) in CRC are encoded by a miR-17-92 gene cluster.4 The fact that both miR-92 and miR-17-3p expression are upregulated in plasma may be due to the similar regulatory mechanism. Indeed, the miR-17-92 cluster first attracted attention following a series of observations linking these miRNAs to cancer pathogenesis.23 24 The oncogenic role of miR-17-92 cluster where miR-17 and miR-92 are located had been reported in other cancers such as lymphoma,25 lung,26 27 and thyroid.28 Expression of miR-17-92 cluster promotes cell proliferation, suppresses apoptosis of cancer cells, and induces tumour angiogenesis.29
Since chronic inflammation is a risk factor for CRC, it may be that elevated plasma miR-92 level in CRC is a feature of bowel inflammation. Furthermore, to determine whether miR-92 elevation is CRC-specific, we examined plasma from patients with IBD and GC. Importantly, we showed that miR-92 elevation is not associated with inflammation or other gastrointestinal cancer and most likely is CRC-related. It is not clear why miR-92 is under-expressed in IBD cases. In the future, it is worth studying the underlying mechanism of plasma miR-92 level reduction in a large sample of patients with IBD compared to healthy controls. Elevation of plasma miR-92 level has not only detected in advanced stages but also in early stages of tumour, suggesting that this marker might be useful for early detection of CRC. There was no difference in plasma miR-92 level in stage I to IV of the disease. Furthermore, we have not been able to correlate the plasma miR-92 level with tumour volume and metastatic status.
Notably, we demonstrated that plasma miRNA-based qPCR assays can provide accurate screening methods for CRC. Our finding that differential expression of a single miRNA in plasma could discriminate CRC raises the possibility of using such markers to develop a non-invasive and rapid diagnostic test for CRC in the future. In comparison to the commonly employed stool tests, a plasma test is more convenient as there is no requirement for dietary restriction and meticulous collection of stool samples. Furthermore, miRNA markers have several advantages: (1) unlike screening for large numbers of mRNA expression, a modest number of miRNAs might be sufficient to differentiate cancers from normal; and (2) unlike plasma mRNAs, miRNAs in plasma remain largely intact and have been proven to be more stable for detection.16 19
Although our results are promising, there are several limitations in this study. First, as the sample size is still small, further validations of this marker in large cohorts and in independent studies are necessary. Second, qPCR by the relative quantification approach becomes less accurate if measuring with low levels of miRNAs, in which they may not fall into the linear range of the assay. Based on the Ct values of all samples, we believe that miR-92 is not of low abundance in plasma, yet absolute quantification approach with standard curve calibration would be preferable for further validation of our approach. Third, although miR-92 elevation in plasma are likely to be derived from CRC, it is uncertain whether this elevation is specific for CRC, and whether it can be used to differentiate sporadic from familial types of CRC. Thus, additional studies will be needed to examine familial and sporadic cases. Fourth, despite the significantly elevated levels of plasma miR-92 in stage I of CRC, it is desirable to examine whether its plasma level changes in patients suffering from adenoma with various degree of dysplasia in the future. If plasma miR-92 can be used for the detection of pre-malignant lesions such as adenoma, it would add more value to use this marker for CRC prevention.
In conclusion, differentially expressed miRNAs in plasma of patients with colorectal cancer have been reported in this study. MicroRNA-92 has reasonable sensitivity for CRC detection and compares favourably with the FOBT. This test, if validated in a large-scale study, may be useful in future as a non-invasive screening test for CRC.
REFERENCES
Supplementary materials
Web only appendix for 58;10:1375
Files in this Data Supplement:
Footnotes
Funding The project was supported by the CUHK Direct Grant No. 2041342 and Research Funding from the Institute of Digestive Disease and the Li Ka Shing Institute of Health Science, the Chinese University of Hong Kong.
Competing interests None.
Provenance and Peer review Not commissioned; externally peer reviewed.
See Commentary, p 1318
Ethics approval This project was approved by the Joint CUHK-NTE Clinical Research Ethics Committee, Hong Kong, on 27 February 2008.
▸ Two supplementary tables and a figure are published online only at http://gut.bmj.com/content/vol58/issue10