Article Text

Abstract
Objective: The aim of this study was to examine the relationship between tissue factor (TF), vascular endothelial growth factor (VEGF) and the onset of angiogenesis in the adenoma–carcinoma sequence (ACS), the stepwise process encompassing colorectal cancer (CRC) disease progression.
Patients and methods: 210 surgical specimens comprising the ACS were immunohistochemically stained for endothelial cells (CD31), VEGF and TF. Angiogenesis quantified using Chalkley grid analysis (microvascular density; MVD), and VEGF/TF expression were semiquantitatively graded and correlated with standard prognostic indicators including 5 year follow-up. VEGF and TF were measured by ELISA in tumour specimens and normal mucosa from an additional 90 CRC patients.
Results: There was a significant increase in MVD across the ACS (p < 0.0005) with significant correlations with Dukes’ stage (p = 0.01) and lymph node involvement (p = 0.02). The greatest increase in MVD was related to the onset of dysplasia, with an associated significant increase in VEGF expression (p < 0.0005). There was a significant relationship between VEGF and TF expression in the initial phase of the ACS (k = 0.44, p < 0.005), although no correlation between VEGF or TF, and MVD, tumour size, Dukes’ classification, lymph node involvement or survival was found.
Conclusions: These findings are the first to suggest that the angiogenic switch occurs at the onset of dysplasia in the ACS, and provide further evidence of the close association between VEGF and TF in the early stages of CRC development.
- ACS, adenoma–carcinoma sequence
- CCS, cumulative Chalkley score
- CRC, colorectal cancer
- IPC, intra-polyp carcinoma
- MVD, microvascular density
- TF, tissue factor
- VEGF, vascular endothelial growth factor
- angiogenesis
- haemostasis
- VEGF
- tissue factor
- colorectal cancer
Statistics from Altmetric.com
- ACS, adenoma–carcinoma sequence
- CCS, cumulative Chalkley score
- CRC, colorectal cancer
- IPC, intra-polyp carcinoma
- MVD, microvascular density
- TF, tissue factor
- VEGF, vascular endothelial growth factor
Blood clotting abnormalities are detected in up to 90% of patients with metastatic disease, and thrombosis represents the second most frequent cause of cancer-related mortality.1 Cancer coagulopathy is often linked to the upregulation of tissue factor (TF), the primary cellular initiator of the blood coagulation cascade.2 TF is a 47 kDa transmembrane protein that is the cell surface receptor for factor VIIa, and normally protects the vascular integrity of tissues by initiating the coagulation cascade on vessel injury. Under normal physiological conditions, the expression of TF is restricted to extravascular cells that only interact with the blood when vascular integrity is compromised.3 Factor VIIa then binds to TF on the cell surface leading to the activation of factor X and the generation of thrombin, with subsequent involvement of platelets and the formation of a fibrin clot.4
In contrast to the normal vasculature, where endothelial cells do not express TF, expression has been reported in tumour-associated vascular endothelial cells in patients with invasive but not benign breast tumours.5 Moreover, direct correlation has been found between elevated TF expression and advanced stages of malignancy in breast cancer,6 colorectal cancer (CRC)7 and pancreatic cancer,8 suggesting that TF promotes tumour growth and metastasis.
As a member of the class II cytokine receptor family, TF is also capable of transducing intracellular signals and regulating gene expression,9 including the upregulation of vascular endothelial growth factor (VEGF) expression within tumours.10 VEGF, a 34–45 kDa protein, is the most potent stimulator of angiogenesis, an essential pathway in tumour growth and metastasis. VEGF functions to stimulate endothelial chemotaxis, survival, proliferation and permeability, all of which are important processes in angiogenesis.11 Moreover, VEGF has been shown to correlate with blood vessel development (angiogenesis) as measured by microvascular density (MVD), a surrogate marker of angiogenesis, in a number of human cancers.12,13 Also, VEGF expression has been shown to correlate significantly with the aberrant expression of TF by tumour and/or endothelial cells in a number of human tumours,14–16 confirming the suggestion that TF may modulate angiogenesis, at least in part, by upregulating the expression of VEGF.17,18 Further data suggest that the cytoplasmic tail of TF is involved in VEGF upregulation in tumour cells.19
CRC is a common malignancy in the western world, and is the final stage of a stepwise progression from normal tissue, via a premalignant phase to invasive carcinoma known as the adenoma–carcinoma sequence (ACS). The ACS is a series of events whereby colorectal adenomas develop, initially showing low grade dysplasia, from which some will progress to develop areas of high grade dysplasia and eventually invasive carcinoma. MVD is significantly increased in both CRC and adenoma specimens compared with normal colonic mucosa,20,21 indicating that CRC does elicit an angiogenic response. Although there has been one suggestion that initiation of angiogenesis (the angiogenic switch) occurs simultaneous to invasion,22 there are no previously published studies evaluating MVD in each stage of the ACS. This study therefore quantifies the expression of TF and VEGF, and measures MVD across the whole ACS, to determine when the angiogenic switch occurs.
MATERIALS AND METHODS
Patients
Archival histological specimens were obtained from 210 patients in the Royal Hallamshire Hospital from 1995 to 1999. All specimens were reviewed by S.S.C. (a consultant histopathologist) and consisted of background mucosa (n = 45), low grade dysplastic polyps (n = 49), high grade dysplastic polyps (n = 20), intra-polyp carcinoma (IPC) (n = 30), Dukes’ A (n = 10), Dukes’ B (n = 28) and Dukes’ C (n = 28) carcinoma, respectively. The term “intra-polyp carcinoma” was used for adenomas that showed evidence of submucosal stalk invasion of less than 3 mm. CRC patients were excluded from the study if they had received neoadjuvant treatment. Following local ethics committee approval (SREC 97/78), 90 patients undergoing surgery for the removal of primary CRC were invited to participate in the study, and tissue specimens were obtained from these individuals.
Immunohistochemistry
Wax embedded colorectal specimens were sectioned (5 μm) and mounted on 3-aminopropyltriethoxysilane (Sigma, UK) coated slides. Immunohistochemistry was performed using a panel of antibodies to human CD31, an endothelial cell marker (M0823; Dako, UK), TF (4509; American Diagnostica, USA) and VEGF (A-20; Santa-Cruz, UK). A standard horseradish peroxidase staining procedure was followed using an appropriate biotinylated secondary antibody (Vector Laboratories, UK), the elite ABC kit (avidin: biotinylated enzyme complex; Vector Laboratories), and diaminobenzinide as the chromogenic substrate. The same antigen retrieval method was performed for each antibody as follows: sections were heated in a microwave in TRIS/EDTA for 3 minutes on high power, followed by 7 minutes on low power. Normal sera (horse for CD31 and TF, and goat for VEGF sections) and casein, both diluted 1:10 in phosphate buffered saline were used for blocking all sections and for dilution of the primary and secondary antibodies; anti-CD31 was diluted 1:50, anti-TF 1:100, anti-VEGF 1:300, anti-mouse secondary antibody 1:250 and anti-rabbit secondary antibody 1:300. Samples known to be positive for each factor (placenta and wounds) were included in each staining run, and negative controls were achieved by omission of the primary antibody and replacement of the primary antibody with normal mouse IgG (Dako) and normal rabbit IgG (Dako) at a dilution of 1:50.
MVD assessment
MVD was assessed using the Chalkley grid method, whereby tissue sections were examined at low magnification (40×) and five areas of increased MVD (vascular hotspots) were identified as previously described.23 Once an area had been selected, the cluster was viewed at high power using a Chalkley grid graticule, with random dots. Under high power (200×) the dots were aligned to touch the maximum number of vessels and these were counted. This gave a Chalkley grid score for each hotspot, and the sum of the Chalkley scores for each of the five hotspots was termed the “cumulative Chalkley score” (CCS).
Quantification of VEGF and TF staining
VEGF and TF staining was assessed using a semiquantitative grading system that reflected the intensity of staining present within the specimen. Analysis was carried out by an assessor fully trained by a consultant histopathologist (S.S.C.). Positive staining was defined as when the VEGF staining score within the polyp/tumour specimen was greater than the VEGF staining score within the corresponding background mucosa. When a corresponding background mucosa specimen was not available, the mean VEGF grading score for all the background mucosa specimens was used as a comparison. In this way it was possible to assess whether levels of VEGF/TF were increased in tumour compared with normal colorectal tissue, and if so the tumour was deemed to “express” VEGF/TF.
Intra and interobserver error
To establish the reproducibility of the Chalkley grid method for quantifying MVD, and for the quantification of VEGF and TF staining, 10% of the slides were counted by a second experienced observer in a blinded manner. A selection of the slides was also counted for a second time by the first observer. Intra and interobserver error was assessed 4 weeks apart, on 20 slides from each group, and analysed statistically.
ELISA for TF and VEGF expression in CRC
Fresh tissue specimens for both background mucosa and invasive colorectal carcinomas were obtained from individuals undergoing surgery (n = 90). Samples were snap-frozen immediately after removal and stored at −80°C until homogenisation. Upon thawing, samples were homogenised for 10 minutes in TRIS-buffered saline pH 8.5, after which time detergent (Triton X-100) was added to the suspension, which was agitated at 4°C for a further 12 hours. After centrifugation at 30 000g for 60 minutes at room temperature the supernatant was diluted 1:10 before the protein concentrations of the lysates were determined using the BCA protein assay. Tumour lysate antigens of TF and VEGF were measured in duplicate using commercial two-antibody sandwich assays kits (TF: Immubind, American Diagnostica; VEGF: Quantikine, R&D Systems), and assays were performed according to the manufacturers’ instructions. The detection limits of the TF and VEGF assays were 10 pg/ml and 30 pg/ml, respectively. The measurements were performed on an ELISA plate reader and calibrated using the supplied reference samples and standards. The inter and intraassay coefficients of variation were less than 10%.
Follow-up
Follow-up information including the date and cause of death were gathered by written enquiries to the Trent Cancer Registry according to our ethics committee approval, and the follow-up time was completed in October 2006. Patients who had died during the follow-up period from cancer-unrelated causes were treated as censored by statistical survival analysis.
Statistical analysis
Data were analysed using SPSS 12.0 (SPSS Inc., Chicago, Illinois, USA) and appropriate non-parametric tests were used to investigate factor expression and clinicopathological parameters (Mann–Whitney U test for two independent groupings, Kruskal–Wallis test for more than two independent groupings and Jonckheere–Terpstra test for ordinal categorical groupings). Survival curves were plotted using the Cox regression model and analysis was carried out using “death due to colorectal cancer” as the endpoint for overall survival. The influence of each variable on survival was assessed using the Cox proportional hazards regression model. The statistical significance was assessed at the 95% level and the Kappa statistic (κ) was used to assess interobserver agreement. Correlations were performed using the Pearson’s product moment correlation coefficient.
RESULTS
Patient demographics
The median age of the entire group of patients was 70 years (range 28–90), with the male to female ratio being 39 : 27 and 57 : 41 (with one unknown) for the polyps and carcinoma specimens, respectively. The majority of polyps and tumours (73% and 88%) arose from the left side of the colon and rectum.
MVD assessment
Small vessels were commonly seen evenly spaced within the background mucosa, whereas tumours and polyps exhibited varying degrees of MVD, with vessels with different calibres clustering together in hotspots around the dysplastic cells (fig 1A and B). Cumulative microvessel densities were significantly increased across the ACS (p < 0.0005), with the greatest increase occurring at the initial dysplastic transformation from normal mucosa (mean CCS ± SEM 21.5 ± 0.53) to low grade dysplastic polyps (mean CCS ± SEM 38.0 ± 1.40; fig 1C). MVD was significantly increased in tumours with higher Dukes’ stage (p = 0.013) and carcinomas with lymph node involvement (p = 0.023). No relationship was observed between tumour site and MVD. The correlation coefficients for inter and intra-observer error scores for MVD assessment were 0.87 and 0.96, respectively, showing a high level of agreement.

Microvessel density across the adenoma–carcinoma sequence. Representative examples of CD31 staining of endothelial cells in (A) normal glandular colonic mucosa yielding a low microvascular density (MVD) score and (B) an area of colorectal carcinoma (CRC) showing a high MVD. In both cases vessel lumen are clearly visible (original magnification ×200). (C) Box and whisker plots representing microvessel density counts from the initial and the final phases of the adenoma–carcinoma sequence (ACS). Data are presented as the median cumulative Chalkley score (CCS; horizontal line), with the box representing the 25th and 75th centiles, the whiskers representing the statistical range and outlying data points depicted separately. An increase in MVD is clearly seen at all stages of the ACS (p < 0.0005) compared with background mucosa.
VEGF expression in the ACS
VEGF was expressed by a proportion of adenoma and carcinoma cells, with grading scores varying from 1 to 3 (fig 2). In addition, expression was observed in some tumour-derived endothelial cells (fig 2) and macrophages. VEGF expression significantly increased across the adenoma phase of the ACS (p < 0.0005) although no further increase in expression was observed within the carcinoma phase, despite 74% of the carcinoma specimens expressing VEGF (table 1, fig 3A). No statistically significant differences were observed between tumour site, Dukes’ stage and lymph node involvement and positive tumour VEGF expression. Furthermore, there was no significant relationship between VEGF expression and MVD counts. The correlation coefficients for inter and intra-observer error scores for VEGF assessment were 0.850 and 0.867, respectively, showing a high level of agreement. The ELISA showed a significant increase in VEGF expression in carcinomas compared with respective background mucosa (1639 ± 113 versus 431 ± 35 pg/mg protein, p<0.001).
Percentage of cases showing vascular endothelial growth factor and tissue factor expression across the adenoma–carcinoma sequence

Immunohistochemical staining with anti-vascular endothelial growth factor and anti-tissue factor antibodies. Representative examples from colorectal tumours are shown giving examples of negative cases for both vascular endothelial growth factor (VEGF) and tissue factor (TF) with no immunoreactivity (score 0), examples of positive cases with weak immunoreactivity for VEGF and TF (score 1), and positive cases with strong immunoreactivity for VEGF and TF (score 3). With both antibodies, staining is seen at the membrane and within the cytoplasm of tumour cells (original magnification ×200). Endothelial cells (arrows) also show moderate immunoreactivity for both VEGF and TF without any evidence of thrombosis formation (original magnification ×400).

Vascular endothelial growth factor and tissue factor expression across the adenoma–carcinoma sequence. (A) Percentage of cases with varying vascular endothelial growth factor (VEGF) expression in the adenoma–carcinoma sequence (ACS). A significant increase in VEGF expression is seen in the initial phase of the ACS (*p < 0.0005). (B) Percentage of cases with varying tissure factor (TF) expression in the ACS. The sections of each bar represent the percentage of each group with a particular score, 0–3.
TF expression in the ACS
Polyp and carcinoma specimens demonstrated TF staining scores ranging from 0 to 3 (fig 2), with 51% of the carcinoma specimens expressing TF (table 1), and in a similar manner to VEGF tumour-derived endothelial cells expressed high levels of TF (fig 2). There were, however, no statistically significant differences in TF expression across the ACS (fig 3B). Furthermore, both the degree of TF staining and TF expression did not significantly correlate with MVD. No significant relationship was observed between TF expression and tumour site, Dukes’ stage or nodal status. The correlation coefficients for inter and intra-observer error scores for TF immunohistochemistry assessment were 0.92 and 0.89, respectively, showing a high level of agreement. ELISA studies demonstrated a significant increase in TF expression in tumour tissue extracts compared with relative background mucosa (37.8 ± 1.6 versus 30.9 ± 1.2 ng/mg protein, p < 0.01).
There was a relationship between TF and VEGF expression, with sections from the same polyp/tumour exhibiting co-localisation of staining. There was a significant relationship between VEGF and TF expression in the carcinoma specimens (κ = 0.24, p = 0.04), with a higher level of agreement in the adenoma specimens (κ = 0.44, p < 0.0005). ELISA studies also demonstrated a significant correlation between the concentrations of TF and VEGF in tumour tissue extracts (r = 0.36, p < 0.05).
Survival analysis
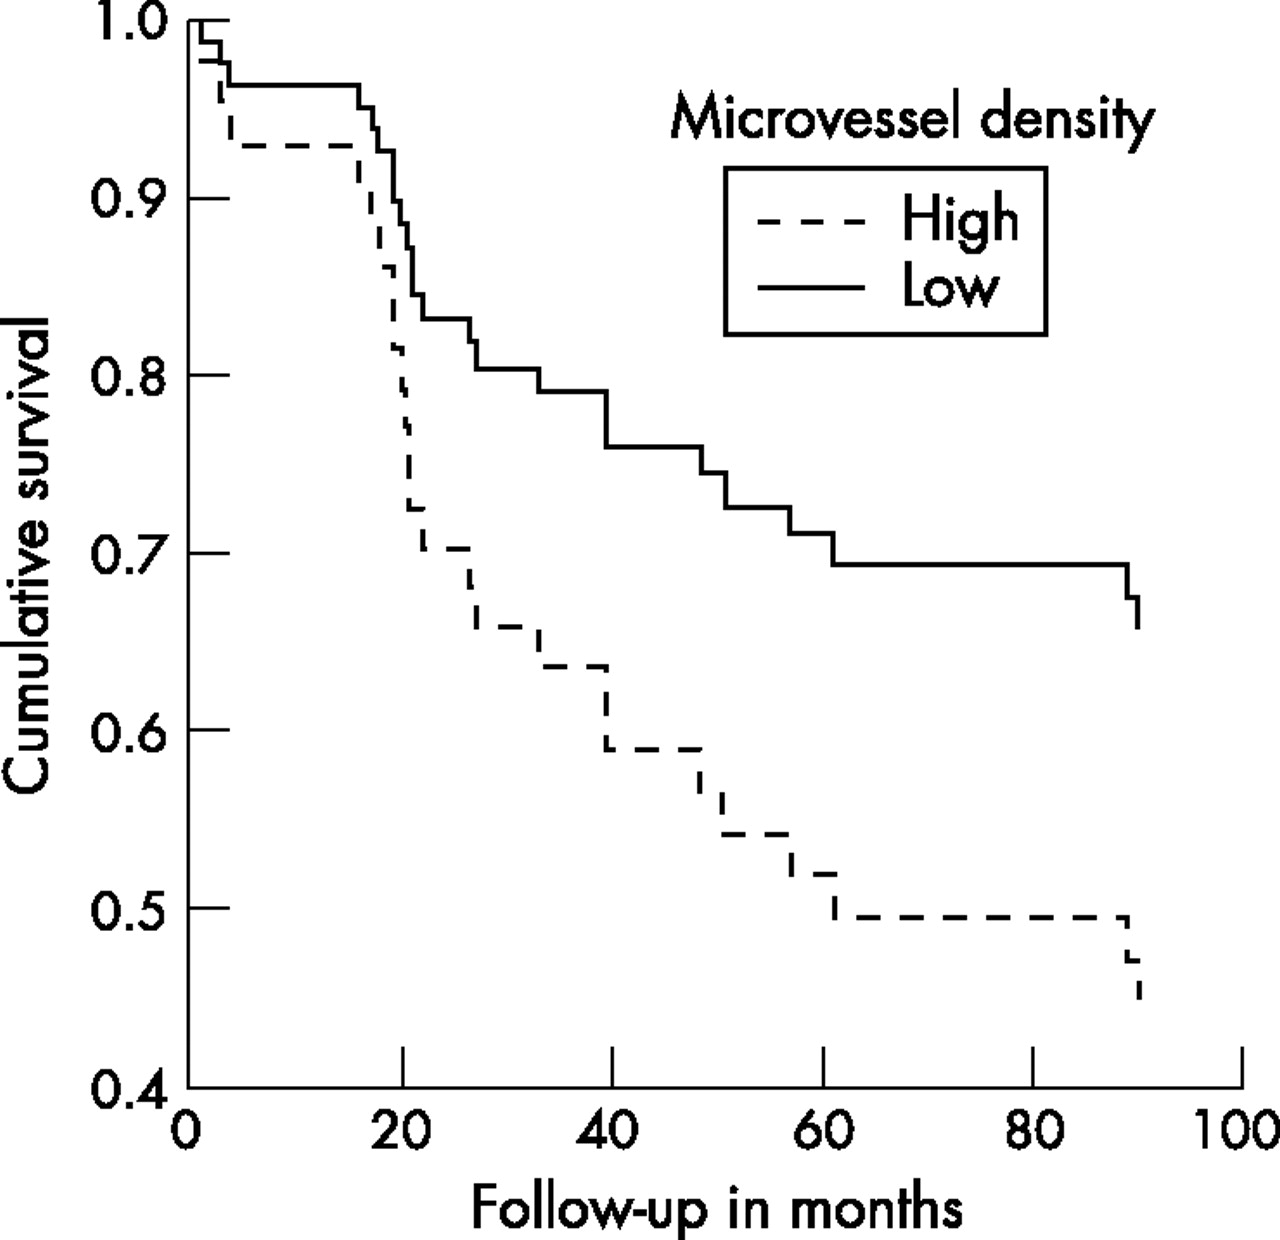
Fifty-six of the 66 patients with CRC (Dukes’ A–C) at the time of diagnosis were followed up for a median of 69 months (range 1–129). The Cox regression curve for MVD (fig 4) demonstrate that when the survival of CRC patients having a high CCS (49 (the median) or more) was compared with patients with a low CCS (below 49) there was an unfavourable influence of MVD on CRC-specific survival, which did not achieve significance (p = 0.120). Univariate analysis revealed that neither VEGF nor TF expression were associated with prognosis (p = 0.296 and p = 0.853, respectively).
Cox regression survival data for microvascular density. Comparison of overall survival using Cox regression analysis between groups of patients with low (less than 49) and high (49 or above) cumulative Chalkley score (CCS). The difference between the two groups does not achieve significance (p = 0.12).
DISCUSSION
Previous studies have suggested that the angiogenic switch occurs simultaneously with tumour invasion;22 however, MVD analysis of all stages of the ACS were not performed. This is the first study to investigate and quantify MVD across the entire ACS, demonstrating that angiogenesis is significantly increased much earlier in the disease spectrum than has previously been reported, with a progressive increase in MVD throughout the ACS. The greatest increase in angiogenesis occurs at the earliest stage of dysplastic transformation, suggesting that the angiogenic switch occurs at this point in the ACS. Interestingly, it may be that the angiogenic switch actually occurs before adenoma formation, as studies by Shpitz et al.,24 demonstrated increased angiogenesis in aberrant crypt foci, the earliest morphologically identifiable preneoplastic lesions in colonic mucosa. We were unable to include this group in our studies. These data suggest that although angiogenesis is essential for tumour growth,25 the tumours do not, as previously thought, need to be 2 mm3 and undergoing hypoxic or redox stress to elicit an angiogenic response. Angiogenesis appears more likely to be related to the factors involved in the generation of aberrant crypt foci and polyps.
Our data clearly demonstrate a significant increase in MVD at each stage of the ACS, in agreement with previous studies in which MVD correlates with the Dukes’ stage26 and lymph node involvement,27 factors usually associated with poor prognosis. Although patients with high MVD (⩾ 49) tended to have a poorer prognosis than patients with low MVD (< 49), this did not achieve significance. This may be a result of the relatively small numbers in each subgroup in the current study, and increasing the number of cases may enhance these findings. Interestingly, these data are in agreement with many previously published studies, in which MVD quantified using CD31 staining failed to show a significant relationship with survival;20,28,29 however, a recent meta-analysis has suggested that MVD is inversely related to CRC survival.30 Although the MVD increased across the adenoma–carcinoma spectrum, and the vessels quantified in the hotspots were more variable than in background mucosa, qualitatively there did not appear to be changes in vascular volume or surface area.
Studies investigating VEGF, the most potent pro-angiogenic factor in the ACS, are relatively few, with the current study being the only one to include both low and high grade dysplastic polyps as well as IPC. Our data show that VEGF expression is significantly increased during the early phases of the ACS, with no further increases in the carcinoma phase. In addition, the high grade dysplastic polyps and IPC specimens demonstrate the highest degree of VEGF expression (80% and 90%, respectively), suggesting that VEGF may play a role in both carcinogenesis and angiogenesis. A number of previous studies failed to identify VEGF expression in adenomas,31–33 whereas others are in agreement with our findings demonstrating VEGF expression in adenomas.34,35 All those studies do, however, agree that VEGF expression is elevated upon progression from adenoma to carcinoma, and also support the theory that VEGF is involved in carcinogenesis, potentially by binding to VEGF receptors on CRC cells and inhibiting tumour cell apoptosis.36
Although VEGF is a key angiogenic factor and is significantly upregulated at the initial phase of the ACS alongside MVD, there was no significant relationship between the two factors in the carcinoma specimens, although some studies have indicated a correlation in CRC.37,38 Despite VEGF being a crucial and well studied angiogenic cytokine that showed significantly increased expression in CRC compared with background mucosa (ELISA studies), many other factors may also regulate angiogenesis in CRC, and our data are in agreement with those of Tabara and colleagues39 demonstrating that VEGF did not correlate with MVD, whereas basic fibroblast growth factor, another potent pro-angiogenic cytokine, correlated with MVD in CRC. Furthermore, our data indicate that VEGF did not correlate with survival and was not an independent risk factor, in agreement with the majority of previous immunohistochemical-based studies.32,37,40
VEGF has been reported to induce TF expression in endothelial cells, and although the details of the intracellular signalling pathway responsible for this induction have not yet been fully elucidated, reporter gene studies imply that transcription factors including EGR-1 and Sp1 are involved.41,42 In agreement with this, we found both TF and VEGF expression in the endothelial cells of many tumour-associated blood vessels.
TF is expressed by tumour cells in a number of human malignancies including pancreatic,43 hepatic44 and colorectal.27 In the current study, 51% of colorectal tumour specimens expressed TF, in agreement with previous studies reporting that 46–57% CRC express TF,7,27,45,46 and our ELISA data showed a significant increase in TF expression in CRC compared with background mucosa. Interestingly, we demonstrated TF expression in adenomas of varying histological grade, which is in direct contrast to a small study in which TF was not identified in six adenoma specimens.46 The finding that TF was expressed to the greatest degree in high grade dysplastic polyps (80%) suggests that, like VEGF, TF may play a role in the transformation from dysplasia to carcinoma. The activation of K-ras and the subsequent loss of p53 are key changes in the ACS, and these events have recently been associated with TF expression in CRC cells in culture.47 Moreover, TF, again like VEGF, has been shown to be anti-apoptotic for tumour cells, thereby promoting cell survival.9
Furthermore, TF is thought to regulate angiogenesis, at least in part, by upregulating VEGF expression.10 Our results agree with earlier reports demonstrating a significant correlation between VEGF and TF expression in carcinomas, both using ELISA and immunohistochemistry techniques.7,27,48 A stronger relationship was observed in the adenoma specimens, however, with both VEGF and TF most strongly expressed at the same phase (high grade dysplastic polyps) of the ACS, possibly indicating a close relationship in disease progression, although there is no association between TF and MVD at the low grade dysplasia stage. This is in direct contrast to the study by Nakasaki et al.,27 which may be a result of the vessels being stained with von Willebrand factor, counted manually and not with a Chalkley grid, and that adenomas and IPC were not included in the study. An additional factor may be that the expression of TF was similar to the background mucosal tissue in the current study.
In contrast to studies with MVD and VEGF, there is only one published report relating TF to prognosis. This is an immunohistochemical study involving 67 patients with advanced CRC, who showed a significantly lower survival rate over 3 years with TF-positive tumours (29%) compared with patients with TF-negative tumours (88%).7 In contrast our study, which used the complete spectrum of CRC (Dukes’ A–C) failed to show any relationship between TF expression and survival over a 5 year period, suggesting that TF may only be a prognostic factor in advanced CRC. This may agree with the literature suggesting that TF expression is an indicator of hepatic or lymphatic metastasis, both factors associated with poor prognosis.27,45
In conclusion, this is the first study to assess angiogenesis, VEGF and TF in the complete ACS of CRC in a large cohort of patients. These data suggest that the angiogenic switch occurs at the onset of dysplastic transformation in the polyp, which has not previously been reported. There is a trend, although not statistically different, for patients with higher MVD to have a worse prognosis than patients with lower MVD, which has not previously been reported. Moreover, a significant relationship has been identified between VEGF and TF expression, especially in the initial phases of the ACS, suggesting the importance of both these factors in CRC angiogenesis, disease progression and tumour biology. Further work is needed to examine the precise relationships between VEGF and TF in the development of CRC.
Acknowledgments
The authors would like to acknowledge the technical assistance of Yvonne Stephenson who sectioned the paraffin-embedded tissue for histological examination, in addition to Yorkshire Cancer Research and the University of Sheffield Medical School who generously funded this project.
REFERENCES
Footnotes
-
Published Online First 12 June 2007
-
Conflict of interest: None declared.
Linked Articles
- Digest