


Abstract
Background: Carboplatin and paclitaxel form the cornerstone of chemotherapy for epithelial ovarian cancer, however, drug resistance to these agents continues to present challenges. Despite extensive research, the mechanisms underlying this resistance remain unclear. Materials and Methods: A 2D-gel proteomics method was used to analyze protein expression levels of three human ovarian cancer cell lines and five biopsy samples. Representative proteins identified were validated via western immunoblotting. Ingenuity pathway analysis revealed metabolomic pathway changes. Results: A total of 189 proteins were identified with restricted criteria. Combined treatment targeting the proteasome-ubiquitin pathway resulted in re-sensitisation of drug-resistant cells. In addition, examination of five surgical biopsies of ovarian tissues revealed α-enolase (ENOA), elongation factor Tu, mitochondrial (EFTU), glyceraldehyde-3-phosphate dehydrogenase (G3P), stress-70 protein, mitochondrial (GRP75), apolipoprotein A-1 (APOA1), peroxiredoxin (PRDX2) and annexin A (ANXA) as candidate biomarkers of drug-resistant disease. Conclusion: Proteomics combined with pathway analysis provided information for an effective combined treatment approach overcoming drug resistance. Analysis of cell lines and tissues revealed potential prognostic biomarkers for ovarian cancer.
Epithelial ovarian cancer (EOC) is the second commonest cause of death from gynaecological cancer worldwide, with approximately 239,000 new cases diagnosed worldwide and 142,000 deaths annually as a result of its late presentation (1). Standard treatment for advanced EOC (stage 3 and 4) includes surgery and chemotherapy. Results of clinical trials performed over the past 30 years have identified the platinum drugs (carboplatin or cisplatin) and taxanes (paclitaxel/Taxol™ or docetaxel/Taxotere™) given intravenously as the best standard first-line treatments (2-6).
As in other types of cancer, the effectiveness of the aforementioned chemotherapeutic agents is limited by drug resistance. The acquisition of resistance constitutes a serious impediment to improving outcomes in oncology, such as disease-free survival (DFS) and overall survival (OS). Typically, many patients with advanced EOC show an excellent response (70-80%) during their primary treatment. However, this is frequently followed by the development of fatal drug resistance, with DFS as early as 6 months following completion of their primary treatment (7, 8). This is reflected in the poor 5-year overall survival of patients with advanced ovarian cancer, which ranges between 25-35%.
Although the molecular basis for platinum resistance remains largely undefined, it is considered multi-factorial and numerous mechanisms seem to be involved. Many drug-resistant cancer cells exhibit pleomorphic phenotypes, the result of multiple altered pathways involving reduced drug uptake, faulty DNA-damage recognition and repair, and an inappropriately reduced apoptotic response (9). Drug resistance may either occur through insufficient DNA binding, which is limited by reduced accumulation of the drug, enhanced drug efflux and cisplatin inactivation by coordination to sulphur-containing proteins (10), or mediated after DNA-binding via increased repair of platinum–DNA adducts (10, 11), increased tolerance to platinum-induced DNA damage (12), or through decreased expression or loss of apoptotic signaling pathways (9).
Approaches to overcoming taxane resistance include the use of multidrug resistance modulators (13), if the resistance correlates with p-glycoprotein (P-gp) overexpression, or novel cytotoxic molecules, developed on the basis of activity in Taxol-resistant models, such as the epothilones (14), although these approaches have had limited success in clinical trials (15).
Proteomics has been very useful in the analysis of complex proteomic samples as the identification of individual protein scans facilitates and enhances our understanding of molecular cell biology.
A small number of in vitro proteomic studies have been carried out which compare the drug-resistance profile of ovarian cancer cell lines with their sensitive counterparts. For example, ovarian cancer cell line IGROV1 and its cisplatin-resistant counterpart IGROV1-R10 (16); SKOV3 and A2780 with four drug platinum-resistant (17, 18); SKOV3 and A2780 and their derived counterparts with acquired resistance to antimitotic agents and microtubule inhibitors (19-21).
In the present study, a proteomics approach was used to identify markers of drug-resistant ovarian cancer. Protein samples extracted from cancer cell lines and tumour biopsies were subjected to two-dimensional gel electrophoresis (2D-GE) techniques, followed by in-gel trypsin digestion and liquid chromatography-tandem mass spectrometry (LC-MS/MS). The differential protein expression levels were assessed using pathway analysis and representative proteins were selected for validation using western blotting. Following the identification of particular pathway alterations, we employed the approach of using the specific pathway inhibitor bortezomib to reverse drug resistance in drug-resistant cell lines with increased proteasome activity. Identification of selected proteins from biopsy samples were also compared with cell line samples, which revealed potential cancer biomarkers.
Materials and Methods
Materials. Urea, 1,4-dithiothreitol (DTT), triton X-100, glycerol, bromophenol blue, iodoacetamide, agarose, acetic acid, sodium dodecyl sulphate (SDS), Tris, carboplatin, paclitaxel and 3-(4,5-dimethylthiazol-2-yl)-2,5-diphenyltetrazolium bromide (MTT) dye were purchased from Sigma-Aldrich, Dorset, UK. 3-[(3-Cholamidopropyl)dimethylammonio]-1-propanesulfonate (CHAPS), methanol, ethanol, formic acid, water, hydrochloric acid and acetonitrile were from Fisher Scientific, Loughborough, UK. Thiourea, ampholyte solution and ammonium bicarbonate were obtained from Fluka, Dorset, UK. All solvents used for mass spectrometry analysis were high-pressure liquid chromatography (HPLC) grade.
The parental ovarian cancer cell line model PEO1 was used as a drug-sensitive reference cell line. Novel drug-resistant models, derived from the parental line, were used alongside their respective drug-sensitive parental counterparts.
The ovarian tissues (SOV-1, SOV-2, SOV-3, SOV-4, SOV-5) were obtained by surgical biopsy from five different patients, four of whom were diagnosed with ovarian cancer and one with endometriosis, a benign gynaecological condition. Relevant clinical information regarding tissue histology, stage of disease and response to chemotherapy are summarised in Table I.
Cell culture. The PEO1 cell line (originally obtained from Professor F. Balkwill, formerly ICRF, London, UK) was cultured as monolayers in RPMI-1640 medium and supplemented with 10% heat-inactivated foetal calf serum (FCS; Invitrogen, Paisley, UK). Drug-resistant variants were derived by step-wise incubation of the inducing agent over a number of months until a stable resistance phenotype was acquired. This resulted in the paclitaxel-resistant PEO1TaxR variant line (maintenance dose 8 nM paclitaxel) with approximately 15-fold resistance to paclitaxel, and carboplatin-resistant PEO1CarboR variant line (maintenance dose 2 μM carboplatin) with approximately 8-fold resistance to carboplatin (22). Cell confluence was checked using a light microscope before harvesting. Cells were harvested by trypsinization with 0.05% Trypsin-EDTA solution (Gibco, Invitrogen, UK), collected into 1.5 ml microfuge tubes and centrifuged at 11,337 × g for 10 min at room temperature in a Technico Maxi centrifuge (Fisher Scientific, Loughborough, UK). The supernatant was discarded and the pellets were washed three times with phosphate-buffered saline (PBS) (Oxoid, Loughborough UK), before being stored at −80°C until further use.
Protein extraction from cells. For the tissue biopsies used in this study, patients gave their informed consent prior to surgery in accordance with the National Ethics Committee REC (application number 07/Q11909/14). Tumour biopsies were collected and snap-frozen during surgery (either primary laparotomy or interval debulking following chemotherapy). The histological assessment of the remaining tumour was undertaken by a specialist gynaecological pathologist (Section of Histopathology, Royal Surrey County Hospital, Guildford, Surrey, UK) and discussed as part of routine patient care at the weekly multidisciplinary team meeting.
Dry-stored tissue or cell line-derived pellets were thawed and resuspended in 200 μl lysis buffer (50 mMTris-HCl, pH 8.3; 0.5% SDS) containing protease inhibitor cocktail (Amersham Biosciences, Little Chalfont, UK). The cellular mixtures were boiled for 10 min at 100°C and spun at 11,337 × g for 30 min at 4°C in a Biofuge Fresco centrifuge (Heraeus, Northbrook, UK). The supernatants with dissolved proteins were transferred to clean microfuge tubes and stored at −80°C until further use.
Protein extraction from tissues. Ovarian tissues were individually weighed and washed with 40 mM Tris-HCl, pH 8 to remove excess blood. Tissue samples were cut into 2-5 mm pieces, which were then placed into microfuge tubes on ice and a suitable volume of modified lysis buffer (9.5 M urea, 4% CHAPS, 0.1% Triton X-100, 5 mM DTT) containing protease inhibitor cocktail (Amersham Biosciences) was added to each tube. Tissues were homogenised using steel beads in a TissueLyser (Qiagen, Manchester, UK) twice for 2 min at a frequency of 30.0 cycles/s. After homogenisation, tissue lysates were transferred to clean tubes followed by centrifugation to remove cellular debris at 11,337 × g for 30 min at 4°C in a Biofuge Fresco centrifuge (Heraeus). The supernatants were carefully transferred to other tubes and stored at −80°C until further use.
Protein concentration assay. Protein concentrations of all cell and tissue lysate samples were determined using the RCDC Protein Assay Kit (Bio-Rad, Hemel Hempstead, UK). Bovine plasma γ-globulin (Bio-Rad) was used as protein standard and serial dilutions were prepared from the initial stock concentration of 1.5 mg/ml, using the same buffer as for the samples and used to prepare a standard curve. The assay was performed in triplicate and in accordance with the manufacturer's instructions. Absorbance values were measured at 750 nm and linear regression and protein concentrations calculated.
Clinical information from five different patients and their respective ovarian tissue biopsies.
Two-dimensional gel electrophoresis. First dimension and isoelectric focusing: Cell and tissue lysates, with 50 μg protein, were pre-treated with ReadyPrep 2-D Clean Up Kit (Bio-Rad) to remove contaminants. Isoelectric focusing was performed using Protean IEF Cell (Bio-Rad) with 11 cm ReadyStrips, pH 3-10 non-linear (Bio-Rad). Pellets resulting from the pre-treatment were resuspended in rehydration buffer (7 M urea, 2 M thiourea, 4% CHAPS, 20 mM DTT, 0.5% ampholyte solution pH 3-10) to a total volume of 200 μl. Mixtures were centrifuged at 13,148 × g for 5 min at room temperature and the supernatants were loaded into a focusing tray. The immobilised pH gradient (IPG) strips were placed above the mixtures and the liquid was allowed to distribute for 1 h before covering the strips with mineral oil (Bio-Rad). The rehydration procedure was performed at 50 V (active rehydration) for 12 h. The focusing was then started and carried out on a rapid ramp according to the following steps: 250 V for 15 min; 8,000 V for 2 h; 8,000 V until 40,000 V/h. Both rehydration and focusing procedures took place at 20°C. IPG strips were immediately used for the second dimension or stored at −80°C.
Reduction and alkylation: IPG strips were washed three times with equilibration buffer (0.375 M Tris-HCl pH 8.8, 6 M urea, 20% glycerol, 2% SDS) and then incubated in 55 mM DTT solution in equilibration buffer for 1 h at room temperature with constant shaking. After incubation, the DTT solution was discarded and 100 mM iodoacetamide solution in equilibration buffer was added to the strips. The strips were then incubated in the dark for 1.5 h at room temperature with constant shaking, after which the iodoacetamide solution was discarded. The alkylation process was stopped by washing the strips with an equal volume of rehydration buffer without DTT (7 M urea, 2 M thiourea, 4% CHAPS) for 10 min at room temperature.
Second dimension–sodium dodecyl sulfate polyacrylamide gel electrophoresis (SDS-PAGE): Each strip was transferred to the top of a Criterion TGX Precast Gel, any kD, IPG + 1 well comb, 11 cm IPG strip (Bio-Rad). A molecular weight marker was loaded into the single well. The IPG strips were fixed to the second dimension gels with 1% low melting agarose in stacking buffer (0.5 M Tris-HCl pH 6.8) with a trace of bromophenol blue. After allowing the agarose to solidify for 5 min and filling the reservoirs with 1x Tris-Glycine-SDS running buffer (Bio-Rad), electrophoresis was started. This process was carried out using a Criterion Cell System (Bio-Rad) at 150 V until the dye front had reached the bottom of the gel. Gels were stained immediately after the second dimension.
Staining and image analysis: Gels were silver stained using a Pierce Silver Stain Kit (Thermo Scientific, London, UK) according to the manufacturer's instructions. Spots of interest were selected either visually or using PDQuest Advanced software version 8.0.1 (Bio-Rad). Protein expression levels were calculated as fold regulation, i.e. comparing parent PEO1 cells vs. control (drug-resistant variant). An arbitrary number of 1,000 was set for exclusive spots, e.g. “-1,000” means only found in control and “1,000” indicates only found in sample (See Supplementary data).
In-gel trypsin digestion. Spots of interest were cut into 1-2 mm3 gel pieces, either manually or using an EXQuest Spot Cutter (Bio-Rad), which were placed into 0.6 ml siliconized tubes and rinsed twice with 190 μl of wash solution (50% methanol + 5% acetic acid) at room temperature for 3 h and overnight, respectively. Gel pieces were then dehydrated in 190 μl of acetonitrile at room temperature for 5 min, after which the samples were dried in a vacuum centrifuge for 3 min. Sample reduction was performed with 30 μl of 10 mM DTT in 100 mM ammonium bicarbonate solution at room temperature for 30 min, followed by alkylation with the same volume of 100 mM iodoacetamide in 100 mM ammonium bicarbonate solution at room temperature for another 30 min. Samples were dehydrated again in 190 μl of acetonitrile at room temperature for 5 min and dried in a vacuum centrifuge for 3 min. Gel pieces were rehydrated in 190 μl of 100 mM ammonium bicarbonate at room temperature for 10 min and then dehydrated in acetonitrile and dried in a vacuum centrifuge. Finally, samples were rehydrated on ice for 10 min with 20 μl of trypsin solution [20 ng/μl sequencing-grade modified porcine trypsin (Promega, Southampton, UK) in ice-cold 50 mM ammonium bicarbonate pH 8.0] with occasional vortex mixing. Samples were spun down for 30 s and excess trypsin solution was removed. An aliquot of 10 μl of 50 mM ammonium bicarbonate solution was added to prevent gel pieces from drying and proteins were digested overnight at 37°C.
After digestion, 30 μl of 50 mM ammonium bicarbonate solution were added to each tube containing the gel pieces and the mixtures were vortexed for 10 min, after which supernatants were collected and transferred to new tubes. Peptides were firstly extracted from the gel pieces with 30 μl of extraction buffer I (50% acetonitrile + 45% water + 5% formic acid) for 10 min. A second extraction was performed with 30 μl of extraction buffer II (85% acetonitrile + 10% water + 5% formic acid) for another 10 min. Supernatants were collected after each extraction and combined with the previous fraction. The extracts volume was reduced to <10 μl by evaporation in a vacuum centrifuge. The final dried extracts were re-dissolved in 99.9% water + 0.1% formic acid, sonicated for 10 min, centrifuged for 5 min and transferred to MS vials.
LC-MS/MS analysis. Peptides were analyzed on a Waters CapLC system coupled to the front end of a Waters Micromass Q-ToF Premier (Waters Micromass, Manchester, UK). Depending on the intensity of the spot on the 2-D gel, 1-5 μl were injected per sample. A 63-min gradient LC method was followed: t=0.1 min, 5% mobile phase B; t=3 min, 5% B; t=40 min, 28% B; t=49 min, 80% B; t=52min, 80% B; t=53 min, 5% B and t=63 min, 5% B (mobile phase A: 5% Acetonitrile (ACN) + 0.1% formic acid; B: 95% ACN + 0.1% formic and). Initial flow from the CapLC was at 6 μl/min, which was split prior to the column such that the flow through the column to the MS was only 200 nl/min. Peptides eluted off the column were directly sprayed into the MS for analysis. The acquisition and processing software used was Waters MassLynx Version 4.1. MS was monitored over a m/z range of 400-1700 Da and MS/MS was monitored over a m/z range of 50-1700 Da. Capillary was at 1.8 kV, cone voltage at 35 V and collision energy at 35 eV.
Data processing and database searching. Raw LC-MS/MS data were processed and .pkl files created using MassLynx Version 4.1 (Waters) and used to perform database searches using the online search engines Mascot (version 2.4; Matrix Science, Boston, MA, USA) and X!Tandem (The GPM, version 2012/10/19, http://www.thegpm.org/index.html), and choosing SwissProt databases (last used v2012/11, number of entries 538,585) to look for human proteins (taxonomy: Homo sapiens). Searches were performed without restriction of protein molecular mass or pI, but with variable modifications such as carbamidomethylation of cysteines and oxidation of methionine residues. One trypsin miscleavage was allowed. Peptide and fragment mass tolerances were set to ±0.1 Da and peptide charge to 2+, 3+ and 4+. Instrument type chosen was ESI-QUAD-TOF.
Scaffold 3 software version 3.6.4 (Proteome Software, OR, USA) was used to combine and compare proteins identified among different biological samples and to group proteins by biological relevance and molecular function.
Pathway analysis. Pathway analysis was performed using Ingenuity Pathway Analysis (IPA) software (Ingenuity Systems, Qiagen, CA, USA).
Western blot. A total of 20 μg of protein per well was loaded onto Bio-Rad precastMini-Protean TGX precast gels, any kD, 10-well comb, 30 μl/well (Bio-Rad). Proteins were separated by SDS-PAGE and transferred onto nitrocellulose membranes (Hybond-C Extra; Amersham Biosciences) using a Mini Trans-Blot Transfer Cell (Bio-Rad) for 1 h at 100 V.
Data obtained using the MTT assay in human ovarian cancer cell lines treated with bortezomib.
After blocking with 1% bovine serum album (Sigma-Aldrich) or 1 % milk (dried skimmed milk, Marvel) in TBS buffer for 1 h at room temperature, the membranes were probed with rabbit polyclonal primary antibodies, diluted in blocking solution, overnight at 4°C. Antibodies to 14-3-3, anti-thioredoxin (TRX) and ubiquitin-conjugating enzyme 2 K (UBE2K) were diluted at 1:1000. Antibodies to ubiquintin-conjugating enzyme E2 variant 2 (MMS2) and actin were diluted at 1:100. Antibody to phosphoglycerate mutase 1 (PGAM1) was diluted at 1:100. A list of the primary antibodies used, their supplier and respective product code is shown in the Supplementary data.
The membranes were then washed 4x with TBS buffer containing 0.05% Tween 20 (Sigma-Aldrich) and subsequently incubated for 1.5 h at room temperature with a horseradish peroxidase (HRP)-conjugated donkey anti-rabbit secondary antibody (ab16284, Abcam, UK) at a dilution of 1:2,000, in the same blocking solution as the primary antibody. After incubation with secondary antibody, membranes were washed again with TBS buffer containing 0.05% Tween 20. Protein bands were developed using a SuperSignal West Pico Chemiluminescent Substrate (Thermo Scientific) and visualised with a Bio-Rad gel imager using Image Lab software (Bio-Rad). The western blot assay was performed at least twice for each antibody.
Cytotoxicity testing using cell viability. MTT dye (Sigma) was dissolved in sterile PBS at a concentration of 5 mg/ml; For the MTT assay, single-cell suspensions (PEO1, PEO1CarboR and PEO1TaxR) were seeded into a 96-well plate at a density of 0.6×10⁴ per well. Cells were allowed to grow and attach under standard culture conditions for 24 h at 37°C with 5% CO2. The next day, serial dilutions of bortezomib (Selleck Chemicals, Houston, TX, USA) in medium were prepared and appropriate aliquots added to the wells. Cells were incubated with the drugs for 72 h. To evaluate cell viability, 20 μl MTT dye (5 mg/ml in PBS) was added to each well. After an incubation period of 4 h at 37°C, the medium was carefully aspirated from the wells and 200 μl dimethyl sulfoxide was added. The plates were then subjected to gentle agitation to suspend the formazan crystals and the purple colour was detected at 540 nm using a plate reading spectrophotometer (Labsystems Multiskan RC Plate Reader; Thermo Scientific). Dose-responses were created in GraphPad (La Jolla, CA, USA) and the half maximal-inhibitory concentration (IC50) values calculated by fitting with the 4-parameter model (Table II).
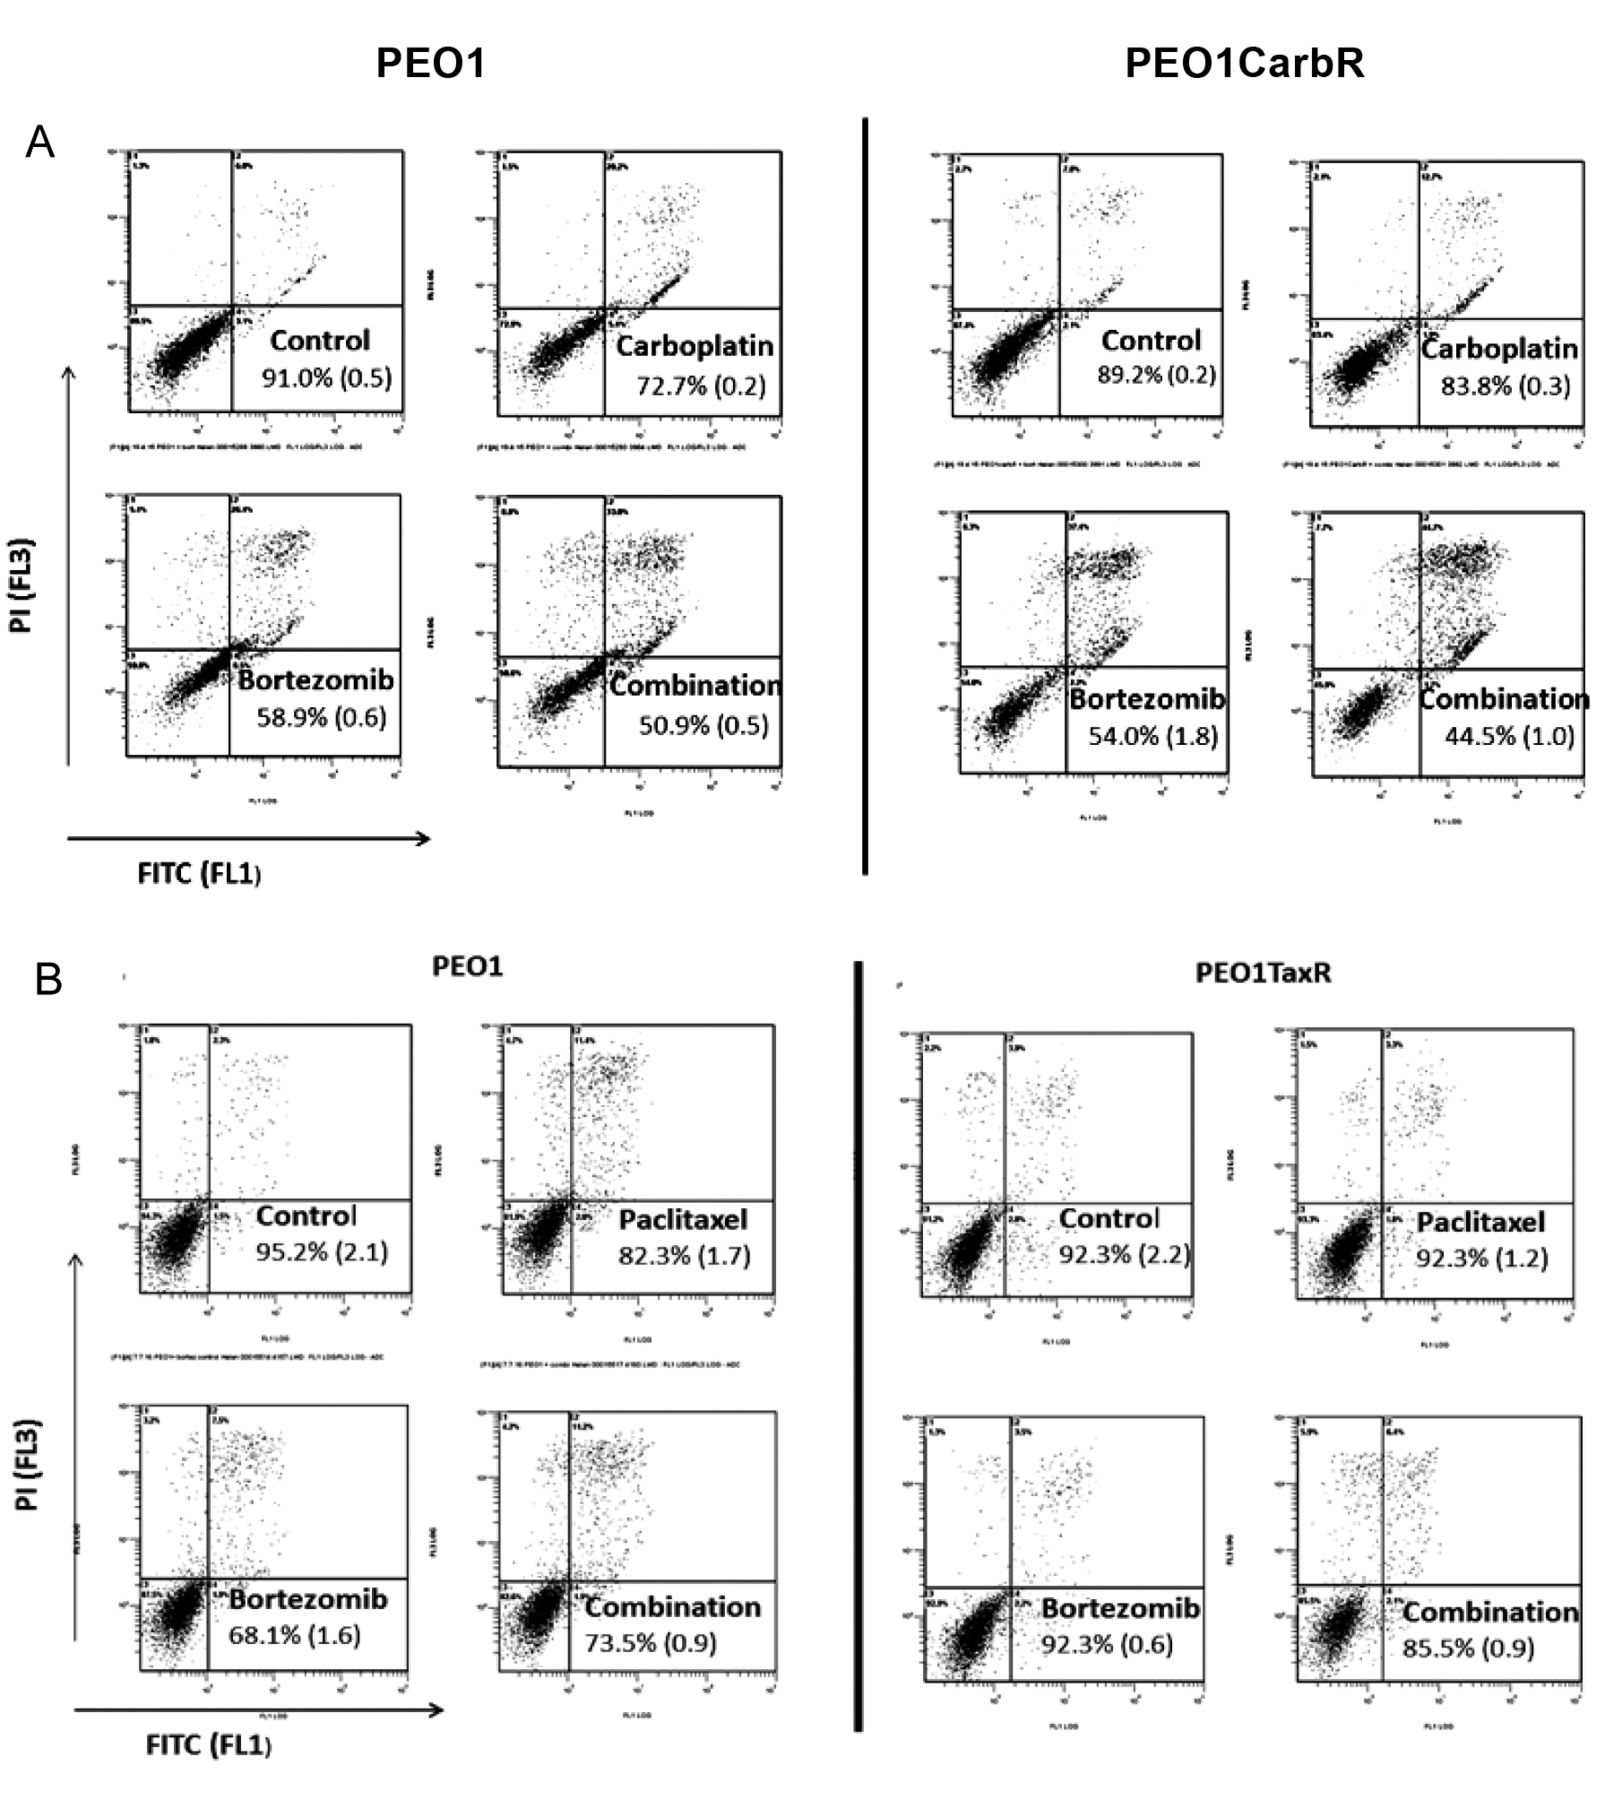
Assessment of apoptotic response following drug treatment. Ovarian cancer cells were seeded into 25 cm2 flasks at approximately 40% confluence. After attachment, the cells were then treated with carboplatin (5 μM), bortezomib (50 nM) singly and in combination for 48 h. Cells were then harvested (including the floating and attached populations combined in the drug-treated cells) and subjected to Annexin V assay combining with propidium iodide according to The manufacturer's instructions (CN Biosciences, Beeston, UK). Samples were then subjected to flow cytometry using FL1 for fluorescein Isothiocyanate (FITC)-conjugated annexin and FL3 for propidium iodide on a Coulter EPICS flow cytometer (Beckman Coulter, Brea, CA, USA). Each sample was assessed using collection of 10,000 events.
Results
Protein identification. Protein extract solutions from the PEO1 parental (drug-sensitive), PEO1TaxR, and PEO1CarbR cell lines were analyzed by 2D-GE (see Supplementary data) according to the procedure reported elsewhere (23) with some slight modifications. Duplicates had been run to confirm reproducibility. Two replicates were taken for protein analysis after reproducible gels had been obtained. One replicate was overstained deliberately in order to visualize spots of weakly expressed proteins; another replicate was slightly understained. Only those spots that were either exclusively present, or two-fold higher (assessed by PDQuest Advanced 8.0.1) were selected for excision and further analysis by LC-MS/MS (typically twice, see Supplementary data). In this research, a total of 189 proteins were identified using restricted criteria (Table III).
Target validation. Western blotting was used to validate protein targets of interest in ovarian cancer cell lines (Table IV). Six proteins from different pathways were investigated: glycolysis I and gluconeogenesis I pathways (PGAM1) (24), ubiquitin-conjugating enzyme E2 variant 2 (UB2V2) and UBE2K (ubiquitination pathway) (24), 14-3-3 protein (14-3-3 signalling pathway) and thioredoxin (THIO) [nuclear factor erythroid 2-related factor 2 (NRF2)-mediated oxidative stress response pathway] (24, 25).
Pathway analysis. Pathway analysis was performed with the Ingenuity Pathway Analysis (IPA) software and the fold regulation data (see Supplementary data). In IPA, relationships between molecules are represented by canonical pathways, which display the molecules of interest within well-established signalling or metabolic pathways. Each relationship between molecules was created using scientific information contained in the Ingenuity Knowledge Base and molecules of interest are related to known biological functions and disease states (26).
Preliminary observations indicated that the main pathways were common to both quantification approaches used for the analysis. The top 10 influenced pathways were Glycolysis I, Gluconeogenesis I, Protein Ubiquitination Pathway, Remodelling of Epithelial Adherens Junctions (important in the epithelial–mesenchymal transition pathway and cell adhesion), 14-3-3-Mediated Signalling, NRF2-mediated Oxidative Stress Response, Aspartate Degradation II, Aldosterone Signalling in Epithelial Cells, TCA Cycle II (Eukaryotic) and Guanine and Guanosine Salvage I (Figure 1).
Investigation of pathway-targeted combined treatment of the protein ubiquitination pathway. Assessment of bortezomib sensitivity in human ovarian cancer cell lines: As shown in Table II, the bortezomib sensitivity of the panel of cell lines used in this study varied significantly, indicated by the IC50 values obtained.This part of the study was designed to guide us as to the dose of bortezomib to use in the apoptosis experiments. Clearly, the carboplatin-resistant and paclitaxel-resistant variants of PEO1 appeared to be relatively resistant to bortezomib, particularly the PEO1TaxR subline.
Combinations of bortezomib with either paclitaxel or carboplatin show synergistic effects in drug-resistant ovarian cancer cells. Figure 2 shows the effect of carboplatin, and paclitaxel in combination with bortezomib in sensitive and resistant PEO1 cell lines. The extent of apoptosis seen for carboplatin treatment alone was as expected, with the parental (drug-sensitive) cell line exhibiting significantly more apoptosis than that seen for the carboplatin-resistant line (p=0.0001, Figure 2A). However, the extent of apoptosis seen for PEO1 and PEO1CarbR treated with bortezomib was not significantly different at the 48 h time window used in these experiments. The most important finding of these experiments was the extent of apoptosis seen for the drug-resistant PEO1CarbR cells treated with the drug combination, which exceeded that seen for the PEO1 parental line. If the apoptotic effects of the individual drugs (bortezomib and carboplatin) were added and then compared with the same for the combination treatment (i.e. simultaneous drug treatment) then a paired t-test analysis gave a highly significant p-value (0.006).
In addition, we can see the relative resistance of the PEO1TaxR cells to both paclitaxel and to bortezomib, at the doses used (Figure 2B). However, the effect of the combination treatment on the PEO1TaxR cells was significant (p<0.005) compared to the effect seen for the parental PEO1 cells (p>0.5), (taking into account the effects of the individual drug treatment on the apoptotic readout).
Analysis of clinical biopsies of ovarian cancer for protein markers of disease status. We carried out a limited pilot study comprising of five clinical biopsies of human ovarian tissue (SOV-1/2/3/4/5, Table I). These tissue samples were analyzed by 2D-GE (See Supplementary data) and spots were selected (See Supplementary data) according to the following criteria: i) exclusive presence in only one gel, ii) 2-fold and iii) 5-fold change in intensity. Spots were cut and analysed by MS and identifications were obtained using the same restricted criteria (Table III).The results confirmed that a number un-regulated proteins in the clinical samples were involved in the glycolysis I and gluconeogenesis I pathways, validating previous reports describing chemoresistant cancer with elevated aerobic glycolysis (27).
Proteins identified in the ovarian cancer cell lines (sensitive: PEO1 and resistant: PEO1TaxR, PEO1CarbR) and/or in the ovarian tissue biopsies (control –: SOV-1 and cancer: SOV-2/3/4/5). Proteins shown (n=189) were identified by liquid chromatography-tandem mass spectrometry after in-gel trypsin digestion of the selected protein spots. Criteria used for protein hit selection were Min Peptide – 95 %, Min # Peptides – 2, Min Protein – 99 % (Scaffold 3 Software, version 3.6.4). SSP, Sample spot protein number; MW, molecular weight; pI, isoelectric point; N/A, not applicable; R, resistant; S, sensitive; P, partially resistant/sensitive.
Discussion
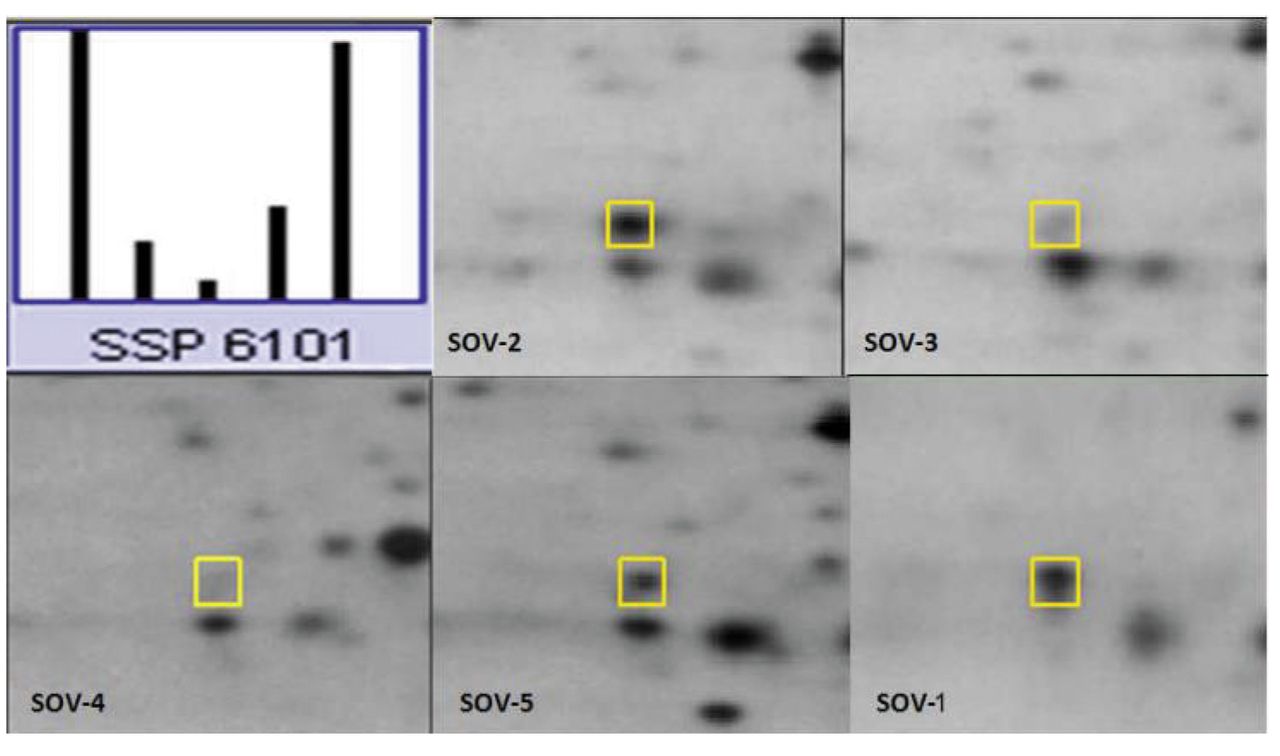
2D-GE proteomics. One of the advantages of using 2D-GE is that the proteins and their charged isoforms can be compared directly. The spot selection process using PDQuest Advanced software is illustrated using representative examples (Figure 3). The histograms allow for rapid comparison of spot intensity among gels. They are also useful as tools for detecting problems such as mismatched spots and spots whose quantification is suspiciously far from average.
Restricted criteria for protein identification. Depending on instruments used, different criteria are used in MASCOT searches. In this project, we used restricted criteria in order to increase the confidence of identification instead of breadth of identification. Two online search engines, MASCOT (Matrix Science) (28) and X!Tandem (The GPM) (29) were used. In order to minimize the chances of false-positive identification of contaminant proteins, protein hits were accepted if the MASCOT protein score exceeded 100 and at least one of the theoretical MW and pI values matched the experimental value. Experimental MW and pI were estimated based on relative positions to MW markers and corresponding vertical alignment to pH values on 2D gels; or, 20 <MASCOT protein score <100 and theoretical MW and pI values were both similar to the experimental values; or, 20 <MASCOT protein score <100 and at least one of the theoretical MW and pI values was similar to the experimental values and first hits in the MASCOT search result corresponded to the same first hits in the X!Tandem search results or the protein identified belonged to the same family (isoforms). Keratin and trypsin were removed from the hit list of each spot (30). Searches and analysis were performed using Scaffold 3 (Proteome Software), and the criteria used for protein hit selection was: Min Peptide – 95%, Min # Peptides – 2, Min Protein – 99% and 1% false discovery rate (31, 32). This search method resulted in a list of 189 proteins reliably identified. Among these 189 proteins, 20 were expressed in sensitive PEO1 cells, 79 in the drug-resistant variants and 90 were common to all cell lines (See Supplementary data).
Western blot. Overall, western blot results confirmed the results obtained by MS and 2D-GE spot intensity measurements in terms of the presence and expression of the selected proteins.
In the western blot results, PGAM1 appeared to be up-regulated in both drug-resistant ovarian cancer cell lines, confirming the previous MS/spot intensity results. The blot probed with anti-UBE2K presented two sets of bands (Table IV) and agreed with proteomics study that indicated an absence of this protein from PEO1CarbR cells. The antibody to 14-3-3 used was able to recognise all 14-3-3 protein isoforms, 14-3-3β, 14-3-3T and 14-3-3ζ, and thus, the western blotting results fit with the MS result well. Finally, the presence and fold regulation of THIO was also confirmed by the western blot results.
Quantification and pathway analysis. As shown above, occasionally the same protein can be identified in multiple spots due to post-translational modifications (see Supplementary data). In order to avoid errors in the interpretation of spot intensity data, which would influence the analysis of differences in protein expression between distinct samples, spot intensity was studied using two alternative approaches. Firstly, ‘consider the spot position’: only spots located in equivalent positions on different gels in which a certain protein was identified were used for quantitative purposes. In principle, spots located in the same place on different gels, when comparing similar proteomic samples, may correspond to the same protein and are given the same SSP number. In this case, only spots with the same SSP number were compared between samples.
Secondly, “ignoring the spot position” on the gel: all spots on one gel in which a certain protein was identified were considered for quantification purposes. In this case, the total presence of a protein in a gel or sample was considered as a sum of the intensities of all the spots in which this protein was identified. The total intensity values were then compared between samples.
It is noteworthy that 4 out of 63 sensitive exclusive protein differences in PEO1CarbR and two out of 33 in PEO1TaxR; while three out of 58 and three out of 40 in resistant exclusive proteins, respectively (See Supplementary data). We decided to use the data “ignore spot position” for pathway analysis, although both data sets generate the same top 10 pathway hits (See Supplementary data).
However, the expression of most proteins was different; the number of up-regulated, down-regulated and unchanged proteins in each canonical pathway was distinct between the two datasets (see Supplementary data). Figure 1 shows the pathways identified in PEO1TaxR (Figure 1 top) and PEO1CarbR (Figure 1 bottom) cell lines. In general, the pathways that differ are very similar in these two cell lines but the nature of those changes differs. The Warburg effect (which includes glycolysis, gluconeogenesis and trichloroacetic acid cycle) was found to be up-regulated in both resistant cell lines, as reported before (33). It is interesting to note that there were significant changes in nucleotide and amino acid metabolic pathways (Figure 1), in which PEO1TaxR showed the most down-regulation and PEO1CarbR showed some to be up-regulated. It emerged that phosphoinositide 3-kinase/ protein kinase B (PI3K/AKT), extracellular signal-regulated kinases (ERK), hypoxia-inducible factor 1-alpha (HIFα), endoplasmic reticulum stress, endothelin-1 (ET1), α-adrenergic signalling (ADRα) and NRF2 etc. were the key pathways changed for these two drug-resistant cell lines: PEO1TaxR showed relative up-regulation, whilst PEO1CarbR showed down-regulation of these.

Pathway analysis result in of PEO1TaxR (top) and PEO1CarbR (bottom) cell lines. Red: Up-regulated proteins; Green: down-regulated proteins.
Targeting the proteasome. As part of the validation process of the proteomics study in the PEO1 cell line panel, we examined more closely a pathway that had been highlighted as dysregulated in drug-resistant versus drug-sensitive cells. There is considerable evidence to suggest that targeting the proteasome is an effective approach to killing tumour cells whilst sparing healthy cells. This can be attributed to the up-regulation of proteasomal activity by intracellular oncogenic factors in tumour tissues, which not only means that cancer cells are more dependent on proteasomes than healthy cells, but also that they can be more easily targeted. Proteasomes are involved in the degradation of tumour-suppressor proteins, hence the increased proteasome activity in tumour cells results in more degradation of suppressors, thus leading to cancer cell survival and proliferation (34).
Whilst there are several classes of proteasome inhibitors that target various different points in the ubiquitin-proteasomal-pathway, bortezomib, a reversible peptide boronic acid inhibitor, which inhibits proteasomal chymotrypsin-like activity by forming a complex between the N-terminal threonine and the boronic acid pharmacore, has been investigated extensively (35, 36). Bortezomib was developed for clinical trials based on its potency against a potentially wide range of human cancer types, and has been shown to be very effective against multiple myeloma and non-Hodgkin lymphoma.

Flow cytometric data obtained using the annexinV fluorescein isothiocyanate method in combination with propidium iodide (PI). PEO1, PEO1CarboR and PEO1TaxR cells were treated with bortezomib (50 nM) and carboplatin (5 μM) (A) or paclitaxel (B) at 6 nM, either singly or in combination for 48 h and then harvested for flow cytometric analysis. Numbers shown indicate the remaining live cell population (bottom left hand quadrant), shown as a percentage with the standard deviation shown in parentheses. All experiments were performed in triplicate, with the cytograms of a typical data set shown.
A previous report detailed the effects of bortezomib against human ovarian cancer cell lines, with IC50 values ranging between 1.5 and 30 nM (37). Considering the paclitaxel-resistant cell line PEO1TaxR in the present study, we found a relatively high IC50 value forbortezomib (Table II). There is evidence that this could be, in part, due to the high levels of expression of P-gp present in PEO1TaxR cells. This is based on a recent study which indicated that bortezomib is a substrate for P-gp activity (38). In 2008, a clinical trial was carried out on patients with taxane and platinum-refractory EOC using a combination of carboplatin plus increasing concentrations of bortezomib. The results from this trial suggested an optimum dose of bortezomib recommended for administration in combination with carboplatin which was associated with disease stabilisation in some patients (39).

Examples of 2D-gel and spot selection using PDQuest Advanced 8.0.1. Yellow squares indicate proteins of interest. Histogram at upper left shows the relative quantity for the corresponding spot in each of the different gels, SOV-2/3/4/5/1 (bars from left to right).
Al-Eisawi et al. showed that bortezomib prevented the degradation of the copper transporter 1, essential for cellular uptake of platinum (40). This effect was associated with enhanced accumulation of platinum, DNA adduct formation and oxidative stress in a panel of drug-resistant ovarian cancer cell lines, lending support to our findings. Recently, Steg et al. (37) showed that proteasome inhibition reduced expression of hedgehog target genes [protein patched homolog 1 (PTCH1), zinc finger protein (GLI1 and GLI2] in ovarian cancer cells. The authors also showed that bortezomib treatment increased paclitaxel sensitivity through apoptosis and G2M blockade. Expression of the multidrug-resistance gene ATP-binding cassette sub-family B member 1 (ABCB1) decreased, whilst the acetylation of α-tubulin, a marker of microtubule stabilization, increased following bortezomib treatment (38). These results suggest that proteasome inhibition, through a combination of altered microtubule dynamics and hedgehog signaling, may circumvent taxane resistance. Like many targeted therapies, bortezomib has reported ‘off-target’ effects. The eukaryotic initiation factor 4A-1 (EIF4E1) has been shown to be targeted by bortezomib in haematological malignancies, giving rise to G2M blockade (41). Table III from our proteomics study indicates that PEO1CarbR cells expressed the highest level of this protein, which may go some way to explaining the preferential sensitisation effect we saw in this cell line (Figure 2). Moreover, the same study demonstrated synergy between chemotherapy and bortezomib, lending support to our findings (41).
The data obtained in the present study support the use of bortezomib in combination with chemotherapy for the management of heavily pretreated EOC.
Protein expression patterns in clinical samples of ovarian tissues. Proteins indicated in bold in Table V have been confirmed for the first time in both cell lines and biopsy samples. The agreement in the proteomics readout in both cell lines and human tumour biopsies supports the use of cell line models as a realistic discovery platform that extrapolates to the clinical scenario. The data obtained in this part of the study have increased our knowledge of molecular mechanisms of development of chemoresistance in ovarian cancer, in spite of the technical difficulties encountered in the approaches used.
Many of the proteins identified from patients with drug-resistant EOC were up-regulated (Table V). Some of them [60 kDa heat-shock protein (CH60), ENOA, cathepsin D (CATD), EFTU, G3P and GRP75] were confirmed by a quantitative proteomic analysis using an iTRAQ approach (42). Interestingly, APOA1 and PRDX2 have also been found lobe up-regulated in ovarian cyst fluid of patients diagnosed with advanced serous ovarian adenocarcinoma (43). Additionally, studies conducted in Taxol- and platinum-resistant ovarian cancer cell lines have reported CH60, ENOA, ANXA2, CATD, heterogeneous nuclear ribonucleoprotein K (HNRPK) and heterogeneous nuclear ribonucleoproteins A2/B1 (ROA2) to be up-regulated in resistant cells when compared to their sensitive counterparts (24, 25, 44). Annexins A1 and A2 have been described as major substrates for the tyrosine phosphorylation carried out by the epidermal growth factor receptor (EGFR) (45). Moreover, we previously published the finding of up-regulation of EGFR in our drug-resistant PEO1 cell lines (19), which lends further support to our findings. The role of annexins in cancer development is somewhat controversial but annexin A1 is associated with a drive in cellular proliferation and has been reported to be strongly up-regulated in a number of cancer cell lines (46). These studies further support the claim that some of the dysregulated proteins identified in the clinical samples (SOV-2, SOV-4, SOV-5) could be potential markers of drug resistance.
Results of target validation through western blotting (WB) assay. Ovarian cancer cell line proteins (20 μg per well from PEO1, PEO1TaxR and PEO1CarbR) were separated by SDS-PAGE using precast gels and transferred onto nitrocellulose membranes. Membranes were blocked, probed with primary and secondary antibodies and developed using a chemiluminescent substrate.
Candidate biomarkers of drug-resistant ovarian cancer. Taking advantage of the availability of a non-cancerous (control) tissue sample amongst the biopsies analyzed in this study, we were able to then compare the proteomics readout of cancer versus non-cancer tissues, albeit it to a limited extent. In our analysis, only those proteins that were similarly different in expression for the four ovarian cancer tissues were considered potential biomarkers of disease status e.g. treatment response.
Nine proteins in total were found to be similarly increased in expression amongst the cancerous biopsies versus non-cancerous tissue. Out of these nine proteins, expression of alpha-1-antichymotrypsin (AACT), fatty acid-binding protein, epidermal (FABP5), galectin-7 (LEG7), haemoglobin subunit beta (HBB), Ig gamma-1 chain C region (IGHG1) and serpin B3 (SPB3) were reduced, whilst EF1A1 and G3P, were increased in expression. In support of our findings, Wang and co-workers reported EF1A1 and G3P to be up-regulated in a quantitative proteome analysis of ovarian cancer tissues, while HBB was down-regulated (42).
Other studies have been carried out with the aim of discovering novel biomarkers for the diagnosis of ovarian cancer using serum. Several biomarkers have been suggested, including haptoglobin and transferrin (47), kallikrein 10 (48), osteopontin (49), apolipoprotein A1 (glycoprotein) (50), truncated form of transthyretin and cleavage fragment of inter-α-trypsin inhibitor heavy chain H4 (51). Those particular studies used large numbers of clinical samples from patients with EOC and from normal healthy individuals for discovery of biomarkers for disease detection, in contrast to our current study, which considered biomarkers of prognostic value (i.e. for use in disease monitoring/management as opposed to diagnosis).
Proteins associated with chemoresistance in ovarian cancer. Dysregulated proteins identified in the ovarian cancer cell line-resistant samples (PEO1TaxR and PEO1CarbR) that were also found up-regulated in the clinically drug-resistant (SOV-2 and SOV-3) and partially-resistant (SOV-4 and SOV-5) biopsies. Proteins in bold were confirmed in both cell lines and biopsies. Brackets indicate agreement with only one cell line.
In conclusion, we set-up a confident 2D-gel proteomics method to correlate protein identification in ovarian cell lines along with clinical biopsies. Proteins and pathways indicated potential biomarkers of drug-resistant disease. Three ovarian cancer lines were successfully analyzed allowing paclitaxel and carboplatin resistance-associated proteins to be identified by MS. Restricted criteria were applied in order to increase confidence rather than the breadth of identification. The expression differences of a total 189 identified proteins were used in the IPA. This then informed our approach to using combined treatment targeting proteasome pathway with bortezomib to achieve a re-sensitisation of drug-resistant ovarian cancer cells. In addition, five surgical biopsies of ovarian tissues with a range of pathologies were also analyzed and expressions compared to those identified in cell lines. The identified proteins, CH60, ENOA, EFTU, G3P, GRP75, APOA1, PRDX2 and ANXA, may potentially be biomarkers.
Acknowledgements
The Authors thank Fundação para a Ciência e a Tecnologia, Lisbon, Portugal for the financial support.
Footnotes
↵* These Authors contributed equally to this study.
This article is freely accessible online.
Associated Content
Supporting information. Gel images, pathway analysis results can be found in the supporting information.
All supplementary data are online available at https://www.ucl.ac.uk/pharmacy/people/academic-research-staff-profiles/min-yang/ovarian-cancer-report.pdf.
Conflicts of Interest
The Authors declare no competing financial interest.
- Received September 13, 2016.
- Revision received October 16, 2016.
- Accepted October 20, 2016.
- Copyright© 2017, International Institute of Anticancer Research (Dr. George J. Delinasios), All rights reserved
References
In this issue


Jump to section
Related Articles
Cited By...
- Caspr2 interacts with type 1 inositol 1,4,5-trisphosphate receptor in the developing cerebellum and regulates Purkinje cell morphology
- The Influence of the Preoperative Status on the Risk of Postoperative Complications After Cytoreductive Surgery for Advanced-stage Ovarian Cancer
- The prognostic values of the peroxiredoxins family in ovarian cancer
- Anticancer Activity of Artemisinin and its Derivatives
- Relationship Between Structure and Antiproliferative Activity of Novel 5-amino-4-cyanopyrazole-1-formaldehydehydrazono Derivatives on HL-60RG Human Leukemia Cells
- Changes in the Expression of Various Transporters as Influencing Factors of Resistance to Cisplatin