
The MTT Assay: Utility, Limitations, Pitfalls, and Interpretation in Bulk and Single-Cell Analysis


Abstract
:1. Introduction
2. Results and Discussion
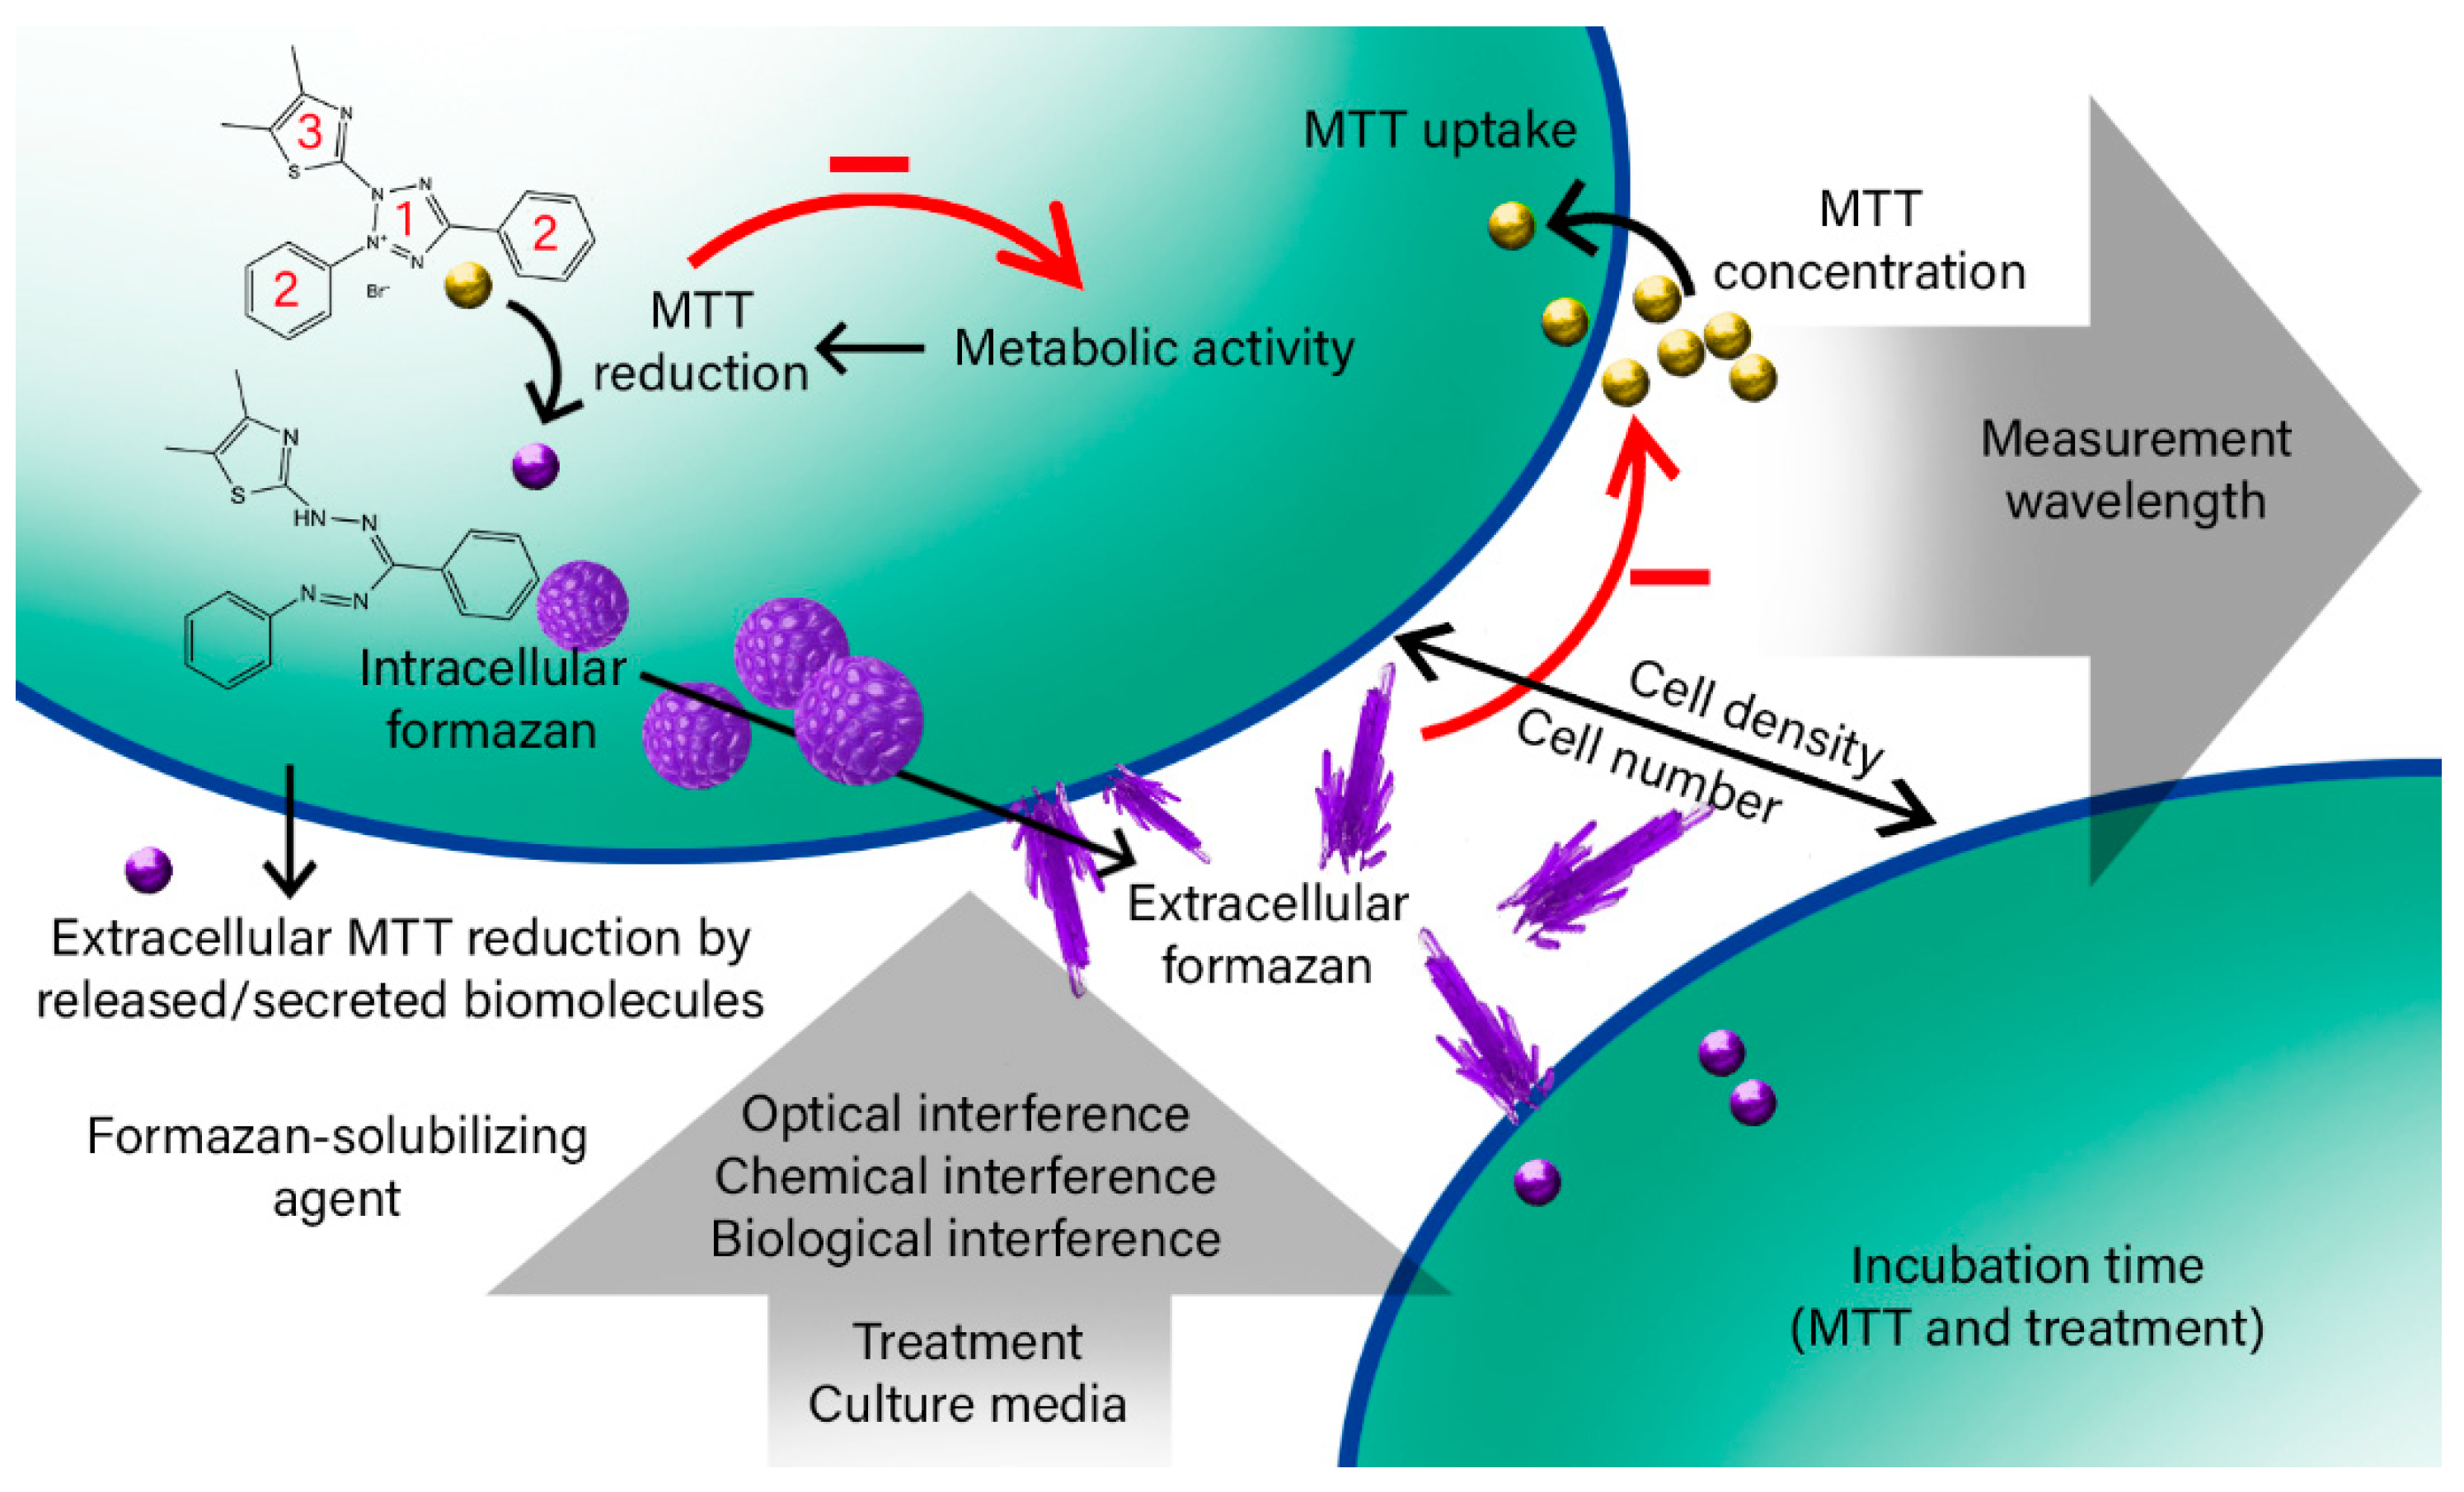
2.1. The Effective Factors on the Bulk MTT Assay Measurements
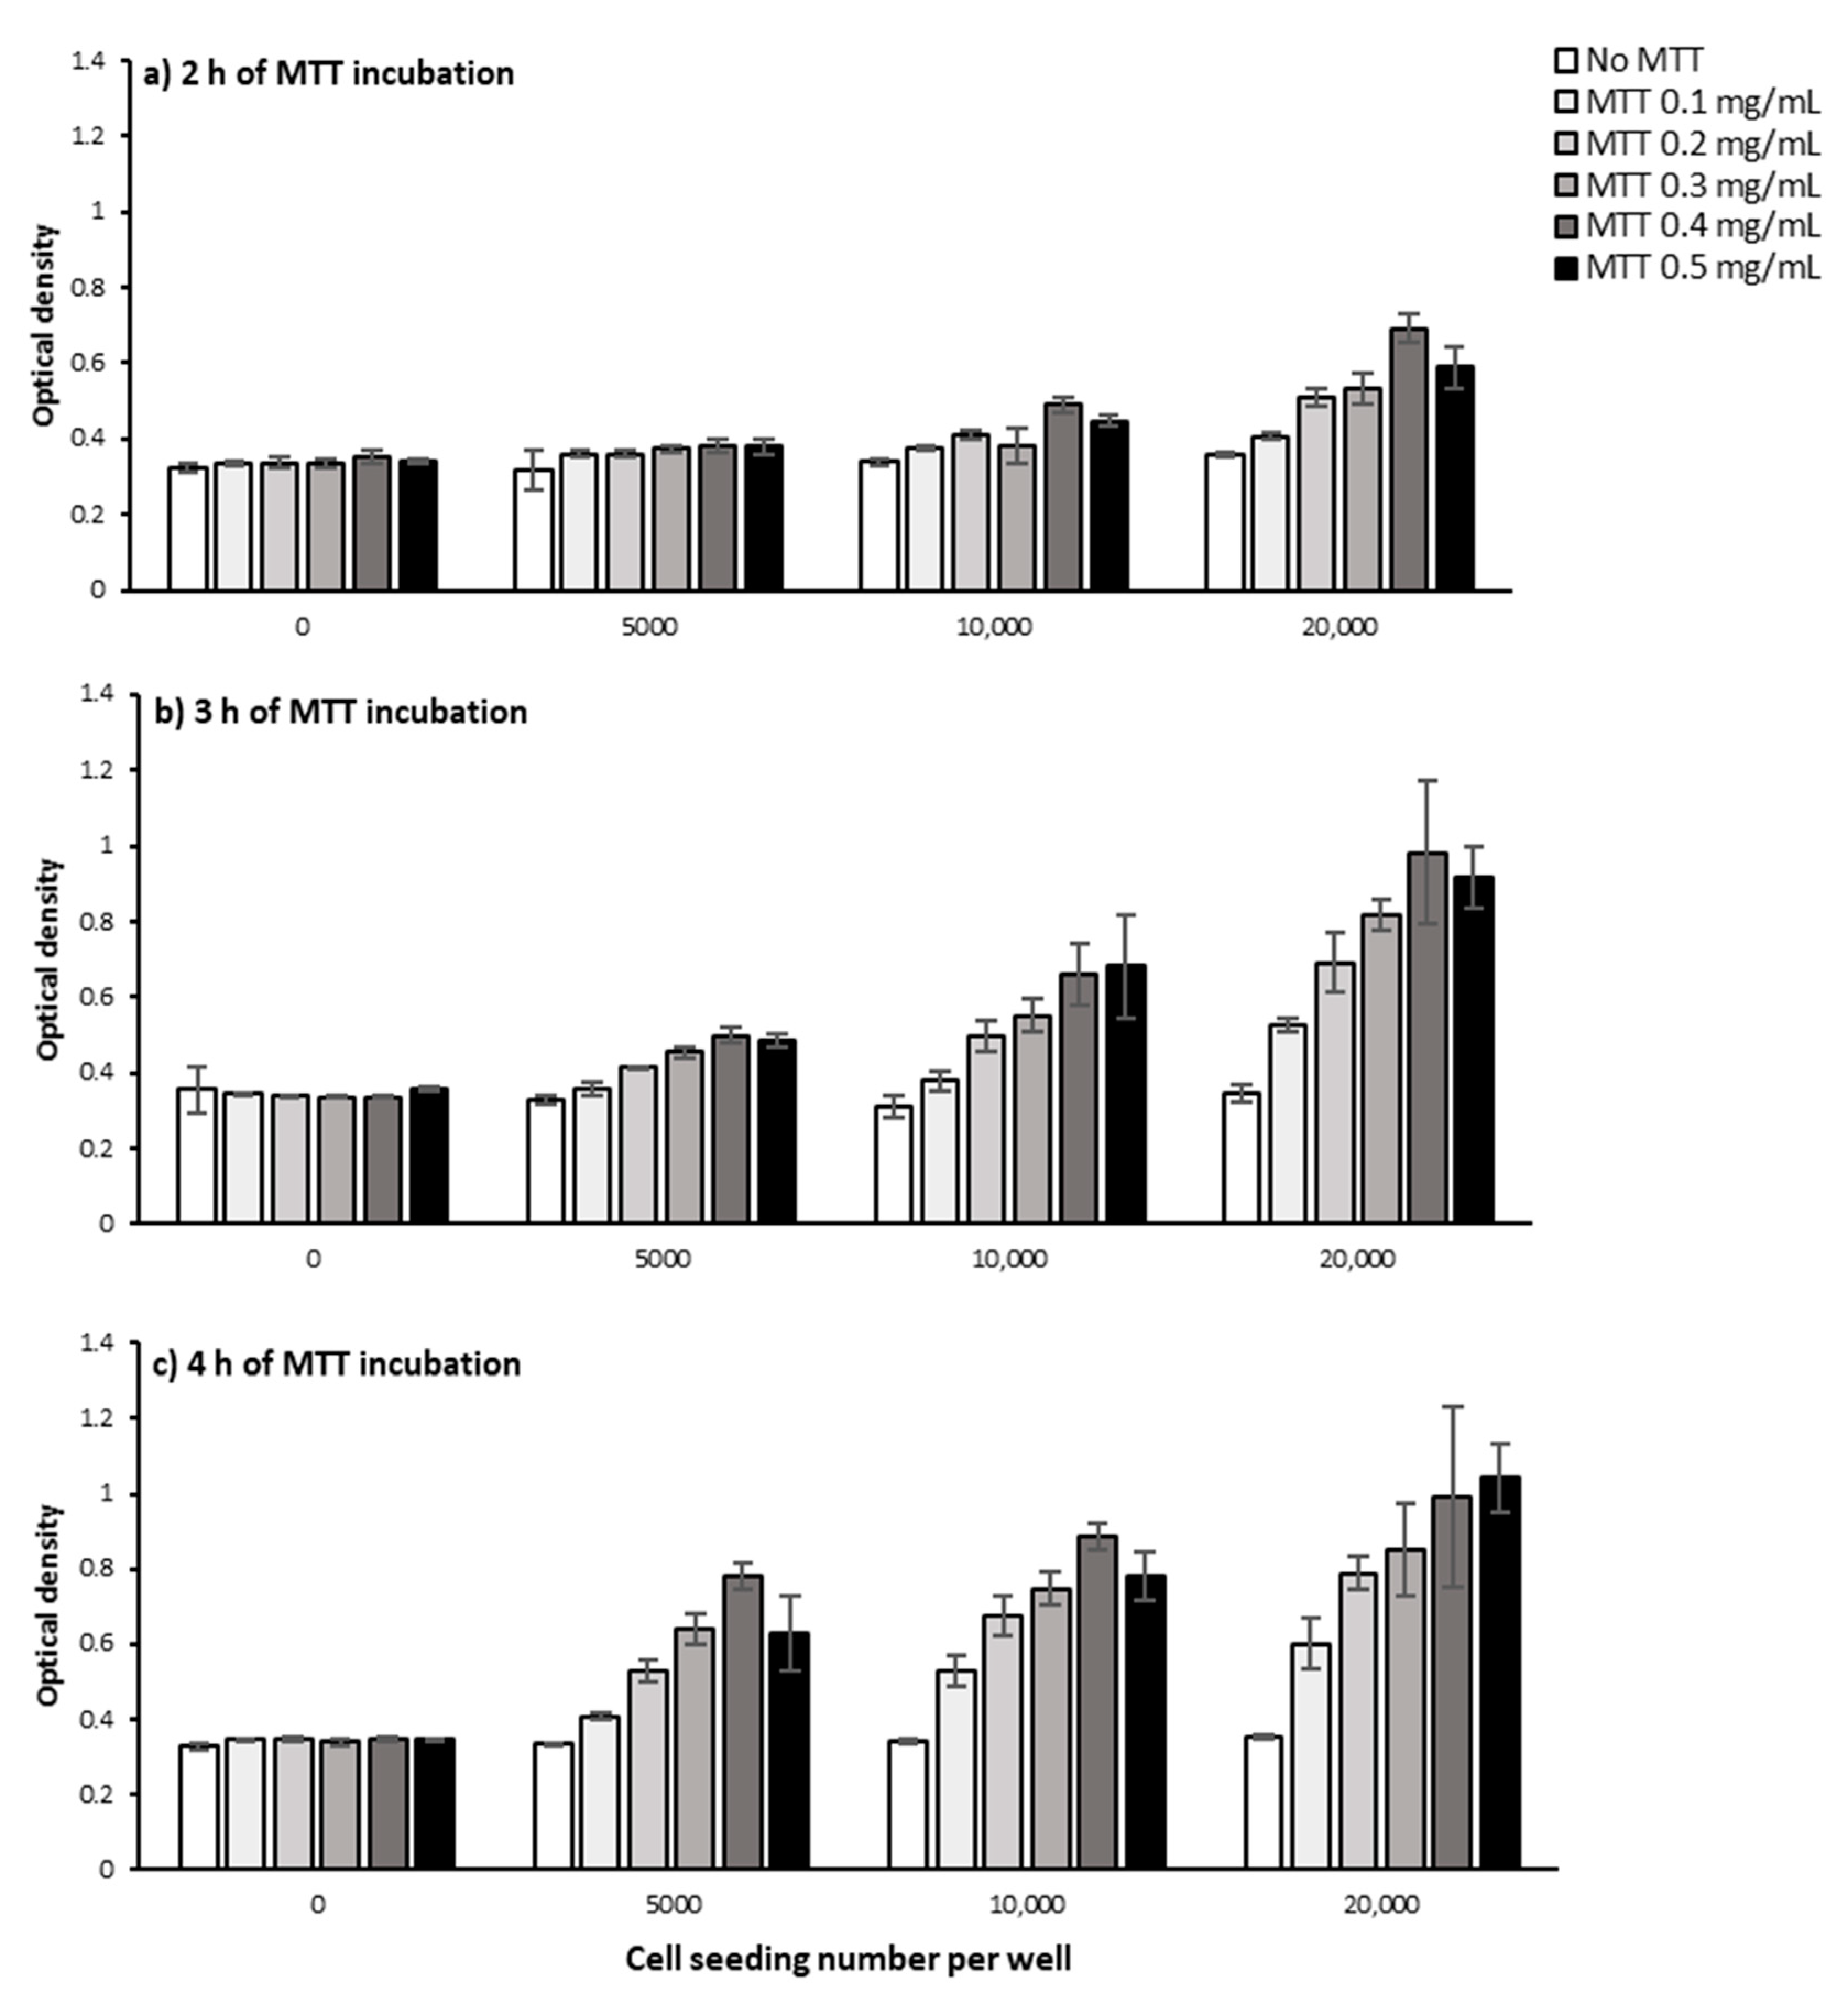
2.1.1. Cell Number and Density
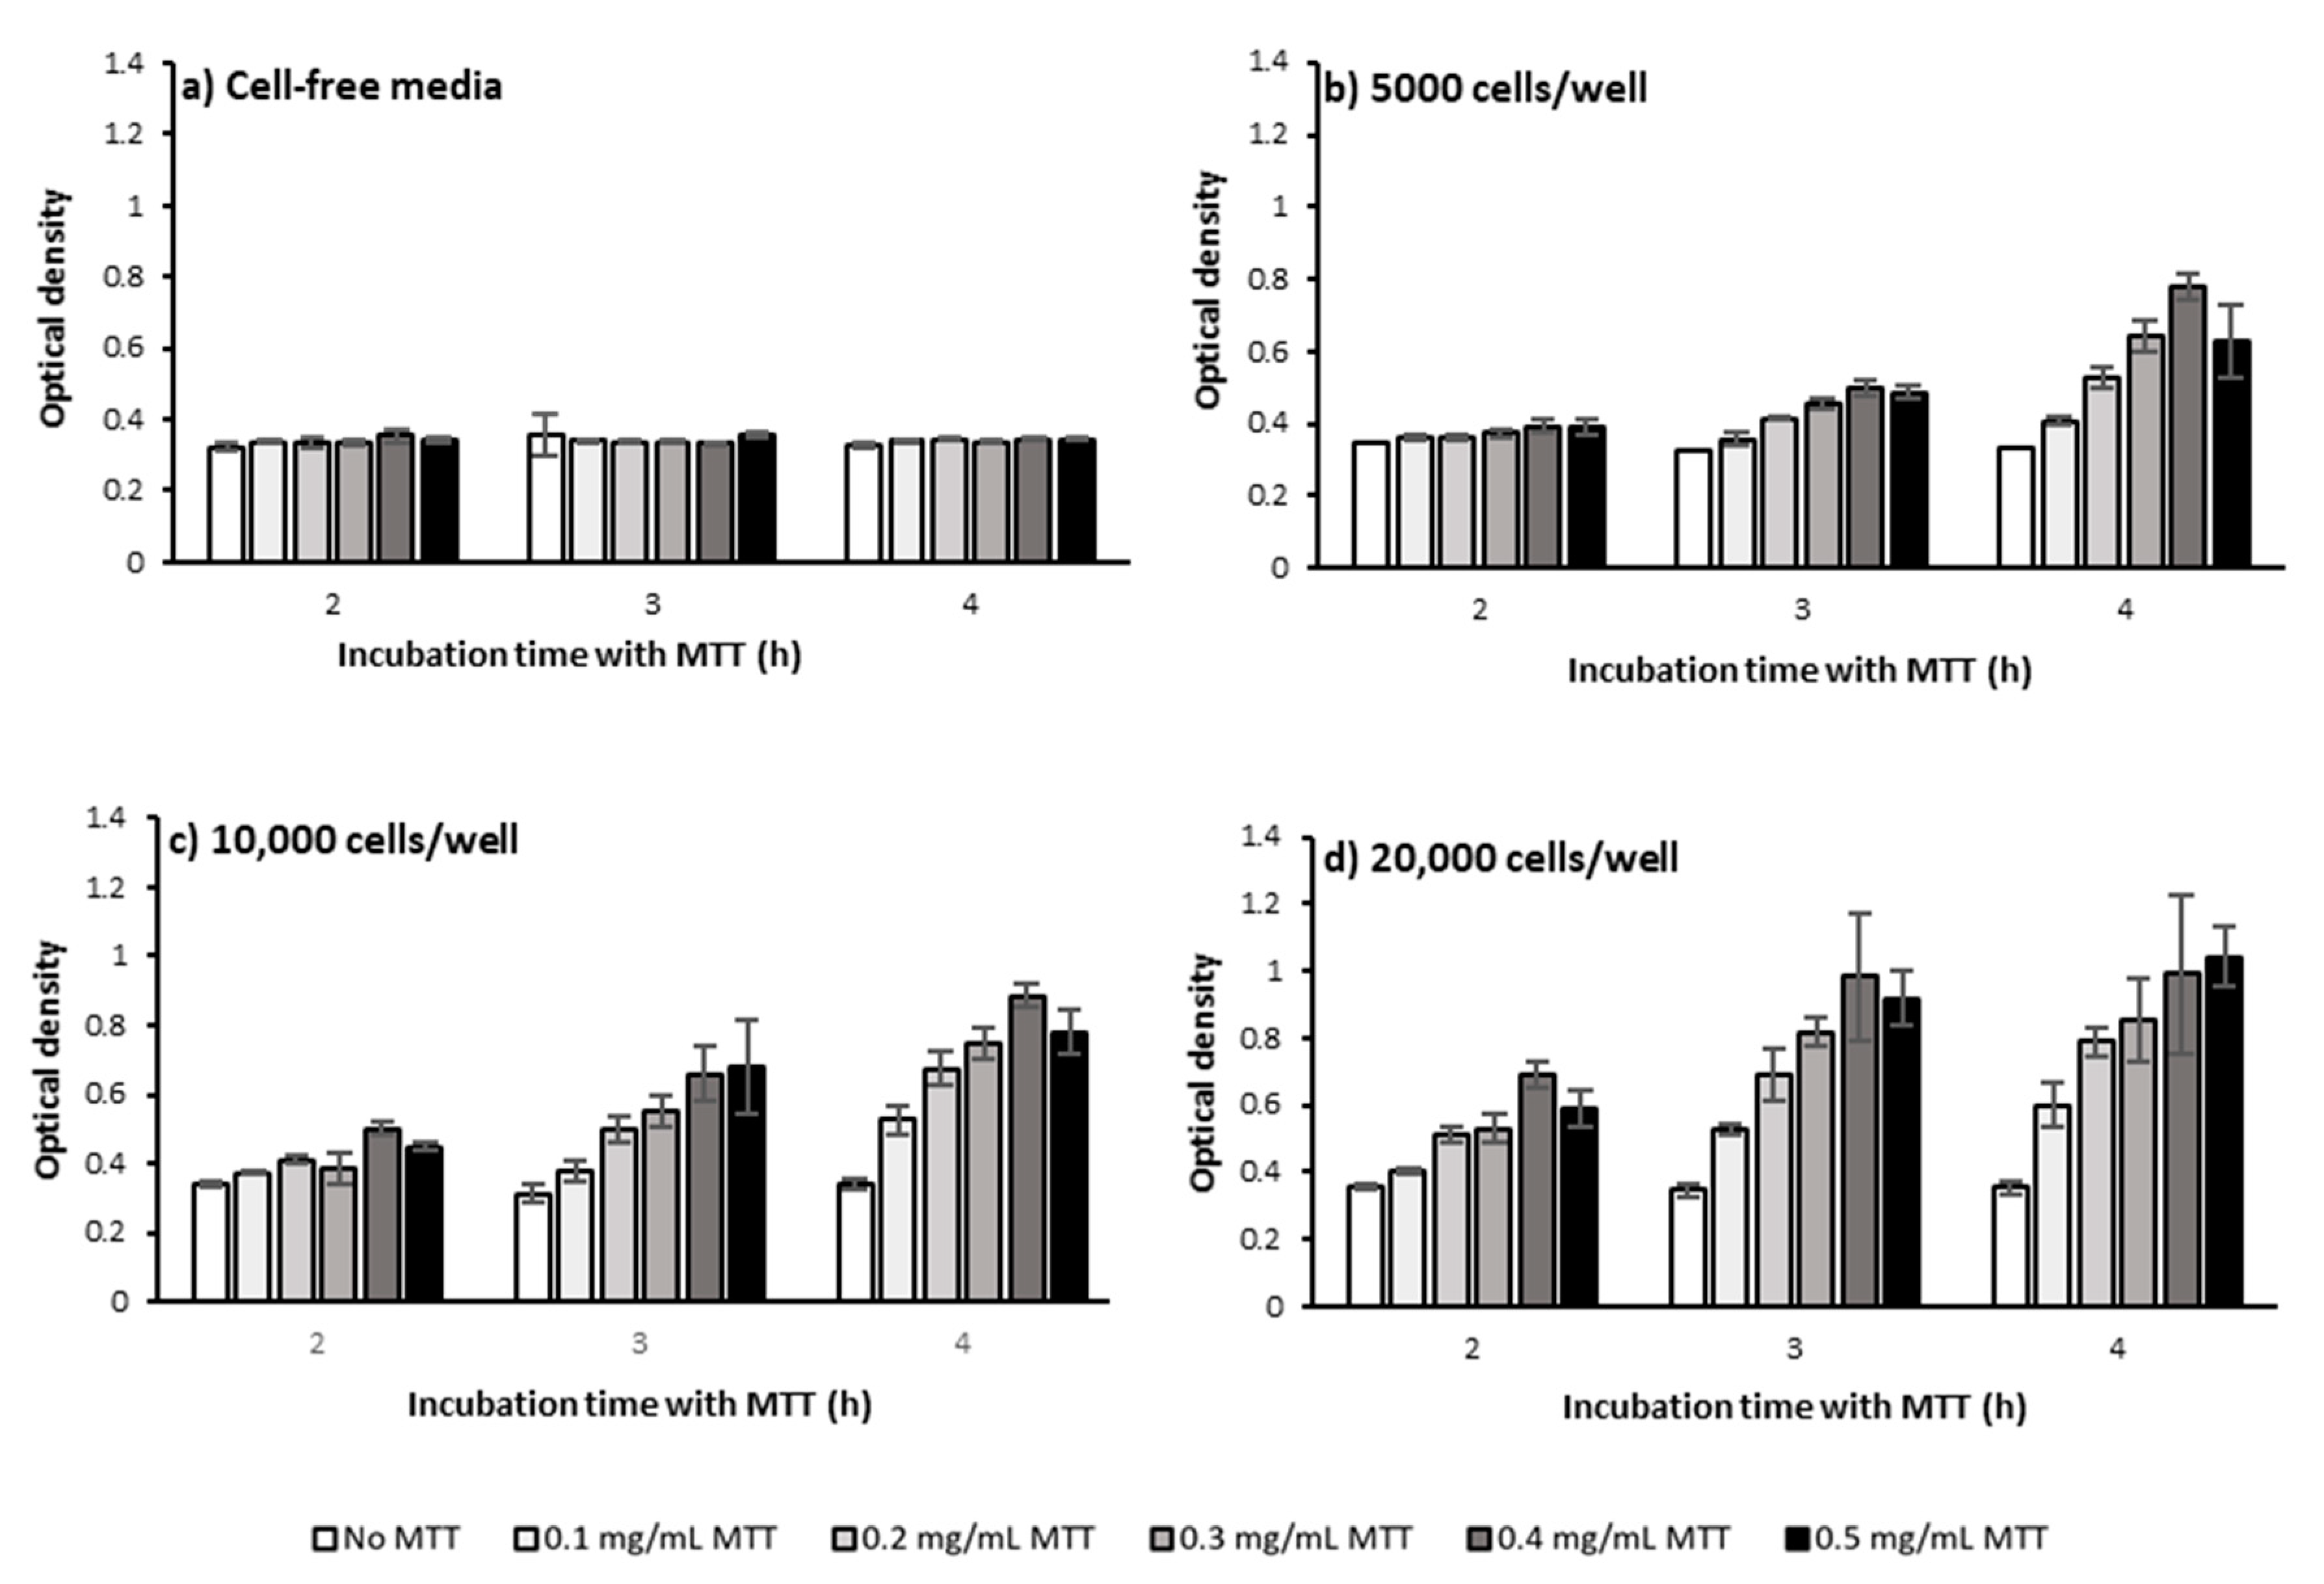
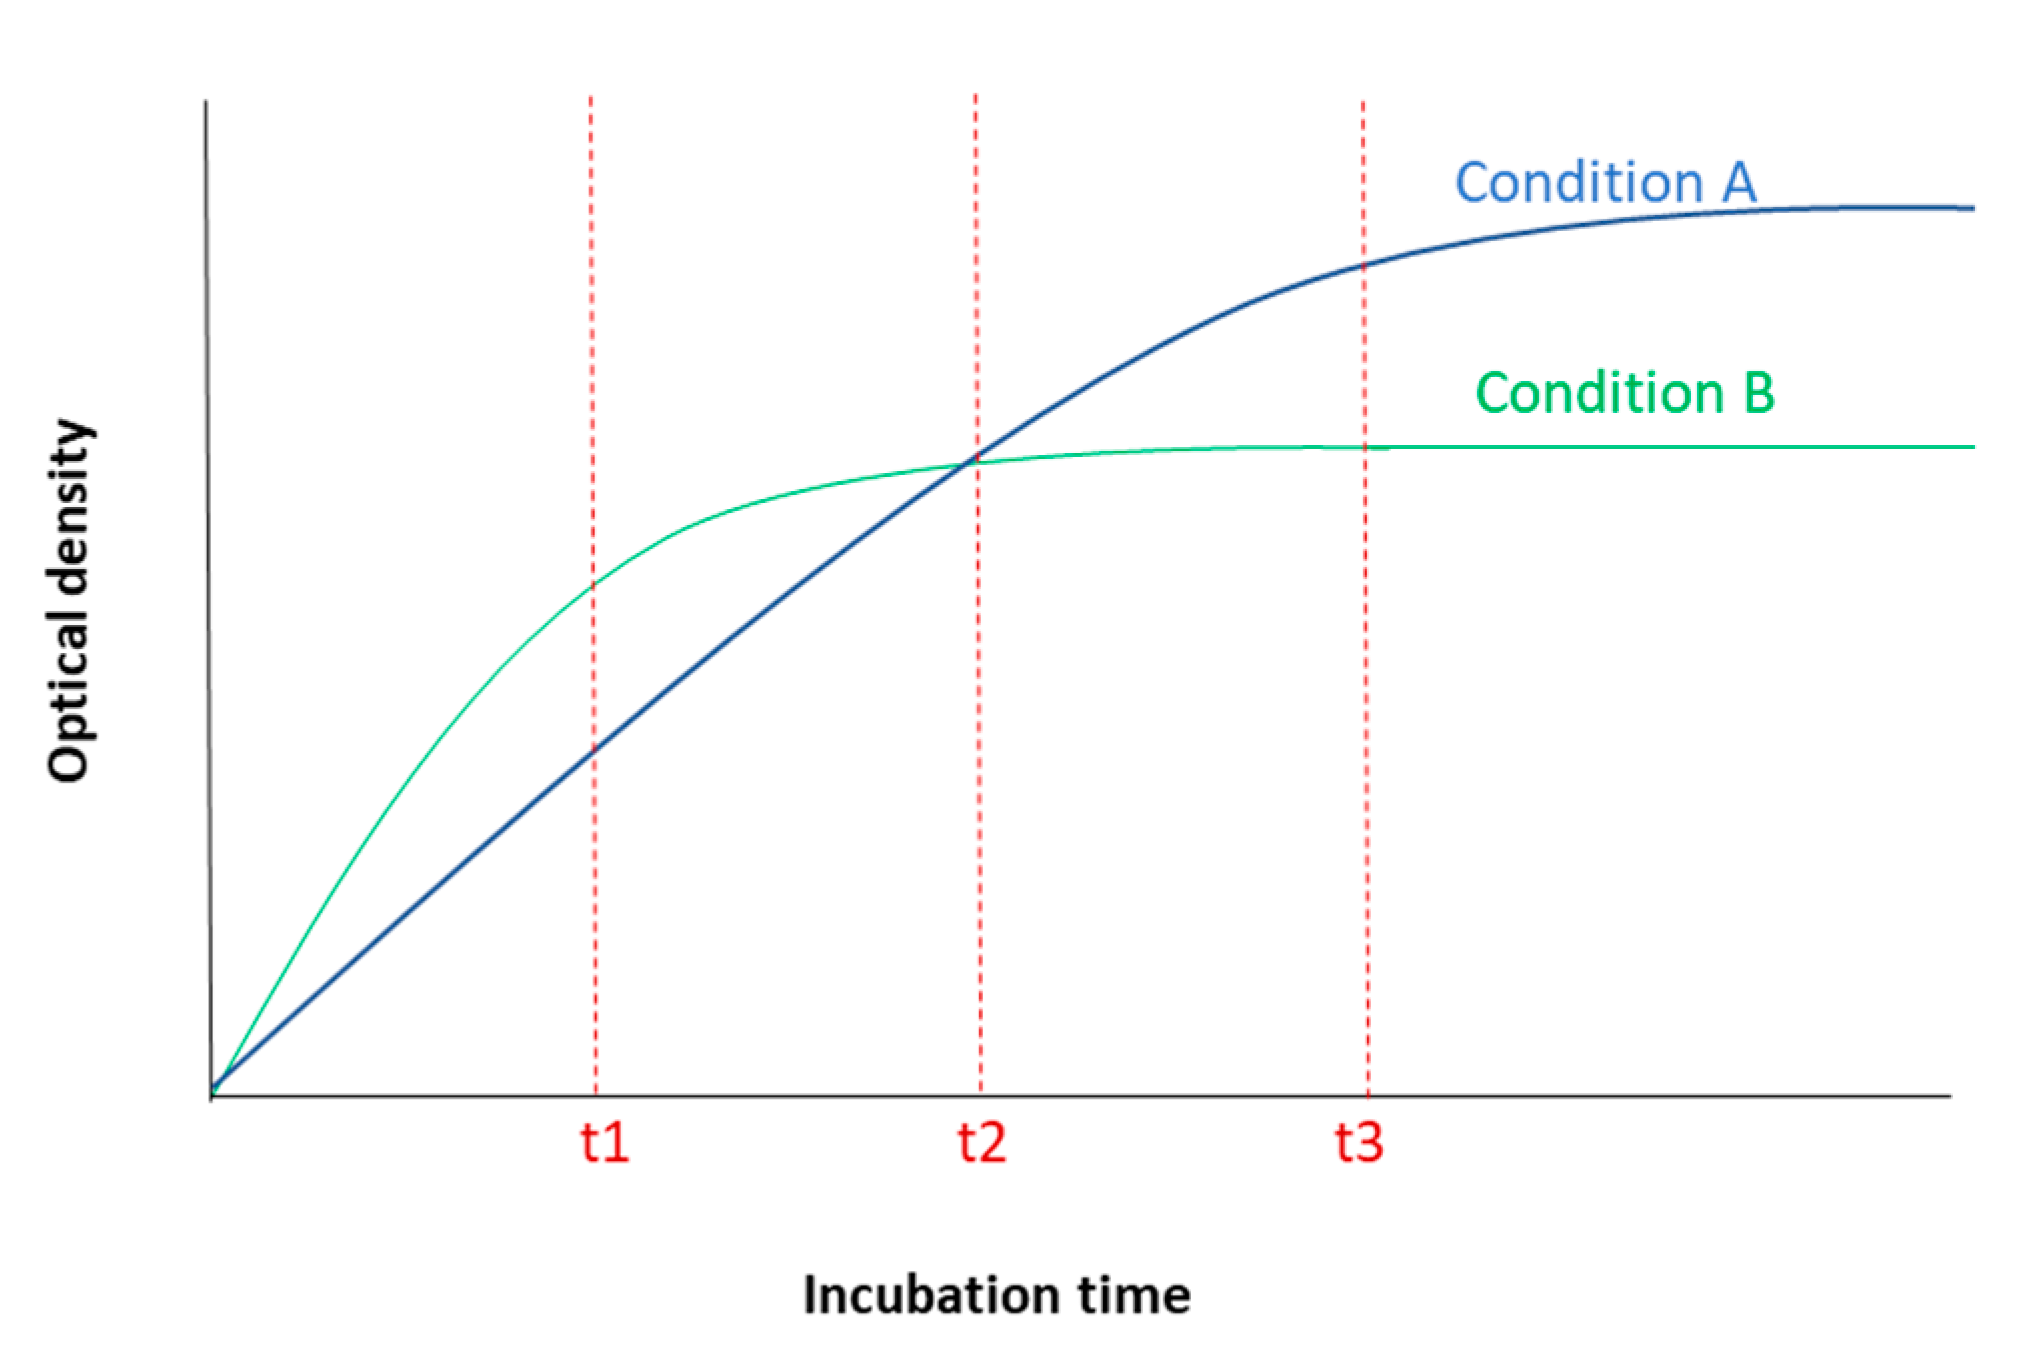
2.1.2. MTT Incubation Time
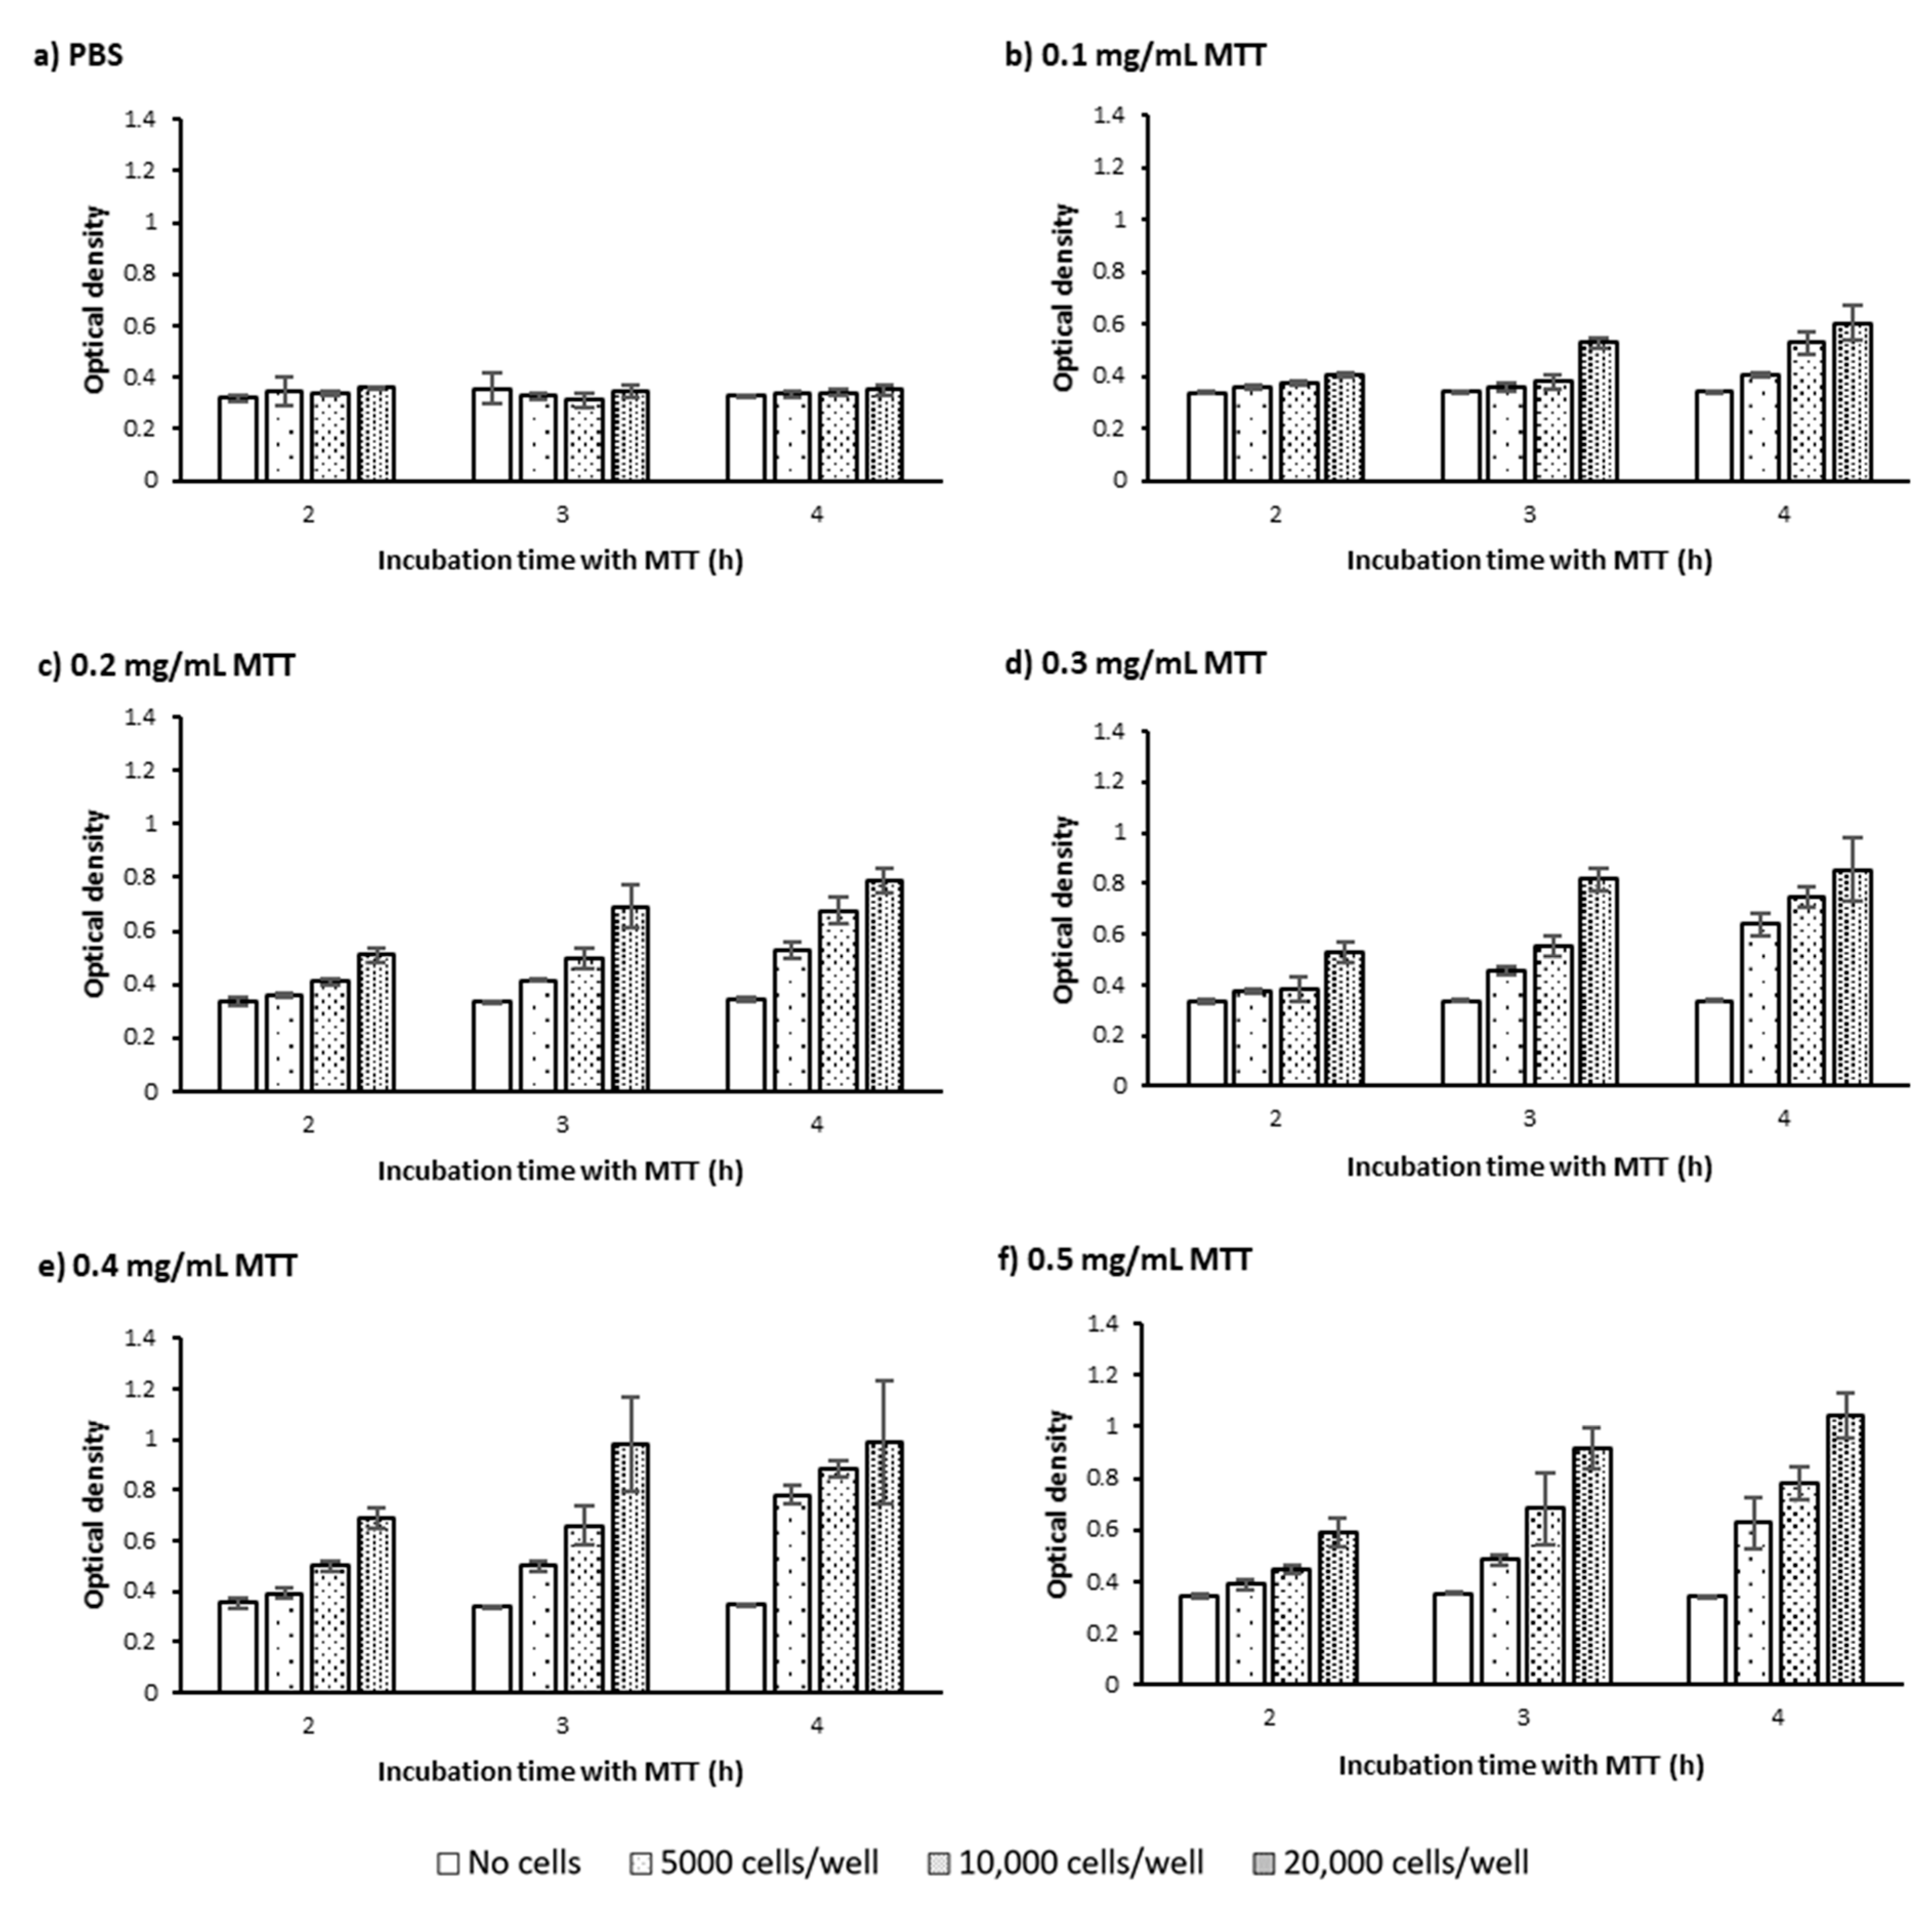
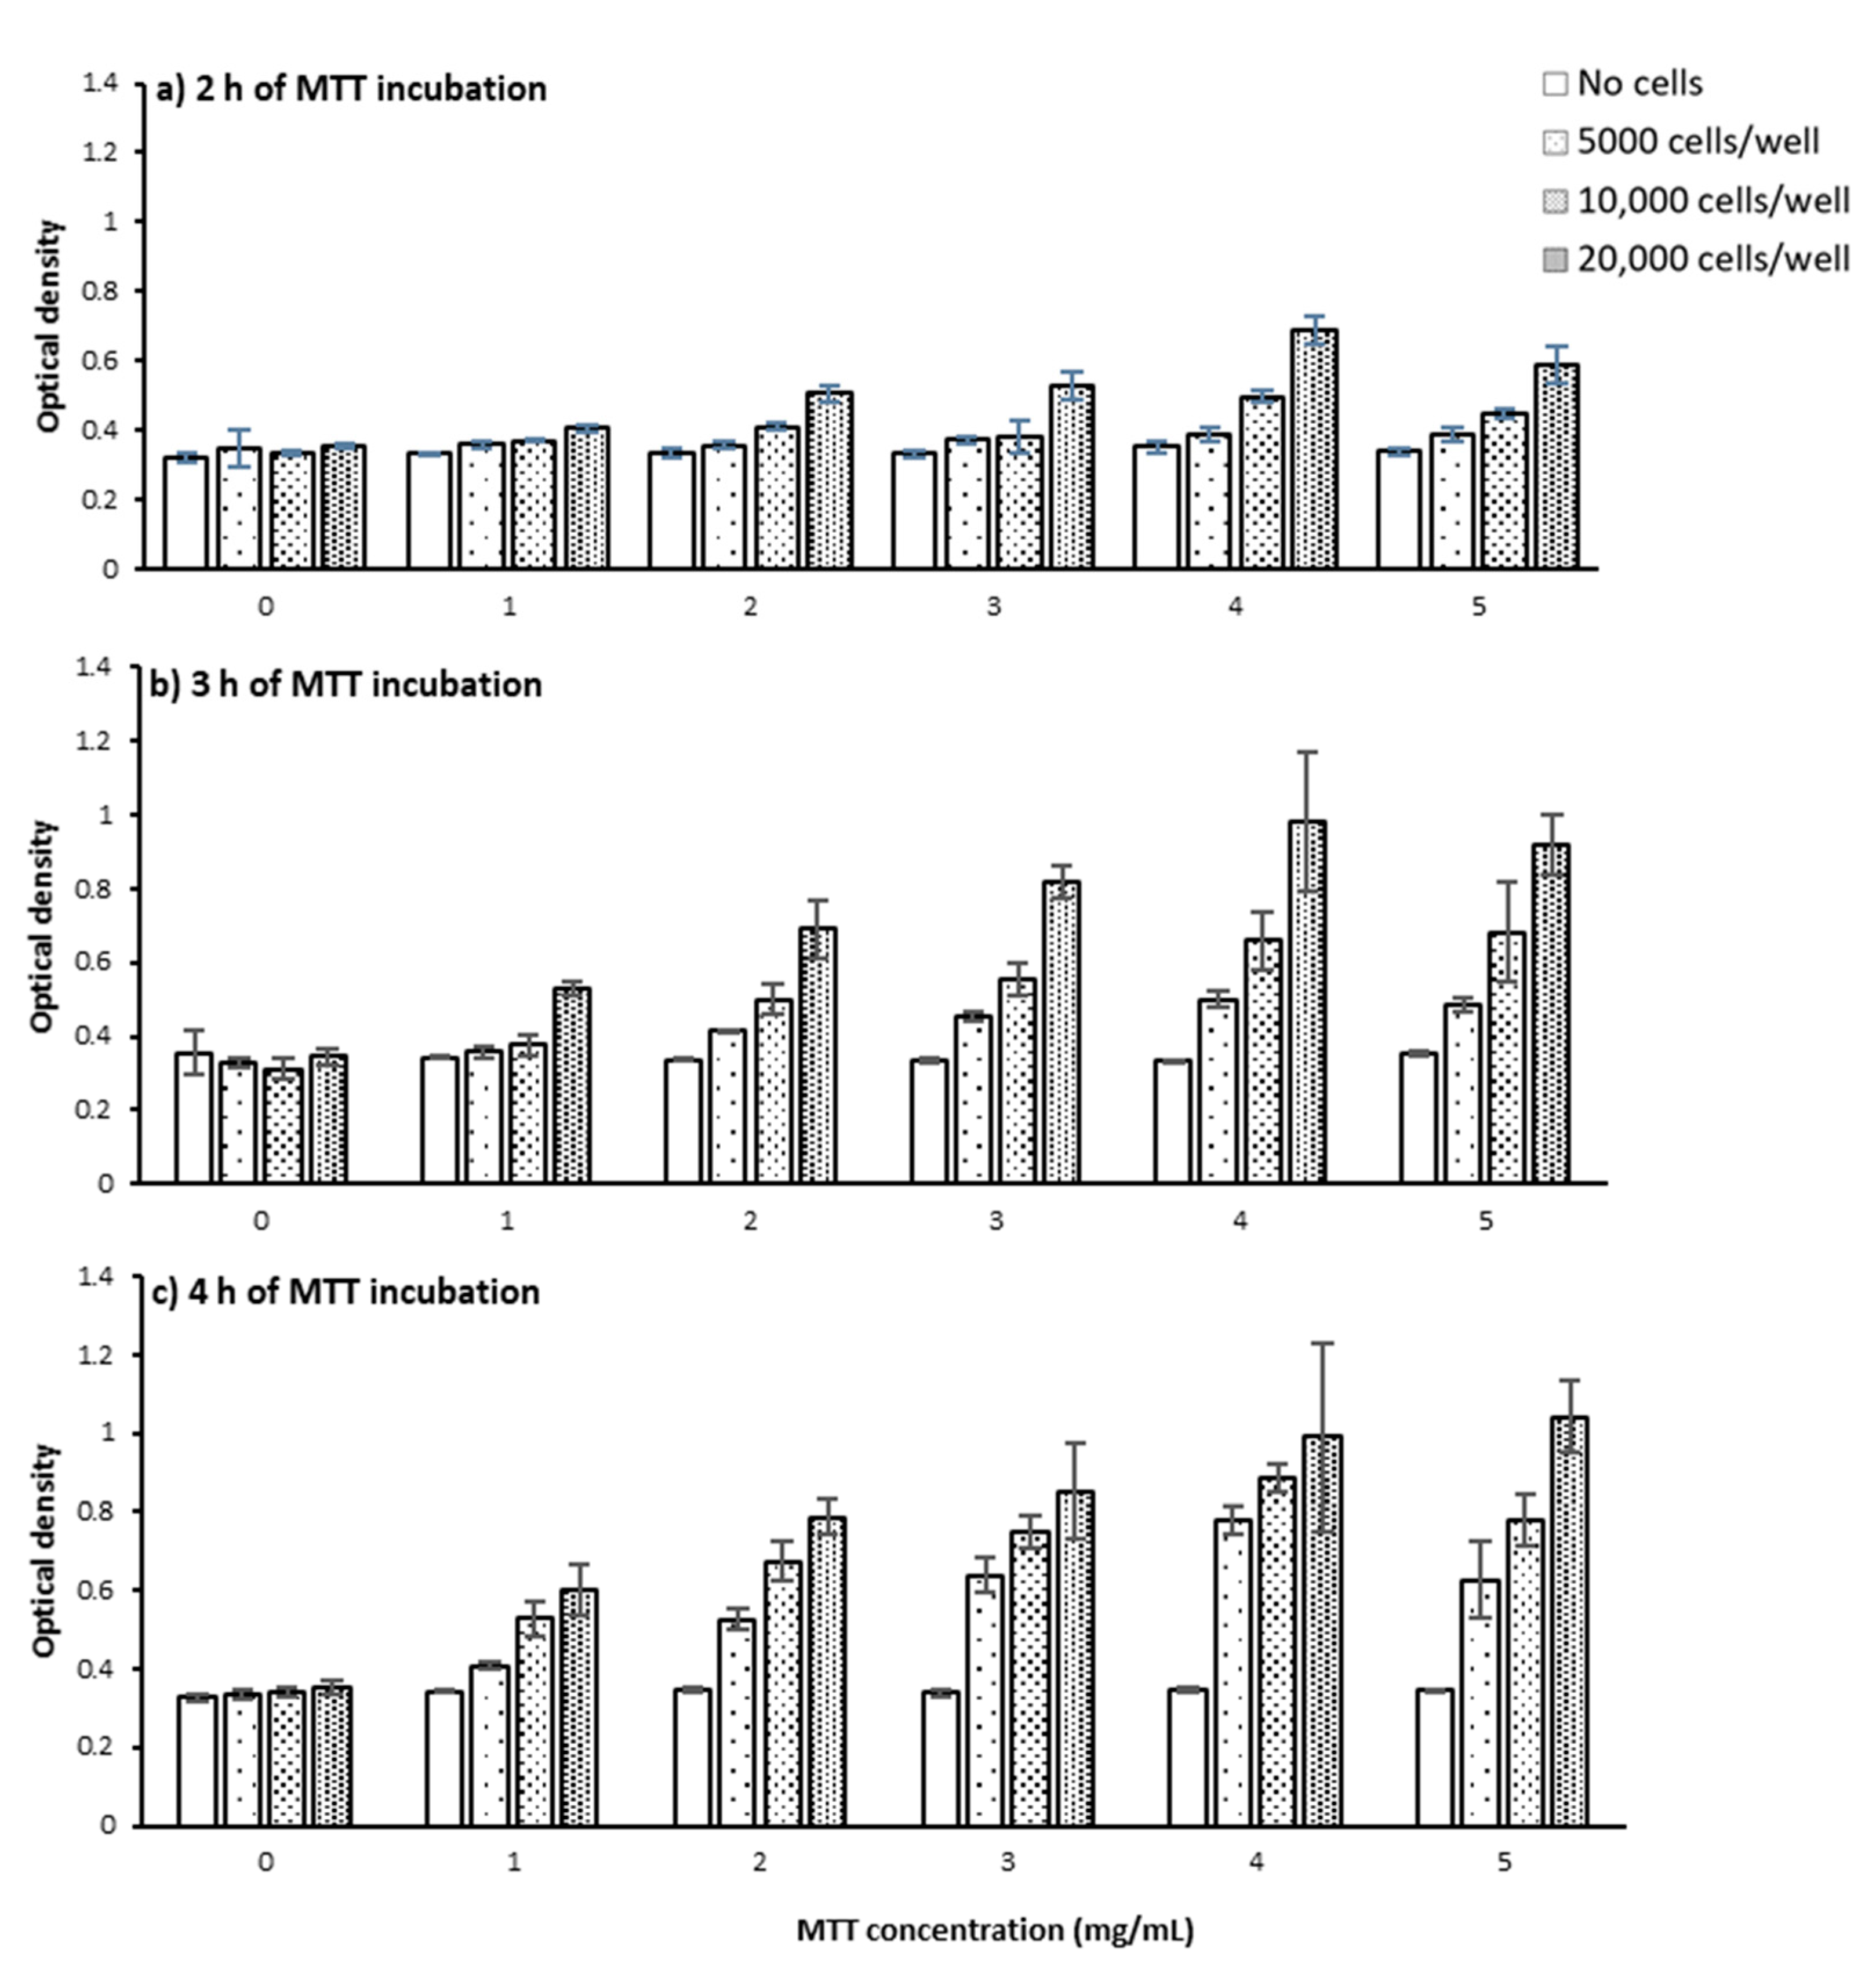
2.1.3. MTT Concentration
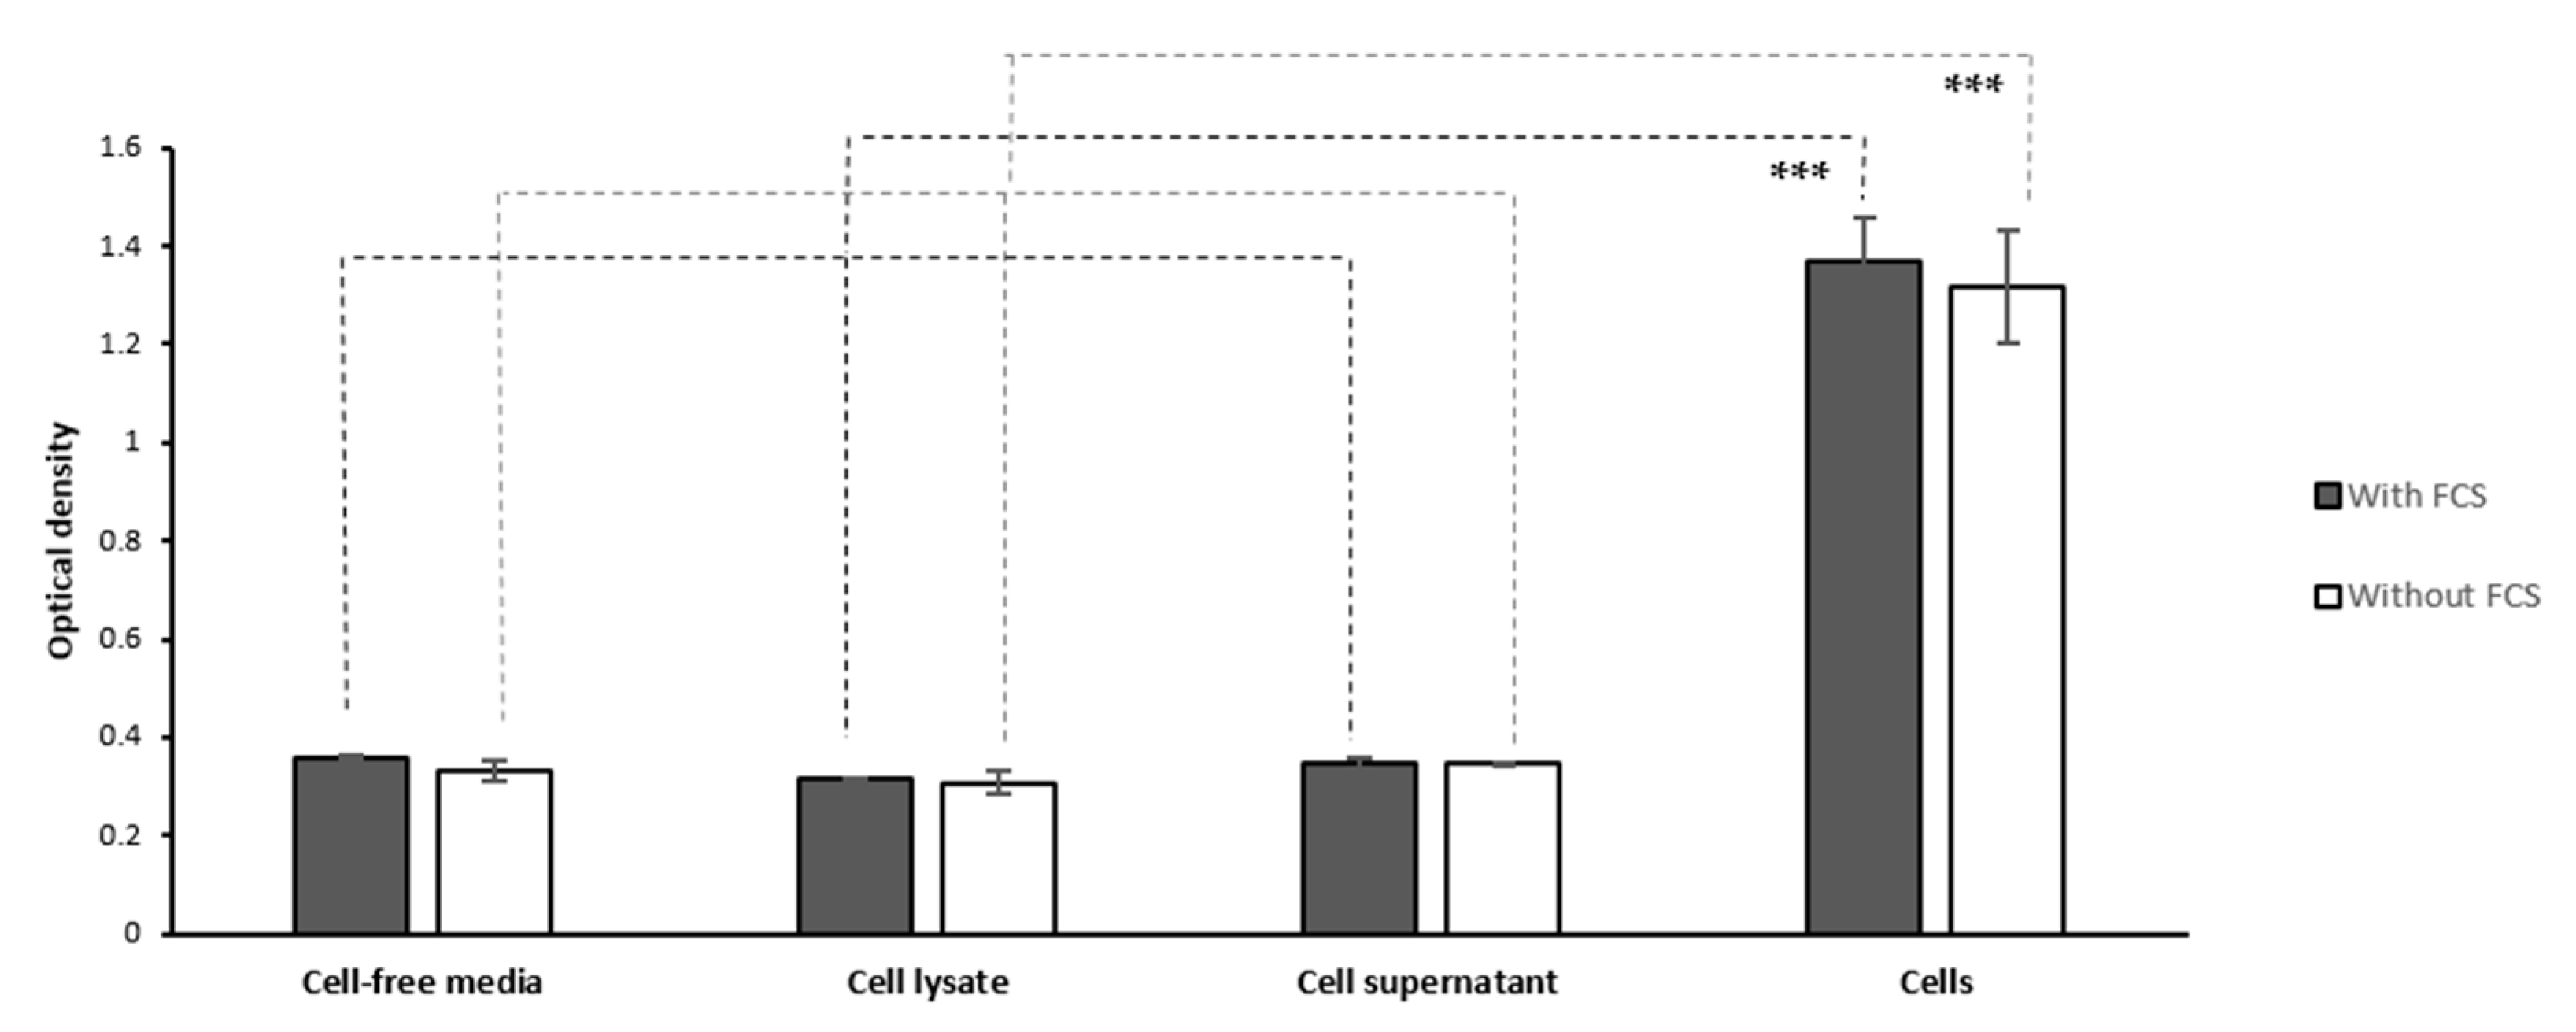
2.1.4. Cell Lysate and Secretome
2.1.5. Washing Cells’ Supernatant Following MTT Reduction
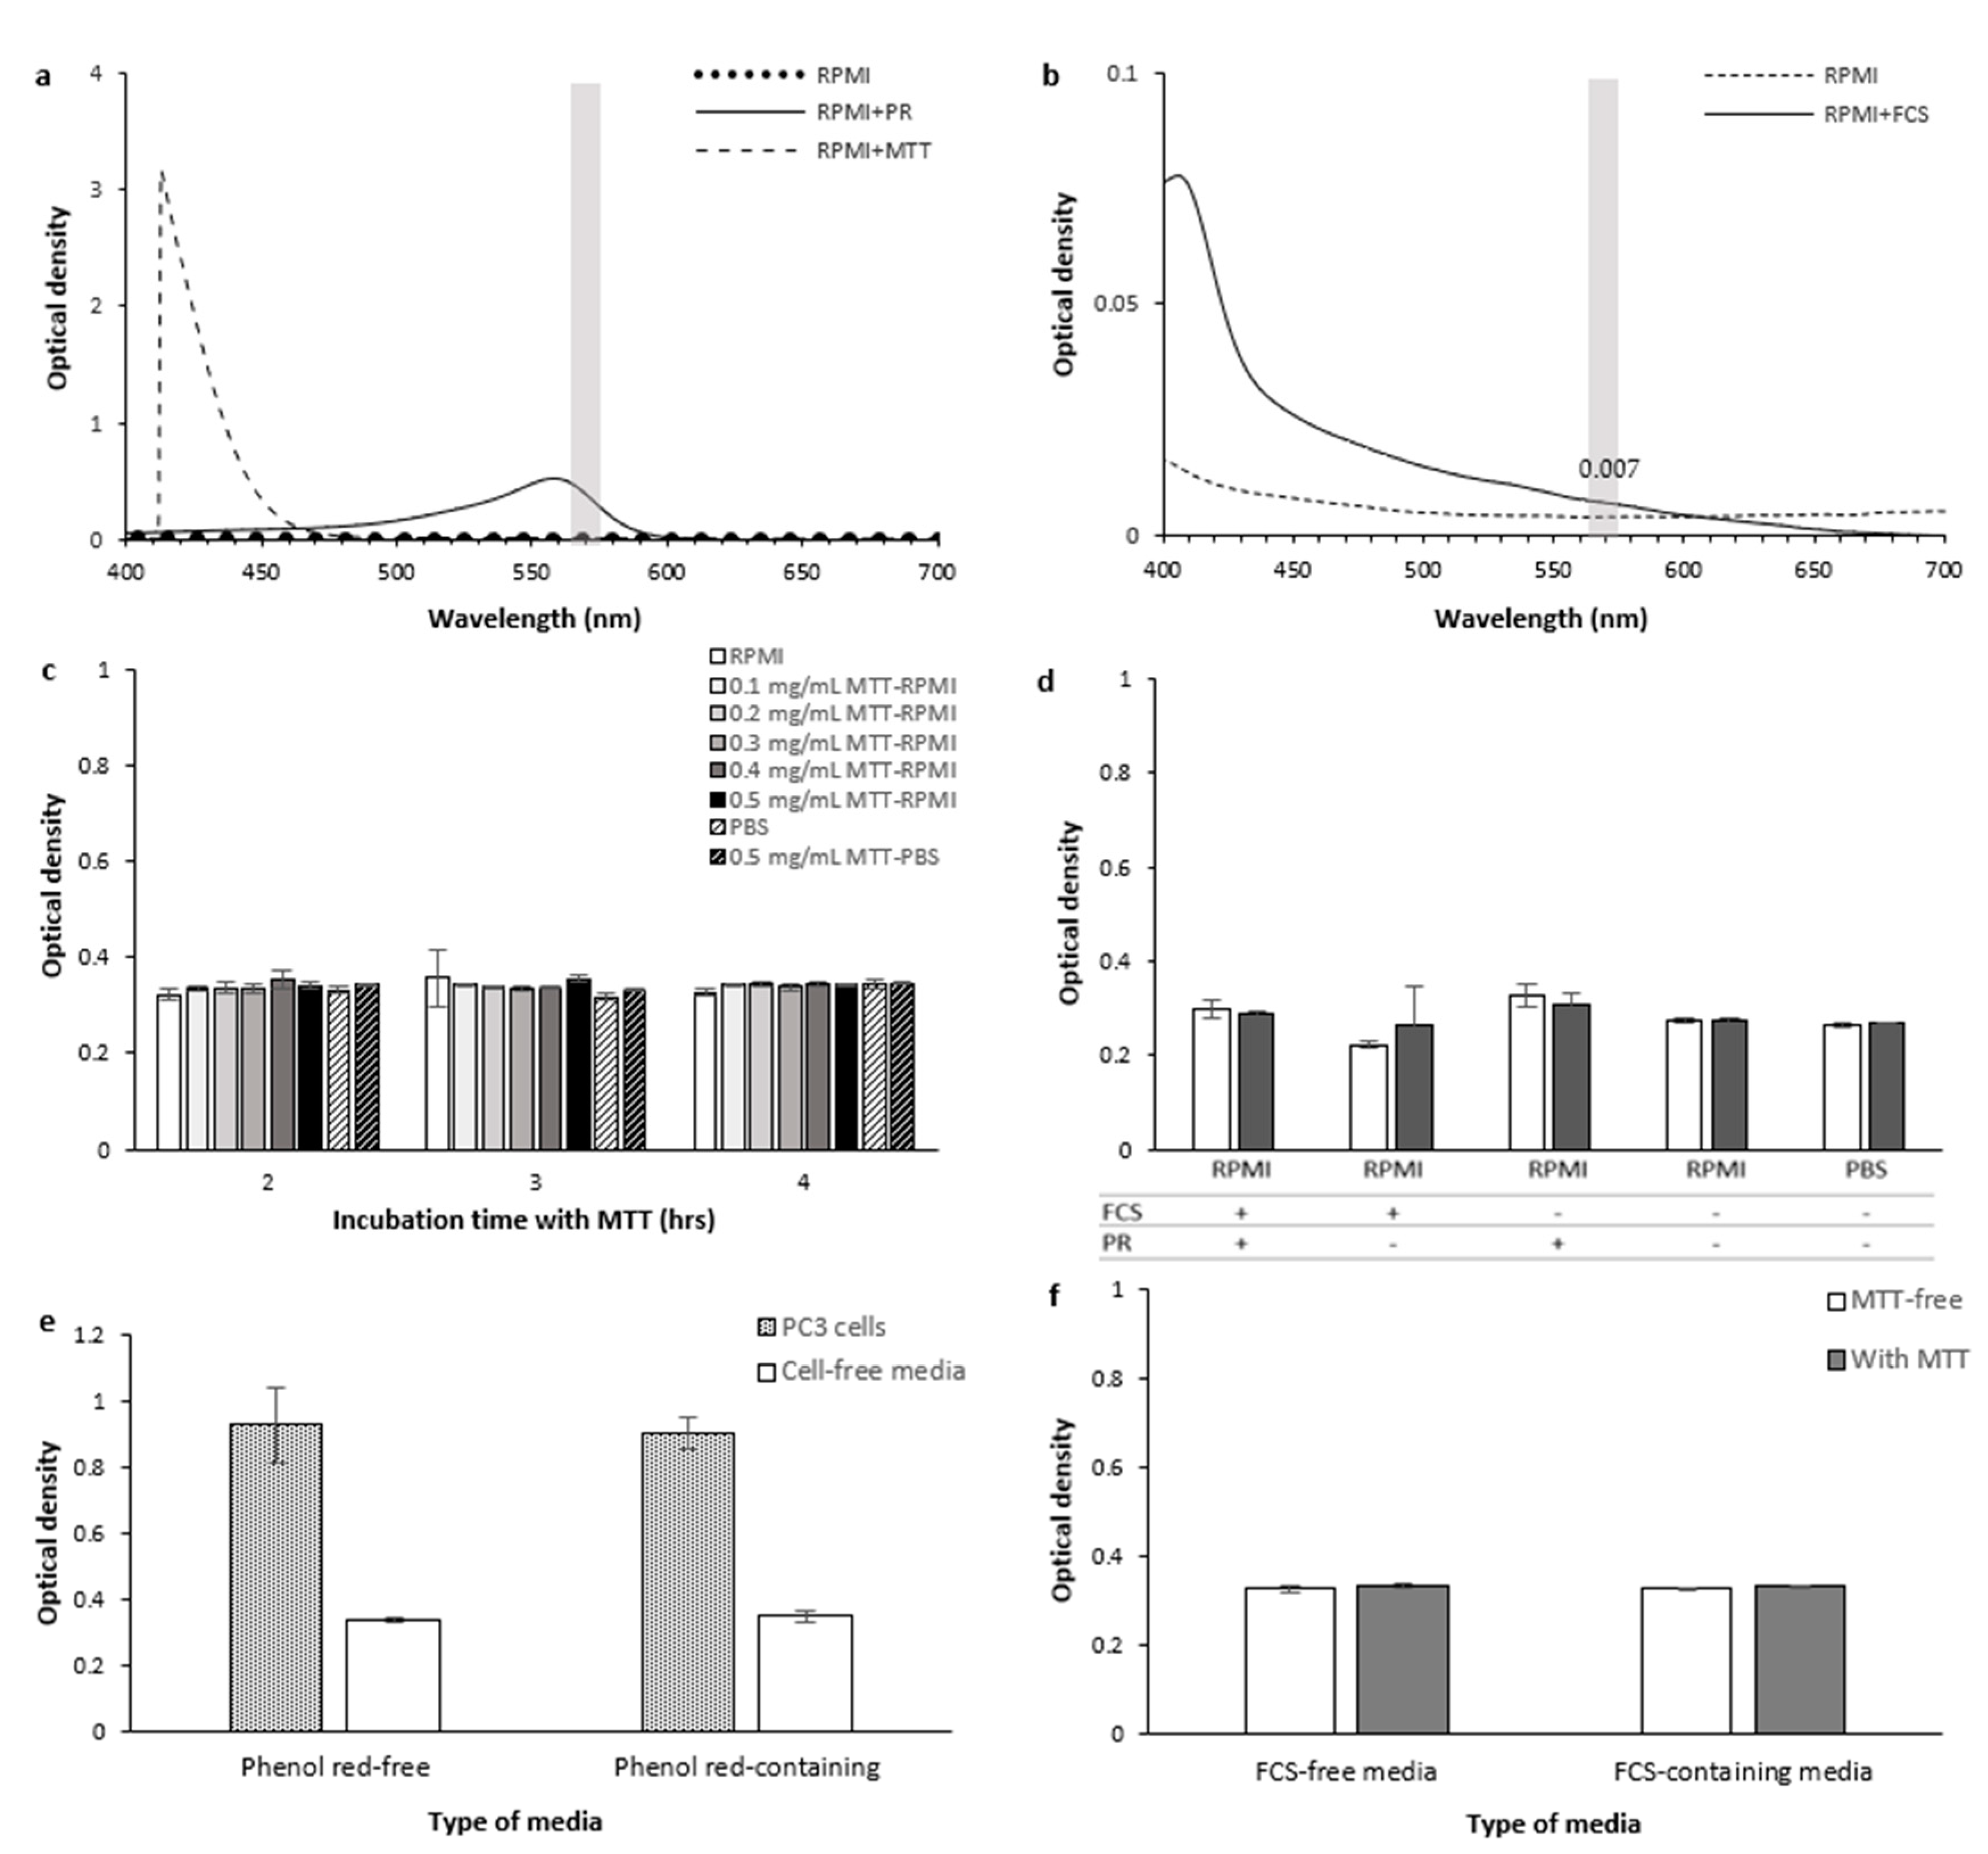
2.1.6. Culture Media
Optical Interference
- RPMI and MTT
- Phenol red
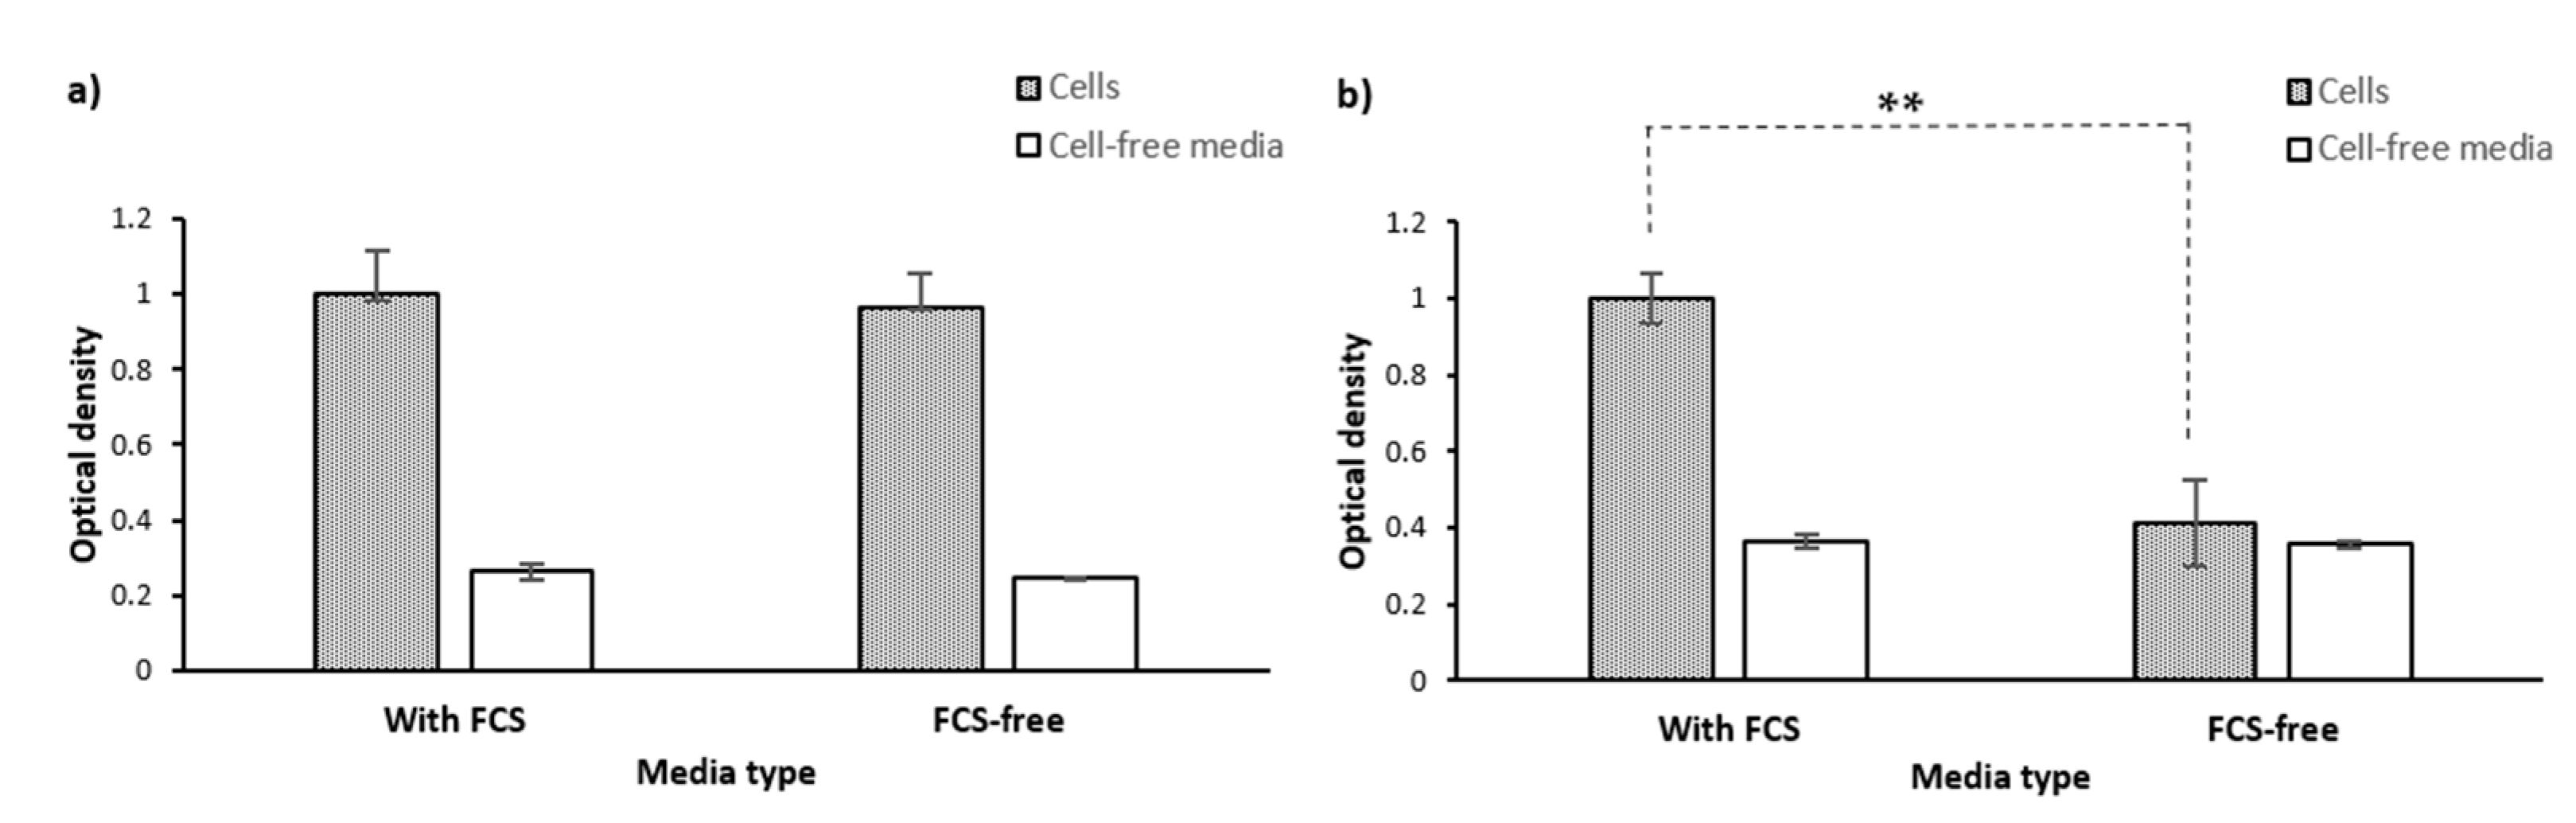
- FCS
Chemical Interference
Biological Effects
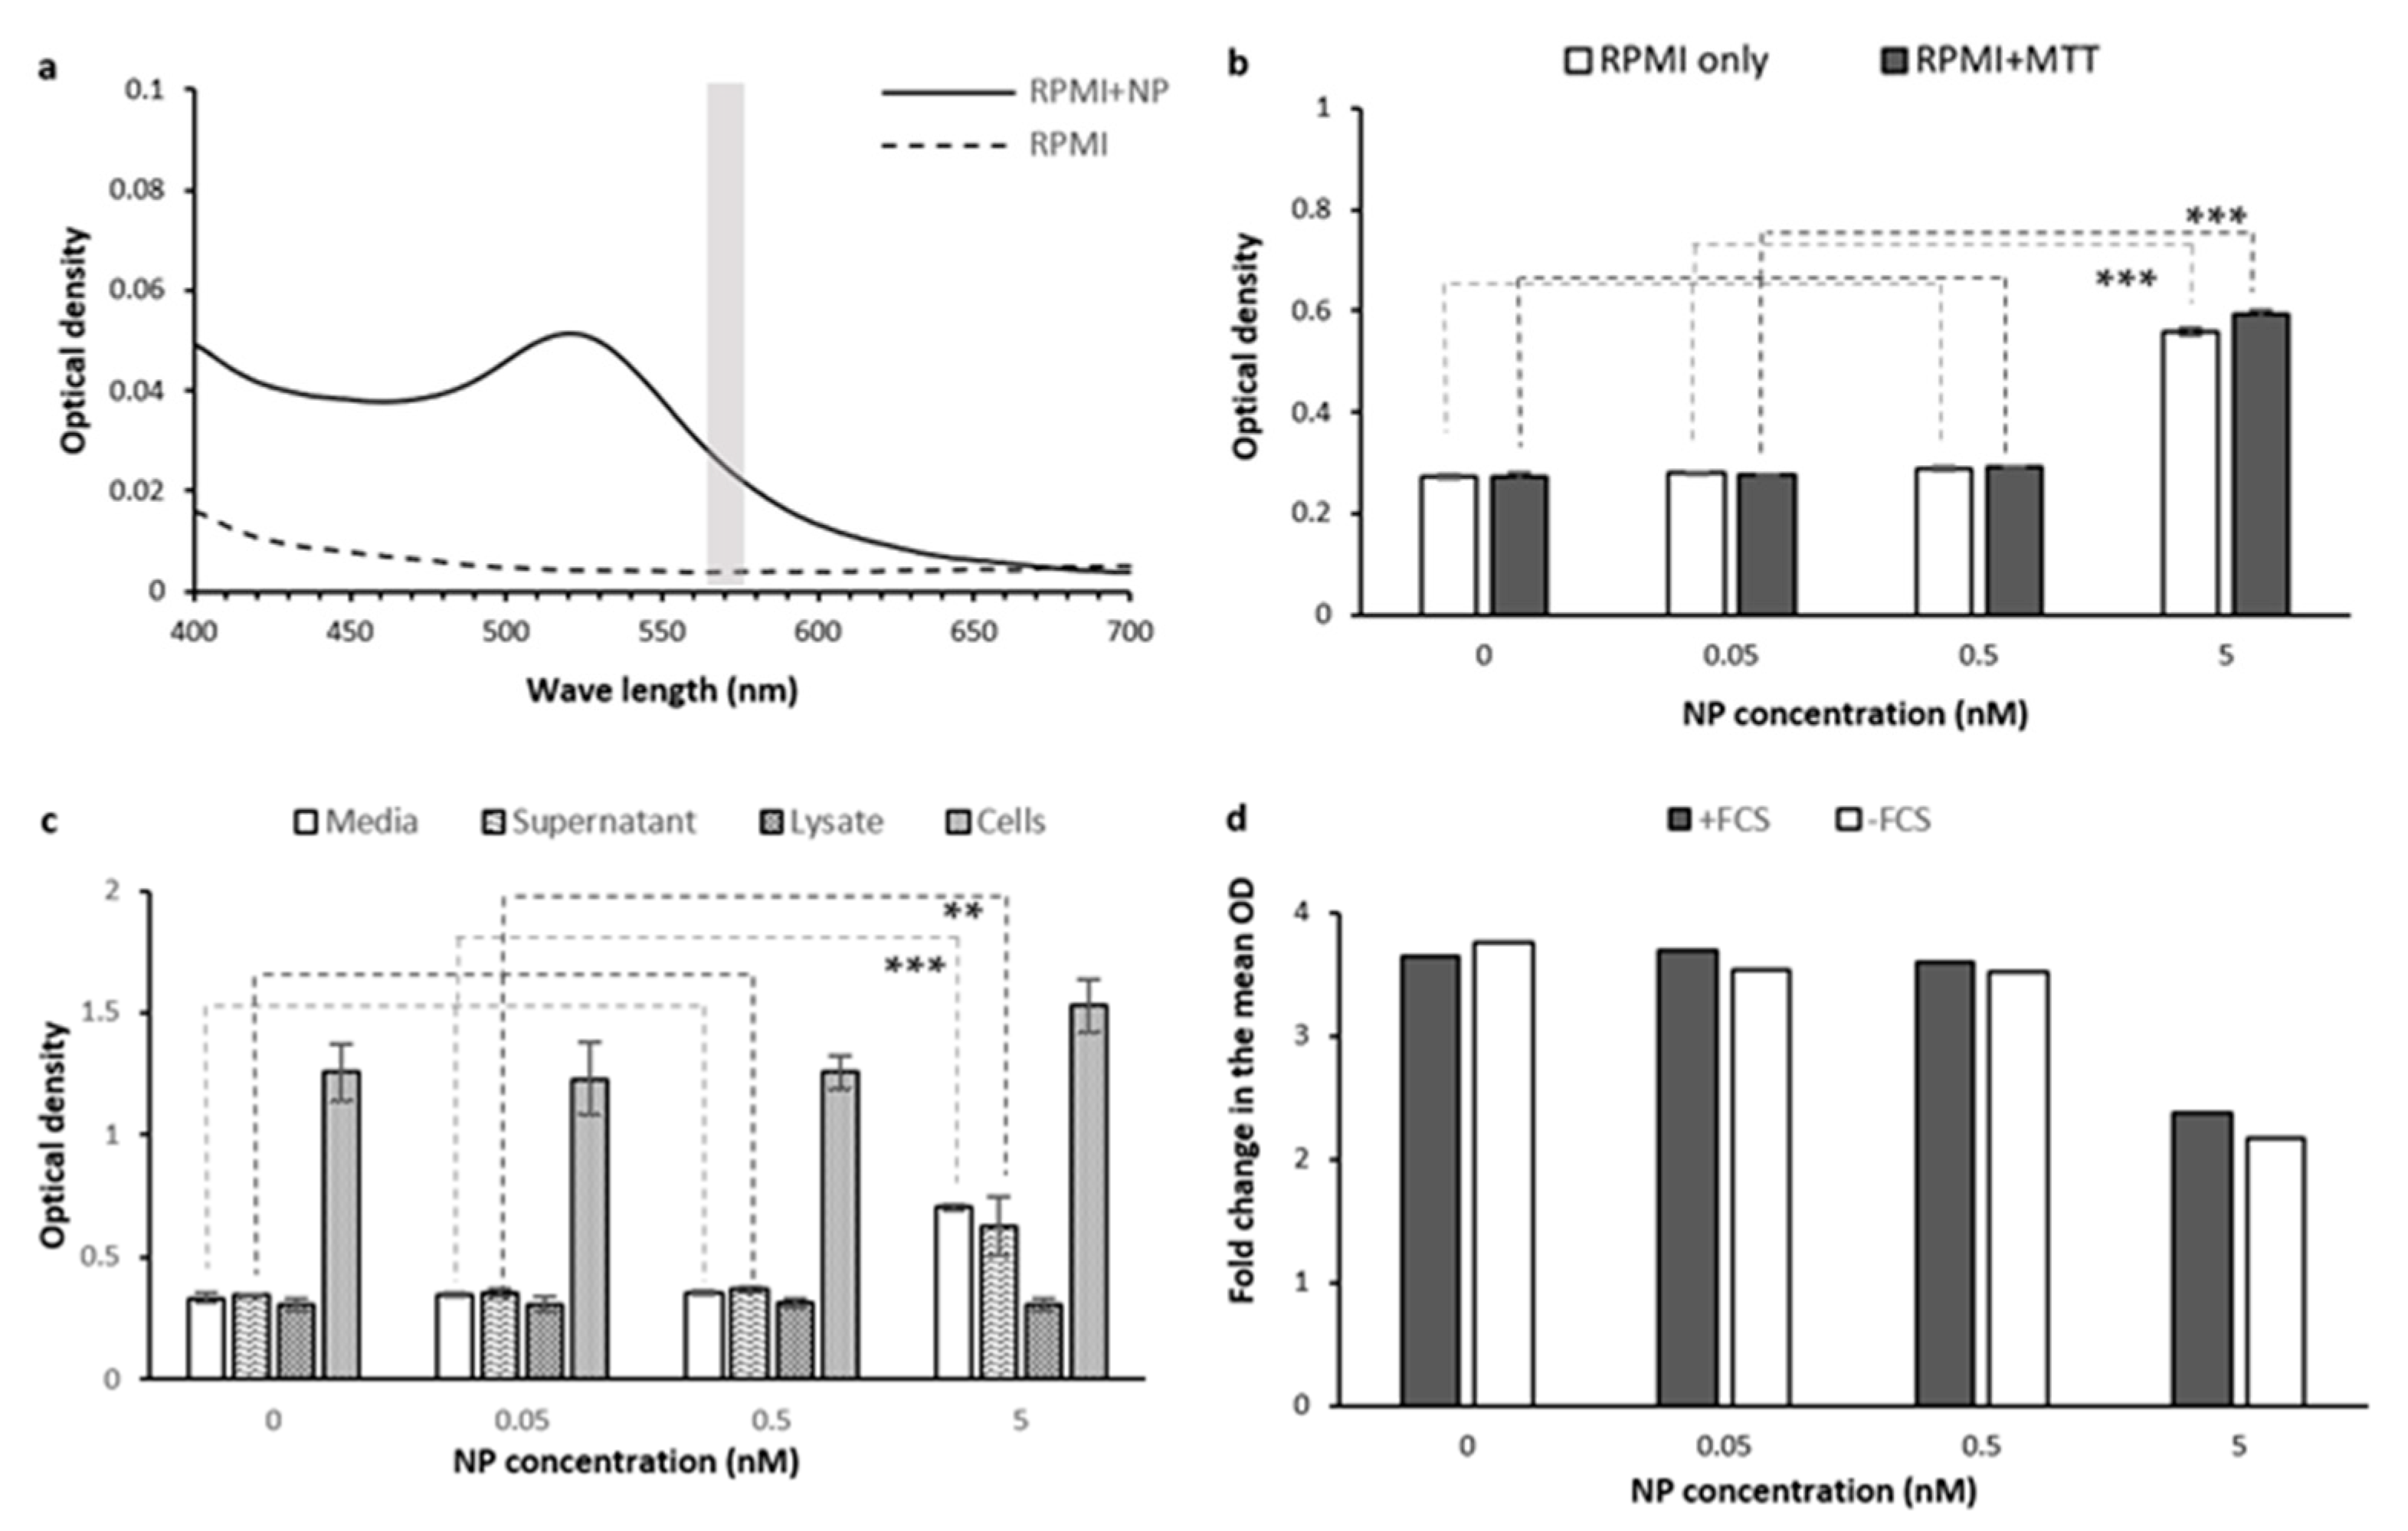
2.1.7. Tested Treatment (Gold Nanoparticles)
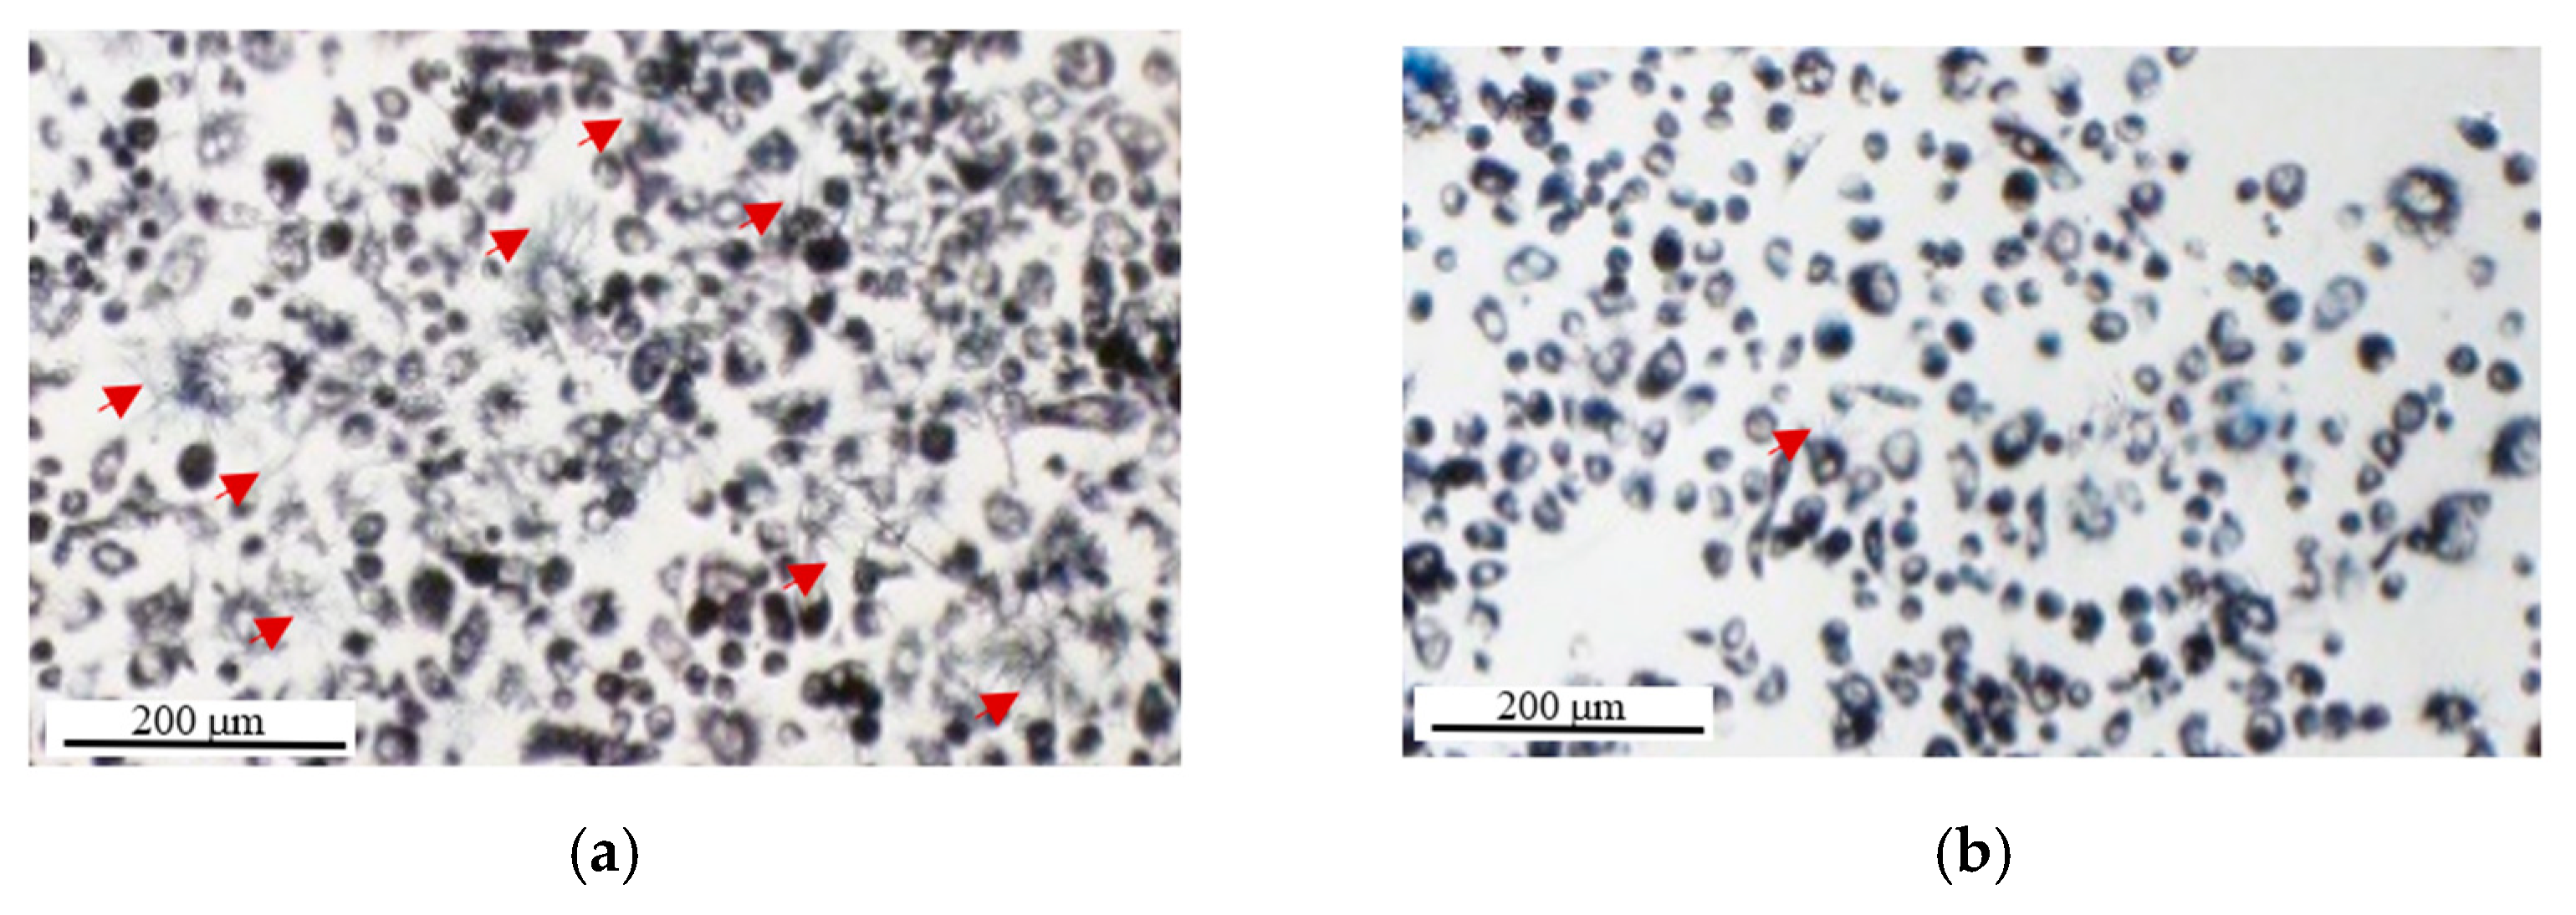
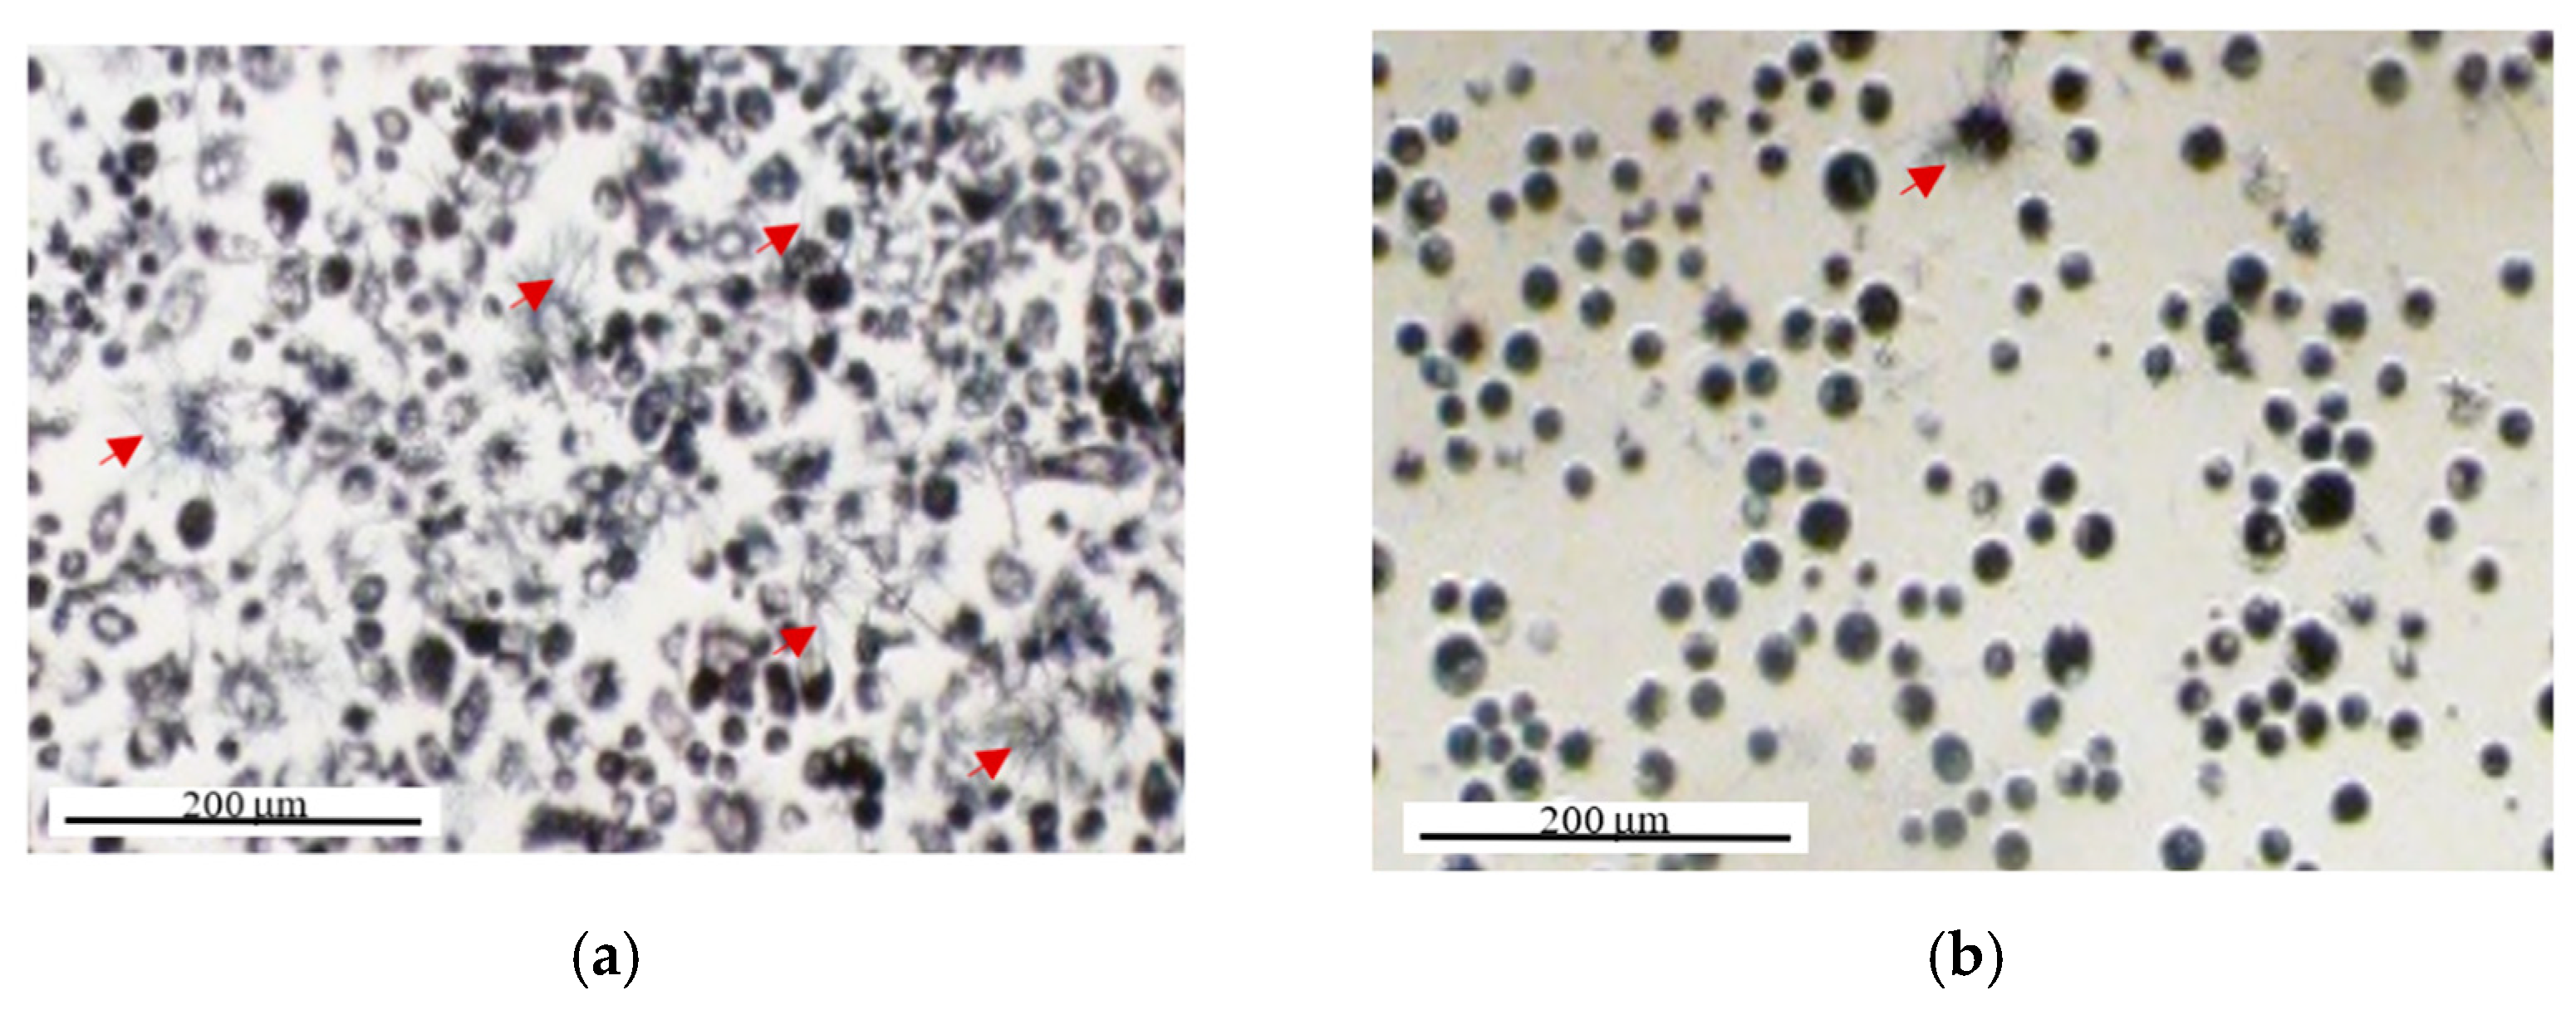
2.2. MTT Reduction Measurement at the Single-Cell Level Using Image Cytometry
3. Materials and Methods
3.1. Defining the Optimum Cell Density, MTT Concentration, and MTT Incubation Time in the Bulk MTT Assay on PC-3 Cells
3.2. The Effect of Au-PEG NPs and Culture Media Components In-Solution
3.3. The Effect of Supernatant Washing, Serum Starvation, and Phenol Red in Cells and In-Solution
3.4. The Effect of Au-PEG NPs, Cell Lysate, and Cell Secretome in Cells
4. Conclusions
Supplementary Materials
Author Contributions
Funding
Data Availability Statement
Conflicts of Interest
References
- Berridge, M.V.; Herst, P.M.; Tan, A.S. Tetrazolium dyes as tools in cell biology: New insights into their cellular reduction. Biotechnol. Annu. Rev. 2005, 11, 127–152. [Google Scholar] [CrossRef] [PubMed]
- Stockert, J.C.; Horobin, R.W.; Colombo, L.L.; Blázquez-Castro, A. Tetrazolium salts and formazan products in Cell Biology: Viability assessment, fluorescence imaging, and labeling perspectives. Acta Histochem. 2018, 120, 159–167. [Google Scholar] [CrossRef] [Green Version]
- Mosmann, T. Rapid colorimetric assay for cellular growth and survival: Application to proliferation and cytotoxicity assays. J. Immunol. Methods 1983, 65, 55–63. [Google Scholar] [CrossRef]
- Surin, A.M.; Sharipov, R.R.; Krasil’Nikova, I.A.; Boyarkin, D.P.; Lisina, O.Y.; Gorbacheva, L.R.; Avetisyan, A.V.; Pinelis, V.G. Disruption of functional activity of mitochondria during MTT assay of viability of cultured neurons. Biochemistry 2017, 82, 737–749. [Google Scholar] [CrossRef]
- Liu, Y.; Peterson, D.A.; Kimura, H.; Schubert, D. Mechanism of cellular 3-(4, 5-dimethylthiazol-2-yl)-2, 5-diphenyltetrazolium bromide (MTT) reduction. J. Neurochem. 1997, 69, 581–593. [Google Scholar] [CrossRef]
- Ghazali, R.; Mehta, K.J.; Bligh, S.A.; Tewfik, I.; Clemens, D.; Patel, V.B. High omega arachidonic acid/docosahexaenoic acid ratio induces mitochondrial dysfunction and altered lipid metabolism in human hepatoma cells. World J. Hepatol. 2020, 12, 84–98. [Google Scholar] [CrossRef]
- Moldovan, L.M.; Kislev, N.; Lustig, M.; Pomeraniec, L.; Benayahu, D. Biomechanical stimulation effects on the metabolism of adipocyte. J. Cell. Physiol. 2020, 235, 8702–8713. [Google Scholar] [CrossRef]
- Kok, D.; Peeters, C.M.M.; Mardina, Z.; Oterdoom, D.L.M.; Bulstra, S.K.; Veldhuizen, A.G.; Kuijer, R.; Wapstra, F.H. Is remaining intervertebral disc tissue interfering with bone generation during fusion of two vertebrae? PLoS ONE 2019, 14, e0215536. [Google Scholar] [CrossRef] [Green Version]
- Gokduman, K.; Gok, A. In Vitro Investigation of Therapeutic Potential of Bare Magnetite (Fe3O4) Nanoparticles (≤100 ppm) on Hepatocellular Carcinoma Cells. J. Nanosci. Nanotechnol. 2020, 20, 1391–1400. [Google Scholar] [CrossRef]
- Nikoloff, N.; Martin, A.C.C.; Fabra, M.C.; Furnus, C.C. Amitraz induced cytotoxic effect on bovine cumulus cells and impaired oocyte maturation. Environ. Sci. Pollut. Res. 2021, 28, 29188–29199. [Google Scholar] [CrossRef]
- Patra, T.; Gupta, M.K. Evaluation of sodium alginate for encapsulation-vitrification of testicular Leydig cells. Int. J. Biol. Macromol. 2020, 153, 128–137. [Google Scholar] [CrossRef]
- Małaczewska, J.; Kaczorek-Łukowska, E.; Kazuń, B. High cytotoxicity of betulin towards fish and murine fibroblasts: Is betulin safe for nonneoplastic cells? BMC Veter. Res. 2021, 17, 198. [Google Scholar] [CrossRef]
- Diaz, G.; Melis, M.; Musin, A.; Piludu, M.; Piras, M.; Falchi, A.M. Localization of MTT formazan in lipid droplets. An alternative hypothesis about the nature of formazan granules and aggregates. Eur. J. Histochem. 2007, 51, 213–218. [Google Scholar]
- Stockert, J.C.; Blázquez-Castro, A.; Cañete, M.; Horobin, R.W.; Villanueva, Á. MTT assay for cell viability: Intracellular localization of the formazan product is in lipid droplets. Acta Histochem. 2012, 114, 785–796. [Google Scholar] [CrossRef]
- Bernas, T.; Dobrucki, J. The Role of Plasma Membrane in Bioreduction of Two Tetrazolium Salts, MTT, and CTC. Arch. Biochem. Biophys. 2000, 380, 108–116. [Google Scholar] [CrossRef]
- Carreño, E.; Alberto, A.; de Souza, C.; de Mello, H.; Henriques-Pons, A.; Alves, L.A. Considerations and Technical Pitfalls in the Employment of the MTT Assay to Evaluate Photosensitizers for Photodynamic Therapy. Appl. Sci. 2021, 11, 2603. [Google Scholar] [CrossRef]
- Koyanagi, M.; Kawakabe, S.; Arimura, Y. A comparative study of colorimetric cell proliferation assays in immune cells. Cytotechnology 2015, 68, 1489–1498. [Google Scholar] [CrossRef] [PubMed] [Green Version]
- Plumb, J.; Milroy, R.; Kaye, S.B. Effects of the pH dependence of 3-(4,5-dimethylthiazol-2-yl)-2,5-diphenyl-tetrazolium bromide-formazan absorption on chemosensitivity determined by a novel tetrazolium-based assay. Cancer Res. 1989, 49, 4435–4440. [Google Scholar]
- Alberts, B.; Johnson, A.; Lewis, J.; Raff, M.; Roberts, K.; Walter, P. General principles of cell communication. In Molecular Biology of the Cell, 4th ed.; Garland Science: New York, NY, USA, 2002. [Google Scholar]
- Ward, P.S.; Thompson, C.B. Signaling in Control of Cell Growth and Metabsolism. Cold Spring Harb. Perspect. Biol. 2012, 4, a006783. [Google Scholar] [CrossRef] [Green Version]
- Karp, G.; van der Geer, P. Cell signaling and signal transduction: Communication between cells. Cell and Molecular Biology. Concepts Exp. 2005, 6, 608–609. [Google Scholar]
- Riss, T.L.; Moravec, R.A.; Niles, A.L.; Duellman, S.; Benink, H.A.; Worzella, T.J.; Minor, L. Cell Viability Assays. Assay Guidance Manual. 2016. Available online: https://www.ncbi.nlm.nih.gov/books/NBK144065/?report=reader (accessed on 20 November 2021).
- Ismail, N.; Ab Ghani, N.B.; Rusli, S.N.A.; Abdullah, N.A.; Awang, R.A. Cytotoxicity assessment of zirconia-reinforced experimental nanohybrid dental composite using MTT assay. Ann. Rom. Soc. Cell Biol. 2021, 25, 14878–14886. [Google Scholar]
- Şekeroğlu, V.; Ertürk, B.; Şekeroğlu, Z.A. Effects of deltamethrin and thiacloprid on cell viability, colony formation and DNA double-strand breaks in human bronchial epithelial cells. Chemosphere 2021, 263, 128293. [Google Scholar] [CrossRef]
- Ong, T.H.D.; Yu, N.; Meenashisundaram, G.K.; Schaller, B.; Gupta, M. Insight into cytotoxicity of Mg nanocomposites using MTT assay technique. Mater. Sci. Eng. C 2017, 78, 647–652. [Google Scholar] [CrossRef]
- Wang, F.; Liu, P.; An, H.; Zhang, Y. Sulforaphane suppresses the viability and metastasis, and promotes the apoptosis of bladder cancer cells by inhibiting the expression of FAT-1. Int. J. Mol. Med. 2020, 46, 1085–1095. [Google Scholar] [CrossRef]
- Schröder, L.; Marahrens, P.; Koch, J.G.; Heidegger, H.; Vilsmeier, T.; Phan-Brehm, T.; Hofmann, S.; Mahner, S.; Jeschke, U.; Richter, D.U. Effects of green tea, matcha tea and their components epigallocatechin gallate and quercetin on MCF-7 and MDA-MB-231 breast carcinoma cells Corrigendum in/10.3892/or. 2019.7430. Oncol. Rep. 2019, 41, 387–396. [Google Scholar]
- Li, B.; Zani, A.; Martin, Z.; Lee, C.; Zani-Ruttenstock, E.; Eaton, S.; Pierro, A. Intestinal epithelial cell injury is rescued by hydrogen sulfide. J. Pediatr. Surg. 2016, 51, 775–778. [Google Scholar] [CrossRef]
- Hock, A.; Miyake, H.; Li, B.; Lee, C.; Ermini, L.; Koike, Y.; Chen, Y.; Määttänen, P.; Zani, A.; Pierro, A. Breast milk-derived exosomes promote intestinal epithelial cell growth. J. Pediatr. Surg. 2017, 52, 755–759. [Google Scholar] [CrossRef]
- Tang, L.; Wei, F.; Wu, Y.; He, Y.; Shi, L.; Xiong, F.; Gong, Z.; Guo, C.; Li, X.; Deng, H.; et al. Role of metabolism in cancer cell radioresistance and radiosensitization methods. J. Exp. Clin. Cancer Res. 2018, 37, 1–15. [Google Scholar] [CrossRef]
- Wang, J.-S.; Wang, H.-J.; Qian, H.-L. Biological effects of radiation on cancer cells. Mil. Med Res. 2018, 5, 1–10. [Google Scholar] [CrossRef]
- Rai, Y.; Pathak, R.; Kumari, N.; Sah, D.K.; Pandey, S.; Kalra, N.; Soni, R.; Dwarakanath, B.S.; Bhatt, A.N. Mitochondrial biogenesis and metabolic hyperactivation limits the application of MTT assay in the estimation of radiation induced growth inhibition. Sci. Rep. 2018, 8, 1–15. [Google Scholar] [CrossRef] [Green Version]
- Liu, C.-J.; Wang, C.-H.; Chen, S.-T.; Chen, H.-H.; Leng, W.-H.; Chien, C.-C.; Wang, C.-L.; Kempson, I.; Hwu, Y.; Lai, T.-C.; et al. Enhancement of cell radiation sensitivity by pegylated gold nanoparticles. Phys. Med. Biol. 2010, 55, 931–945. [Google Scholar] [CrossRef]
- Lupu, A.; Popescu, T. The noncellular reduction of MTT tetrazolium salt by TiO2 nanoparticles and its implications for cytotoxicity assays. Toxicol. Vitr. 2013, 27, 1445–1450. [Google Scholar] [CrossRef] [PubMed]
- Mirzayans, R.; Andrais, B.; Murray, D. Do Multiwell Plate High Throughput Assays Measure Loss of Cell Viability Following Exposure to Genotoxic Agents? Int. J. Mol. Sci. 2017, 18, 1679. [Google Scholar] [CrossRef] [Green Version]
- Bromfield, G.P.; Meng, A.; Warde, P.; Bristow, R.G. Cell death in irradiated prostate epithelial cells: Role of apoptotic and clonogenic cell kill. Prostate Cancer Prostatic Dis. 2003, 6, 73–85. [Google Scholar] [CrossRef] [Green Version]
- Coppé, J.-P.; Desprez, P.-Y.; Krtolica, A.; Campisi, J. The Senescence-Associated Secretory Phenotype: The Dark Side of Tumor Suppression. Annu. Rev. Pathol. Mech. Dis. 2010, 5, 99–118. [Google Scholar] [CrossRef] [Green Version]
- Coppé, J.-P.; Patil, C.K.; Rodier, F.; Sun, Y.; Muñoz, D.P.; Goldstein, J.N.; Nelson, P.S.; Desprez, P.-Y.; Campisi, J. Senescence-Associated Secretory Phenotypes Reveal Cell-Nonautonomous Functions of Oncogenic RAS and the p53 Tumor Suppressor. PLoS Biol. 2008, 6, e301. [Google Scholar] [CrossRef]
- Burdon, R.H.; Gill, V.; Rice-Evans, C. Reduction of a Tetrazolium Salt and Superoxide Generation in Human Tumor Cells (HeLa). Free Radic. Res. Commun. 1993, 18, 369–380. [Google Scholar] [CrossRef]
- Abe, K.; Saito, H. Amyloid β protein inhibits cellular MTT reduction not by suppression of mitochondrial succinate dehydrogenase but by acceleration of MTT formazan exocytosis in cultured rat cortical astrocytes. Neurosci. Res. 1998, 31, 295–305. [Google Scholar] [CrossRef]
- Lü, L.; Zhang, L.; Wai, M.S.M.; Yew, D.T.W.; Xu, J. Exocytosis of MTT formazan could exacerbate cell injury. Toxicol. Vitr. 2012, 26, 636–644. [Google Scholar] [CrossRef]
- Lee, S.H.; Park, J.; Kwon, D.; Yoon, T.H. An Image Cytometric MTT Assay as an Alternative Assessment Method of Nanoparticle Cytotoxicity. Bull. Korean Chem. Soc. 2014, 35, 1933–1938. [Google Scholar] [CrossRef] [Green Version]
- Young, F.M.; Phungtamdet, W.; Sanderson, B.J. Modification of MTT assay conditions to examine the cytotoxic effects of amitraz on the human lymphoblastoid cell line, WIL2NS. Toxicol. Vitr. 2005, 19, 1051–1059. [Google Scholar] [CrossRef]
- Bernas, T.; Dobrucki, J.W. Backscattered light confocal imaging of intracellular MTT-formazan crystals. Microsc. Res. Tech. 2004, 64, 126–134. [Google Scholar] [CrossRef]
- Hansen, M.B.; Nielsen, S.E.; Berg, K. Re-examination and further development of a precise and rapid dye method for measuring cell growth/cell kill. J. Immunol. Methods 1989, 119, 203–210. [Google Scholar] [CrossRef]
- Jo, H.Y.; Kim, Y.; Park, H.W.; Moon, H.E.; Bae, S.; Kim, J.; Kim, D.G.; Paek, S.H. The Unreliability of MTT Assay in the Cytotoxic Test of Primary Cultured Glioblastoma Cells. Exp. Neurobiol. 2015, 24, 235–245. [Google Scholar] [CrossRef]
- Talorete, T.P.N.; Bouaziz, M.; Sayadi, S.; Isoda, H. Influence of medium type and serum on MTT reduction by flavonoids in the absence of cells. Cytotechnology 2007, 52, 189–198. [Google Scholar] [CrossRef] [Green Version]
- Twentyman, P.R.; Luscombe, M. A study of some variables in a tetrazolium dye (MTT) based assay for cell growth and chemosensitivity. Br. J. Cancer 1987, 56, 279–285. [Google Scholar] [CrossRef] [Green Version]
- Chakrabarti, R.; Kundu, S.; Kumar, S.; Chakrabarti, R. Vitamin A as an enzyme that catalyzes the reduction of MTT to formazan by vitamin C. J. Cell. Biochem. 2001, 80, 133–138. [Google Scholar] [CrossRef]
- Funk, D.; Schrenk, H.-H.; Frei, E. Serum albumin leads to false-positive results in the XTT and the MTT assay. Biotechniques 2007, 43, 178–186. [Google Scholar] [CrossRef] [PubMed]
- Karakaş, D.; Ari, F.; Ulukaya, E. The MTT viability assay yields strikingly false-positive viabilities although the cells are killed by some plant extracts. Turk. J. Boil. 2017, 41, 919–925. [Google Scholar] [CrossRef]
- Peng, L.; Wang, B.; Ren, P. Reduction of MTT by flavonoids in the absence of cells. Colloids Surf. B Biointerfaces 2005, 45, 108–111. [Google Scholar] [CrossRef]
- Bilmin, K.; Kopczyńska, B.; Grieb, P. Influence of serum and albumin on the in vitro anandamide cytotoxicity toward C6 glioma cells assessed by the MTT cell viability assay: Implications for the methodology of the MTT tests. Folia Neuropathol. 2013, 1, 44–50. [Google Scholar] [CrossRef]
- Golpour, M.; Niaki, H.A.; Khorasani, H.R.; Hajian, A.; Mehrasa, R.; Mostafazadeh, A. Human Fibroblast Switches to Anaerobic Metabolic Pathway in Response to Serum Starvation: A Mimic of Warburg Effect. Int. J. Mol. Cell. Med. 2014, 3, 74–80. [Google Scholar]
- White, E.Z.; Pennant, N.M.; Carter, J.R.; Hawsawi, O.; Odero-Marah, V.; Hinton, C.V. Serum deprivation initiates adaptation and survival to oxidative stress in prostate cancer cells. Sci. Rep. 2020, 10, 1–18. [Google Scholar] [CrossRef]
- Pirkmajer, S.; Chibalin, A.V. Serum starvation: Caveat emptor. Am. J. Physiol. Physiol. 2011, 301, C272–C279. [Google Scholar] [CrossRef] [Green Version]
- Novoa-Herran, S.; Umaña-Perez, A.; Canals, F.; Sanchez-Gomez, M. Serum depletion induces changes in protein expression in the trophoblast-derived cell line HTR-8/SVneo. Cell. Mol. Biol. Lett. 2016, 21, 1–19. [Google Scholar] [CrossRef] [Green Version]
- Ziegler, U.; Groscurth, P. Morphological Features of Cell Death. Physiology 2004, 19, 124–128. [Google Scholar] [CrossRef]
- Elmore, S. Apoptosis: A review of programmed cell death. Toxicol. Pathol. 2007, 35, 495–516. [Google Scholar] [CrossRef]
- Cummings, B.S.; Schnellmann, R.G.; Wills, L.P. Measurement of Cell Death in Mammalian Cells. Curr. Protoc. Pharmacol. 2004, 25. [Google Scholar] [CrossRef] [Green Version]
- Kroemer, G.; Galluzzi, L.; Vandenabeele, P.; Abrams, J.; Alnemri, E.S.; Baehrecke, E.H.; Blagosklonny, M.V.; El-Deiry, W.S.; Golstein, P.; Green, D.R.; et al. Classification of cell death: Recommendations of the Nomenclature Committee on Cell Death 2009. Cell Death Differ. 2009, 16, 3–11. [Google Scholar] [CrossRef]
- Lim, K.H.; Park, J.; Rhee, S.W.; Yoon, T.H. Multiparametric assessment of Cd2+ cytotoxicity using MTT-based microfluidic image cytometry. Cytom. Part A 2012, 81, 691–697. [Google Scholar] [CrossRef]
- Ding, X.; Yin, C.; Zhang, W.; Sun, Y.; Zhang, Z.; Yang, E.; Sun, D.; Wang, W. Designing aptamer-gold nanoparticle-loaded pH-sensitive liposomes encapsulate morin for treating cancer. Nanoscale Res. Lett. 2020, 15, 1–17. [Google Scholar] [CrossRef]
- Dzwonek, M.; Załubiniak, D.; Piątek, P.; Cichowicz, G.; Męczynska-Wielgosz, S.; Stępkowski, T.; Kruszewski, M.; Więckowska, A.; Bilewicz, R. Towards potent but less toxic nanopharmaceuticals—lipoic acid bioconjugates of ultrasmall gold nanoparticles with an anticancer drug and addressing unit. RSC Adv. 2018, 8, 14947–14957. [Google Scholar] [CrossRef] [Green Version]
- Keihan, A.H.; Veisi, H.; Biabri, P.M. Facile synthesis of PEG-coated magnetite (Fe3O4) and embedment of gold nanoparticle as a nontoxic antimicrobial agent. Appl. Organomet. Chem. 2017, 31, e3873. [Google Scholar] [CrossRef]
- Ghaziyani, M.F.; Moghaddam, M.P.; Shahbazi-Gahrouei, D.; Ghavami, M.; Mohammadi, A.; Abbasi, M.M.; Baradaran, B. Anti-CD24 bio Modified PEGylated Gold Nanoparticles as Targeted Computed Tomography Contrast Agent. Adv. Pharm. Bull. 2018, 8, 599–607. [Google Scholar] [CrossRef]
- Pyne, A.; Nandi, S.; Ghosh, M.; Roy, T.; Dhara, S.; Sarkar, N. Denaturant-Mediated Modulation of the Formation and Drug Encapsulation Responses of Gold Nanoparticles. Langmuir 2020, 36, 7634–7647. [Google Scholar] [CrossRef]
- Vairavel, M.; Devaraj, E.; Shanmugam, R. An eco-friendly synthesis of Enterococcus sp.–mediated gold nanoparticle induces cytotoxicity in human colorectal cancer cells. Environ. Sci. Pollut. Res. 2020, 27, 8166–8175. [Google Scholar] [CrossRef]
- Ahmeda, A.; Zangeneh, A.; Zangeneh, M.M. Green synthesis and chemical characterization of gold nanoparticle synthesized using Camellia sinensis leaf aqueous extract for the treatment of acute myeloid leukemia in comparison to daunorubicin in a leukemic mouse model. Appl. Organomet. Chem. 2020, 34, 5290. [Google Scholar] [CrossRef]
- Bhowmik, T.; Gomes, A. Down–regulation of cyclin–dependent kinase-4 and MAPK through estrogen receptor mediated cell cycle arrest in human breast cancer induced by gold nanoparticle tagged toxin protein NKCT1. Chem. Interactions 2017, 268, 119–128. [Google Scholar] [CrossRef]
- Balakrishnan, S.; Bhat, F.A.; Singh, P.R.; Mukherjee, S.; Elumalai, P.; Das, S.; Patra, C.R.; Arunakaran, J. Gold nanoparticle-conjugated quercetin inhibits epithelial-mesenchymal transition, angiogenesis and invasiveness via EGFR/VEGFR-2-mediated pathway in breast cancer. Cell Prolif. 2016, 49, 678–697. [Google Scholar] [CrossRef]
- Ghorbani, M.; Hamishehkar, H. Decoration of gold nanoparticles with thiolated pH-responsive polymeric (PEG-bp (2-dimethylamio ethyl methacrylate-co-itaconic acid) shell: A novel platform for targeting of anticancer agent. Mater. Sci. Eng. C 2017, 81, 561–570. [Google Scholar] [CrossRef]
- Wang, H.; Jiang, W.; Yuan, L.; Wang, L.; Chen, H. Reductase-like Activity of Silicon Nanowire Arrays. ACS Appl. Mater. Interfaces 2013, 5, 1800–1805. [Google Scholar] [CrossRef]
- Turnbull, T.; Thierry, B.; Kempson, I. A quantitative study of intercellular heterogeneity in gold nanoparticle uptake across multiple cell lines. Anal. Bioanal. Chem. 2019, 411, 7529–7538. [Google Scholar] [CrossRef]
- Turnbull, T.; Douglass, M.; Williamson, N.H.; Howard, D.; Bhardwaj, R.; Lawrence, M.; Paterson, D.J.; Bezak, E.; Thierry, B.; Kempson, I.M. Cross-Correlative Single-Cell Analysis Reveals Biological Mechanisms of Nanoparticle Radiosensitization. ACS Nano 2019, 13, 5077–5090. [Google Scholar] [CrossRef]
- Huynh, M.; Kempson, I.; Bezak, E.; Phillips, W. Predictive modeling of hypoxic head and neck cancers during fractionated radiotherapy with gold nanoparticle radiosensitization. Med. Phys. 2021, 48, 3120–3133. [Google Scholar] [CrossRef]
- Molinari, B.L.; Tasat, D.R.; Palmieri, M.A.; Cabrini, R.L. Kinetics of MTT-formazan exocytosis in phagocytic and non-phagocytic cells. Micron 2005, 36, 177–183. [Google Scholar] [CrossRef]
- Turkevich, J.; Stevenson, P.C.; Hillier, J. A study of the nucleation and growth processes in the synthesis of colloidal gold. Discuss. Faraday Soc. 1951, 11, 55–75. [Google Scholar] [CrossRef]


| Does the MTT assay represent what you aim to measure? Have you optimized the following parameters?
Are any effects of tested treatments considered that could affect the final OD measurements in a direct or indirect way?
|
| If your aim is a quantitative measurement of cell viability, have you defined how OD values relate to the number of cells? |
Based on your answers to the above questions:
|
Publisher’s Note: MDPI stays neutral with regard to jurisdictional claims in published maps and institutional affiliations. |
© 2021 by the authors. Licensee MDPI, Basel, Switzerland. This article is an open access article distributed under the terms and conditions of the Creative Commons Attribution (CC BY) license (https://creativecommons.org/licenses/by/4.0/).
Share and Cite
Ghasemi, M.; Turnbull, T.; Sebastian, S.; Kempson, I. The MTT Assay: Utility, Limitations, Pitfalls, and Interpretation in Bulk and Single-Cell Analysis. Int. J. Mol. Sci. 2021, 22, 12827. https://doi.org/10.3390/ijms222312827
Ghasemi M, Turnbull T, Sebastian S, Kempson I. The MTT Assay: Utility, Limitations, Pitfalls, and Interpretation in Bulk and Single-Cell Analysis. International Journal of Molecular Sciences. 2021; 22(23):12827. https://doi.org/10.3390/ijms222312827
Chicago/Turabian StyleGhasemi, Mahshid, Tyron Turnbull, Sonia Sebastian, and Ivan Kempson. 2021. "The MTT Assay: Utility, Limitations, Pitfalls, and Interpretation in Bulk and Single-Cell Analysis" International Journal of Molecular Sciences 22, no. 23: 12827. https://doi.org/10.3390/ijms222312827