Cathepsin Inhibition Modulates Metabolism and Polarization of Tumor-Associated Macrophages

 , and
, and 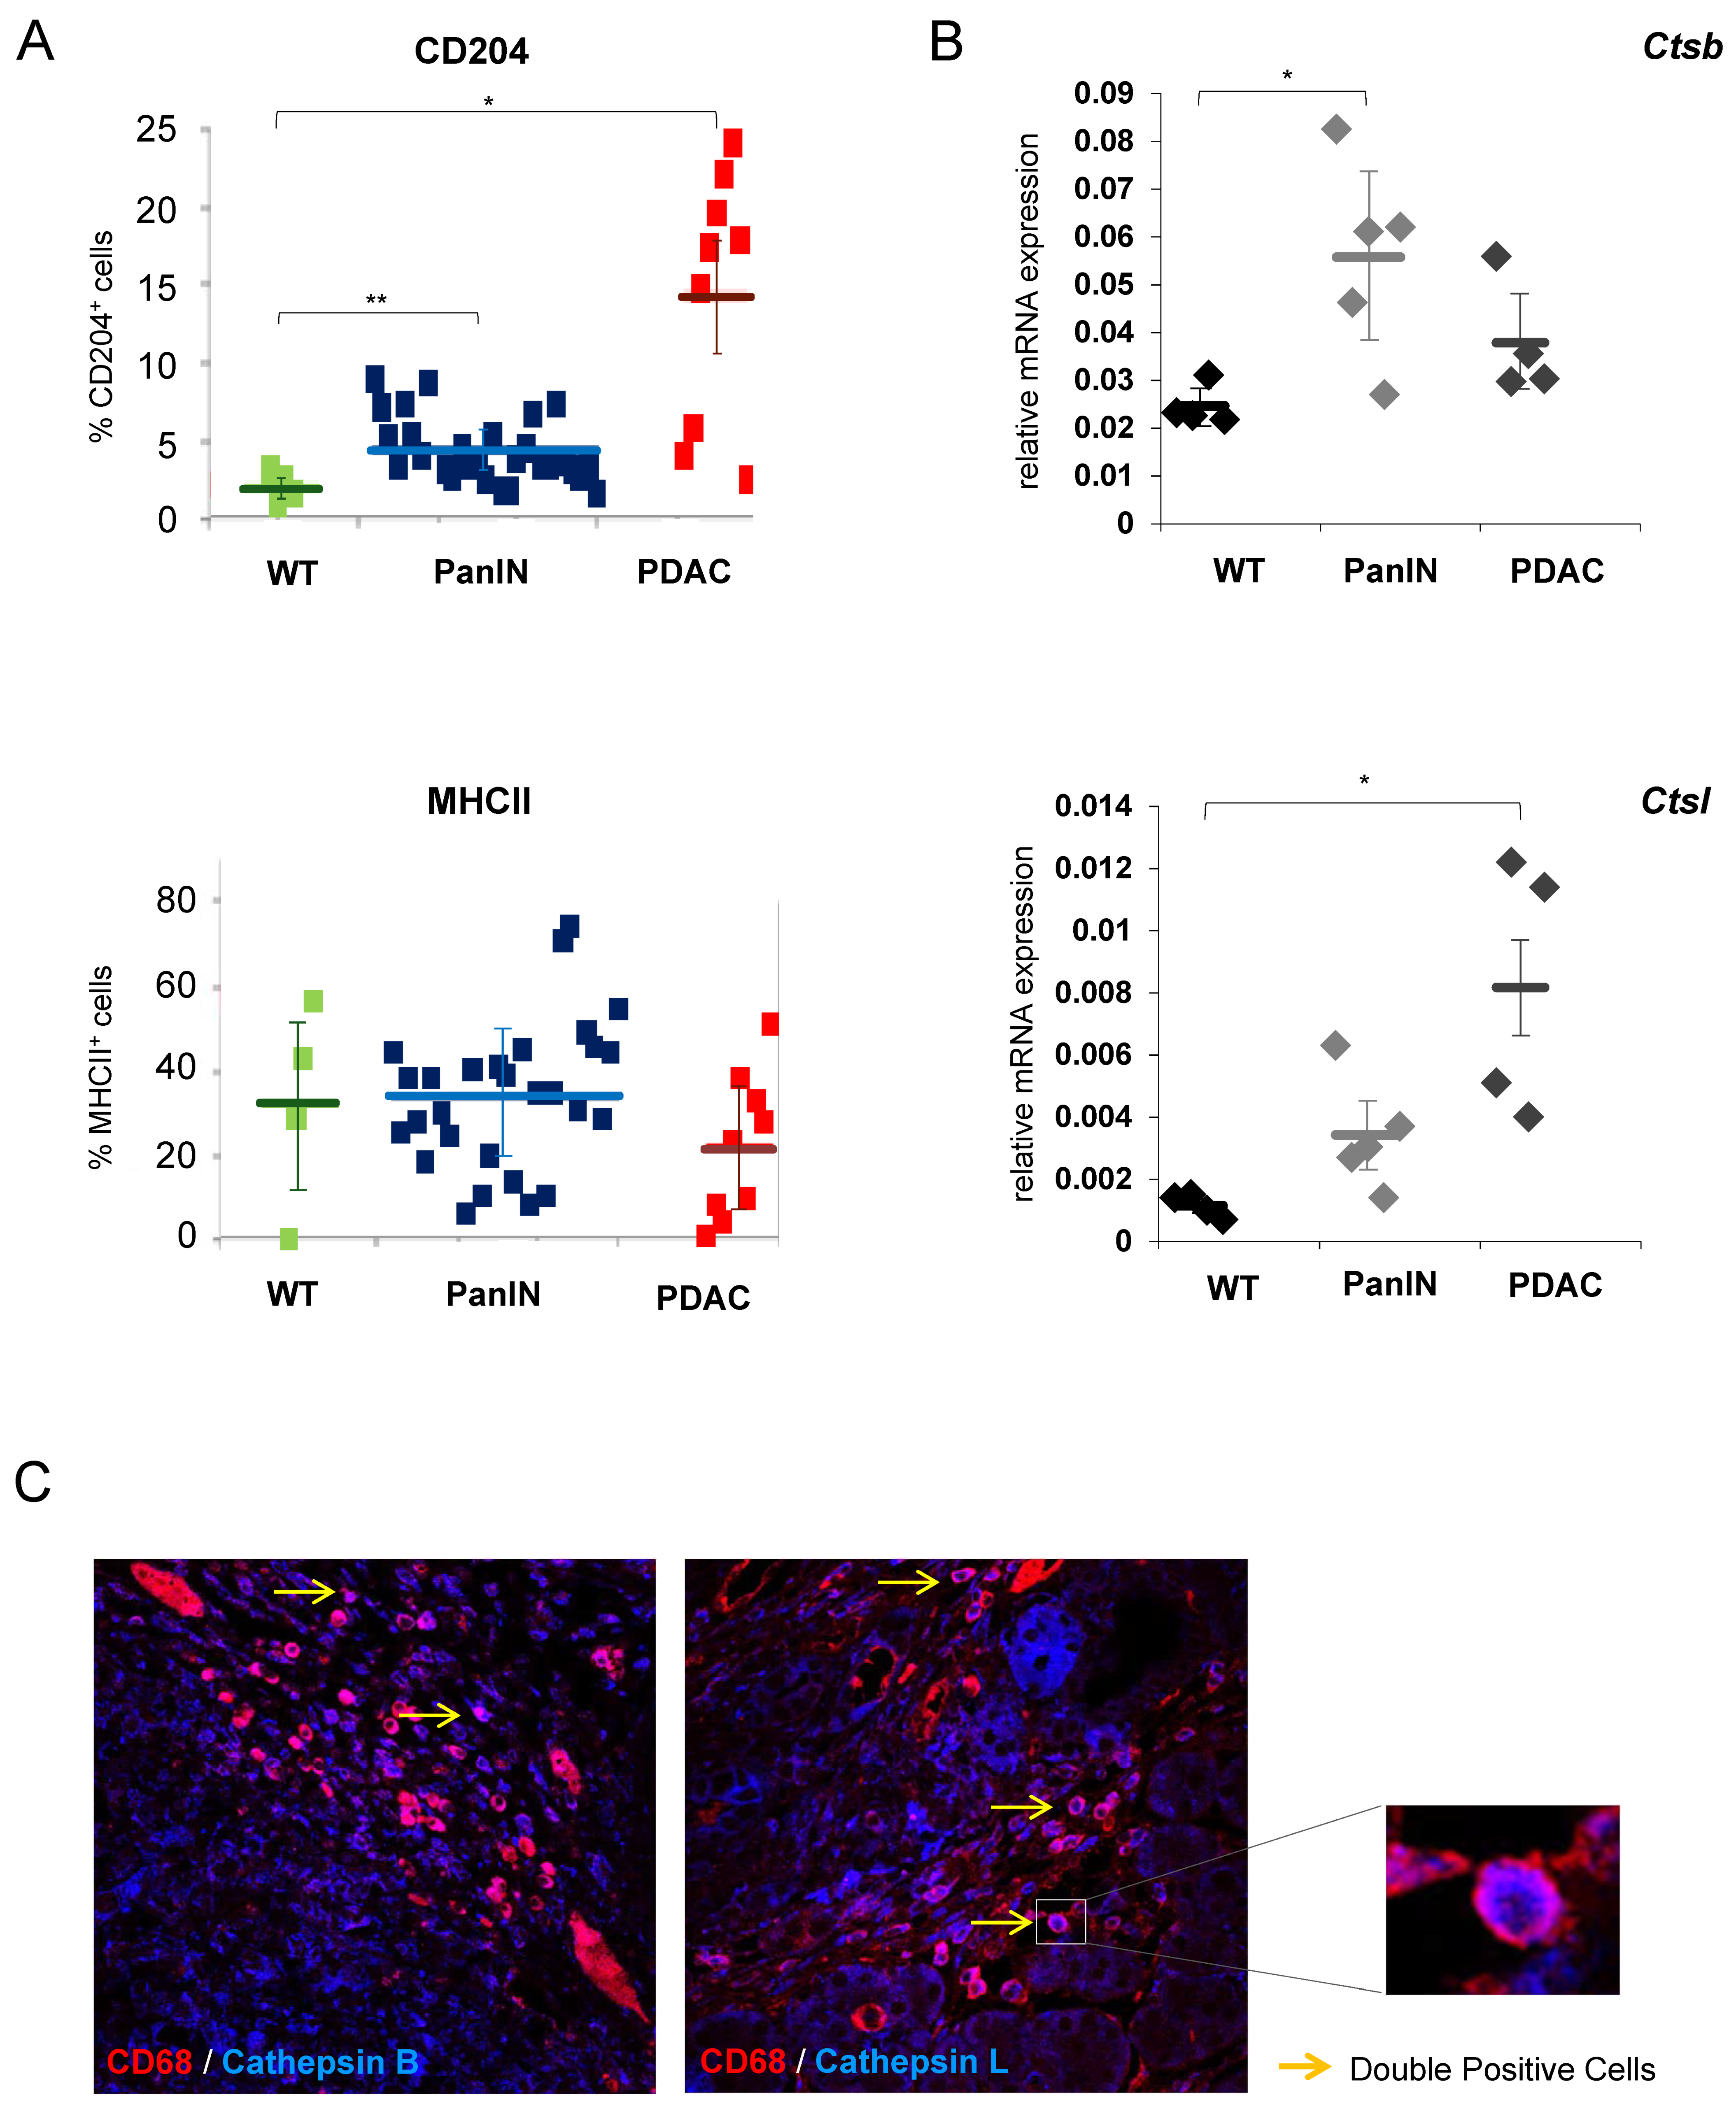
Abstract
:Simple Summary
Abstract
1. Introduction
2. Materials and Methods
2.1. Isolation of CD11b+ Macrophages from Murine Pancreas
2.2. Isolation and Polarization of Human Monocytes
2.3. Inhibition of Cathepsin Activity
2.4. Fluorescent Imaging and Immunoblotting
2.5. RNA Isolation, cDNA Synthesis, and Quantitative Real-Time PCR (qPCR)
2.6. Flow Cytometry Analysis of Murine CD11b+ Macrophages and Human CD14+ Monocytes
2.7. Immunofluorescence Microscopy
2.8. Cell Viability Assay
2.9. Mass Spectrometry
2.10. Enzyme-Linked Immunosorbent Assay (ELISA) of Prostaglandin E2 (PGE2)
2.11. Statistical Analysis
3. Results
3.1. Cathepsins B and L Expression in Tumor-Infiltrating Macrophages Is Increased during Pancreatic Carcinogenesis
3.2. Effective Inhibition of Cathepsin B, L, and S Activity in Macrophages
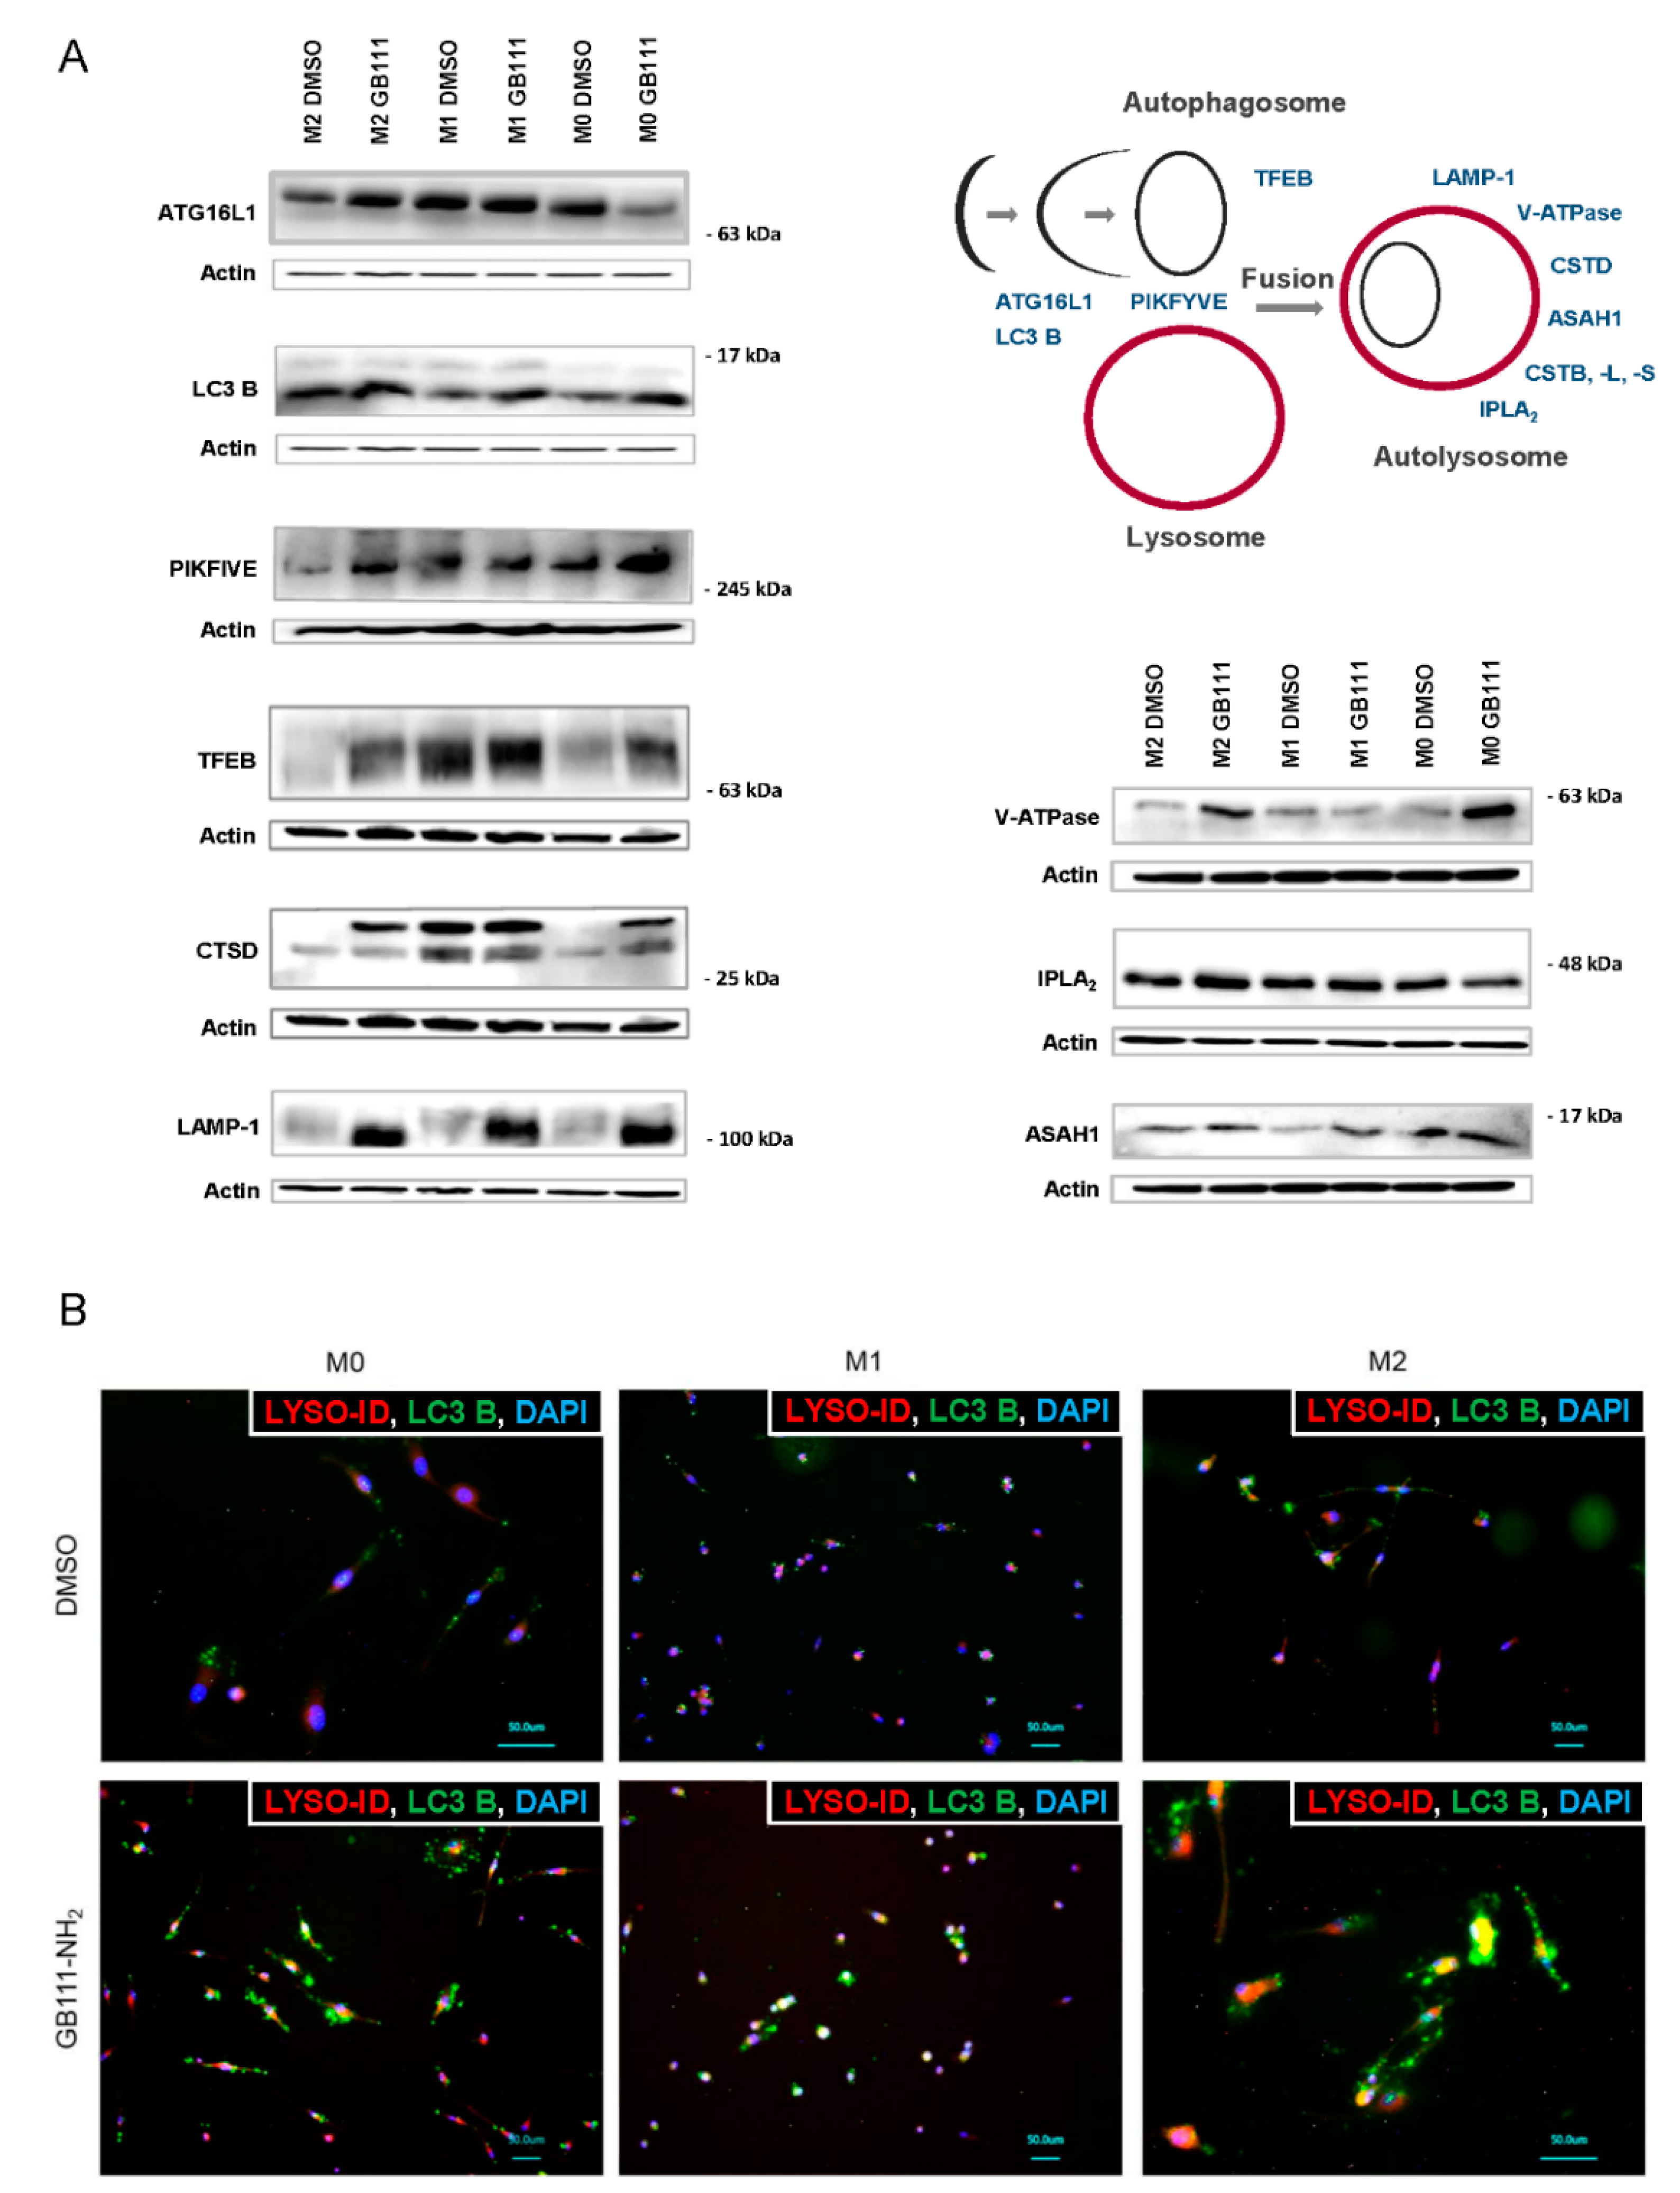
3.3. Cathepsin Inhibition Leads to Disturbed Cellular Recycling Processes
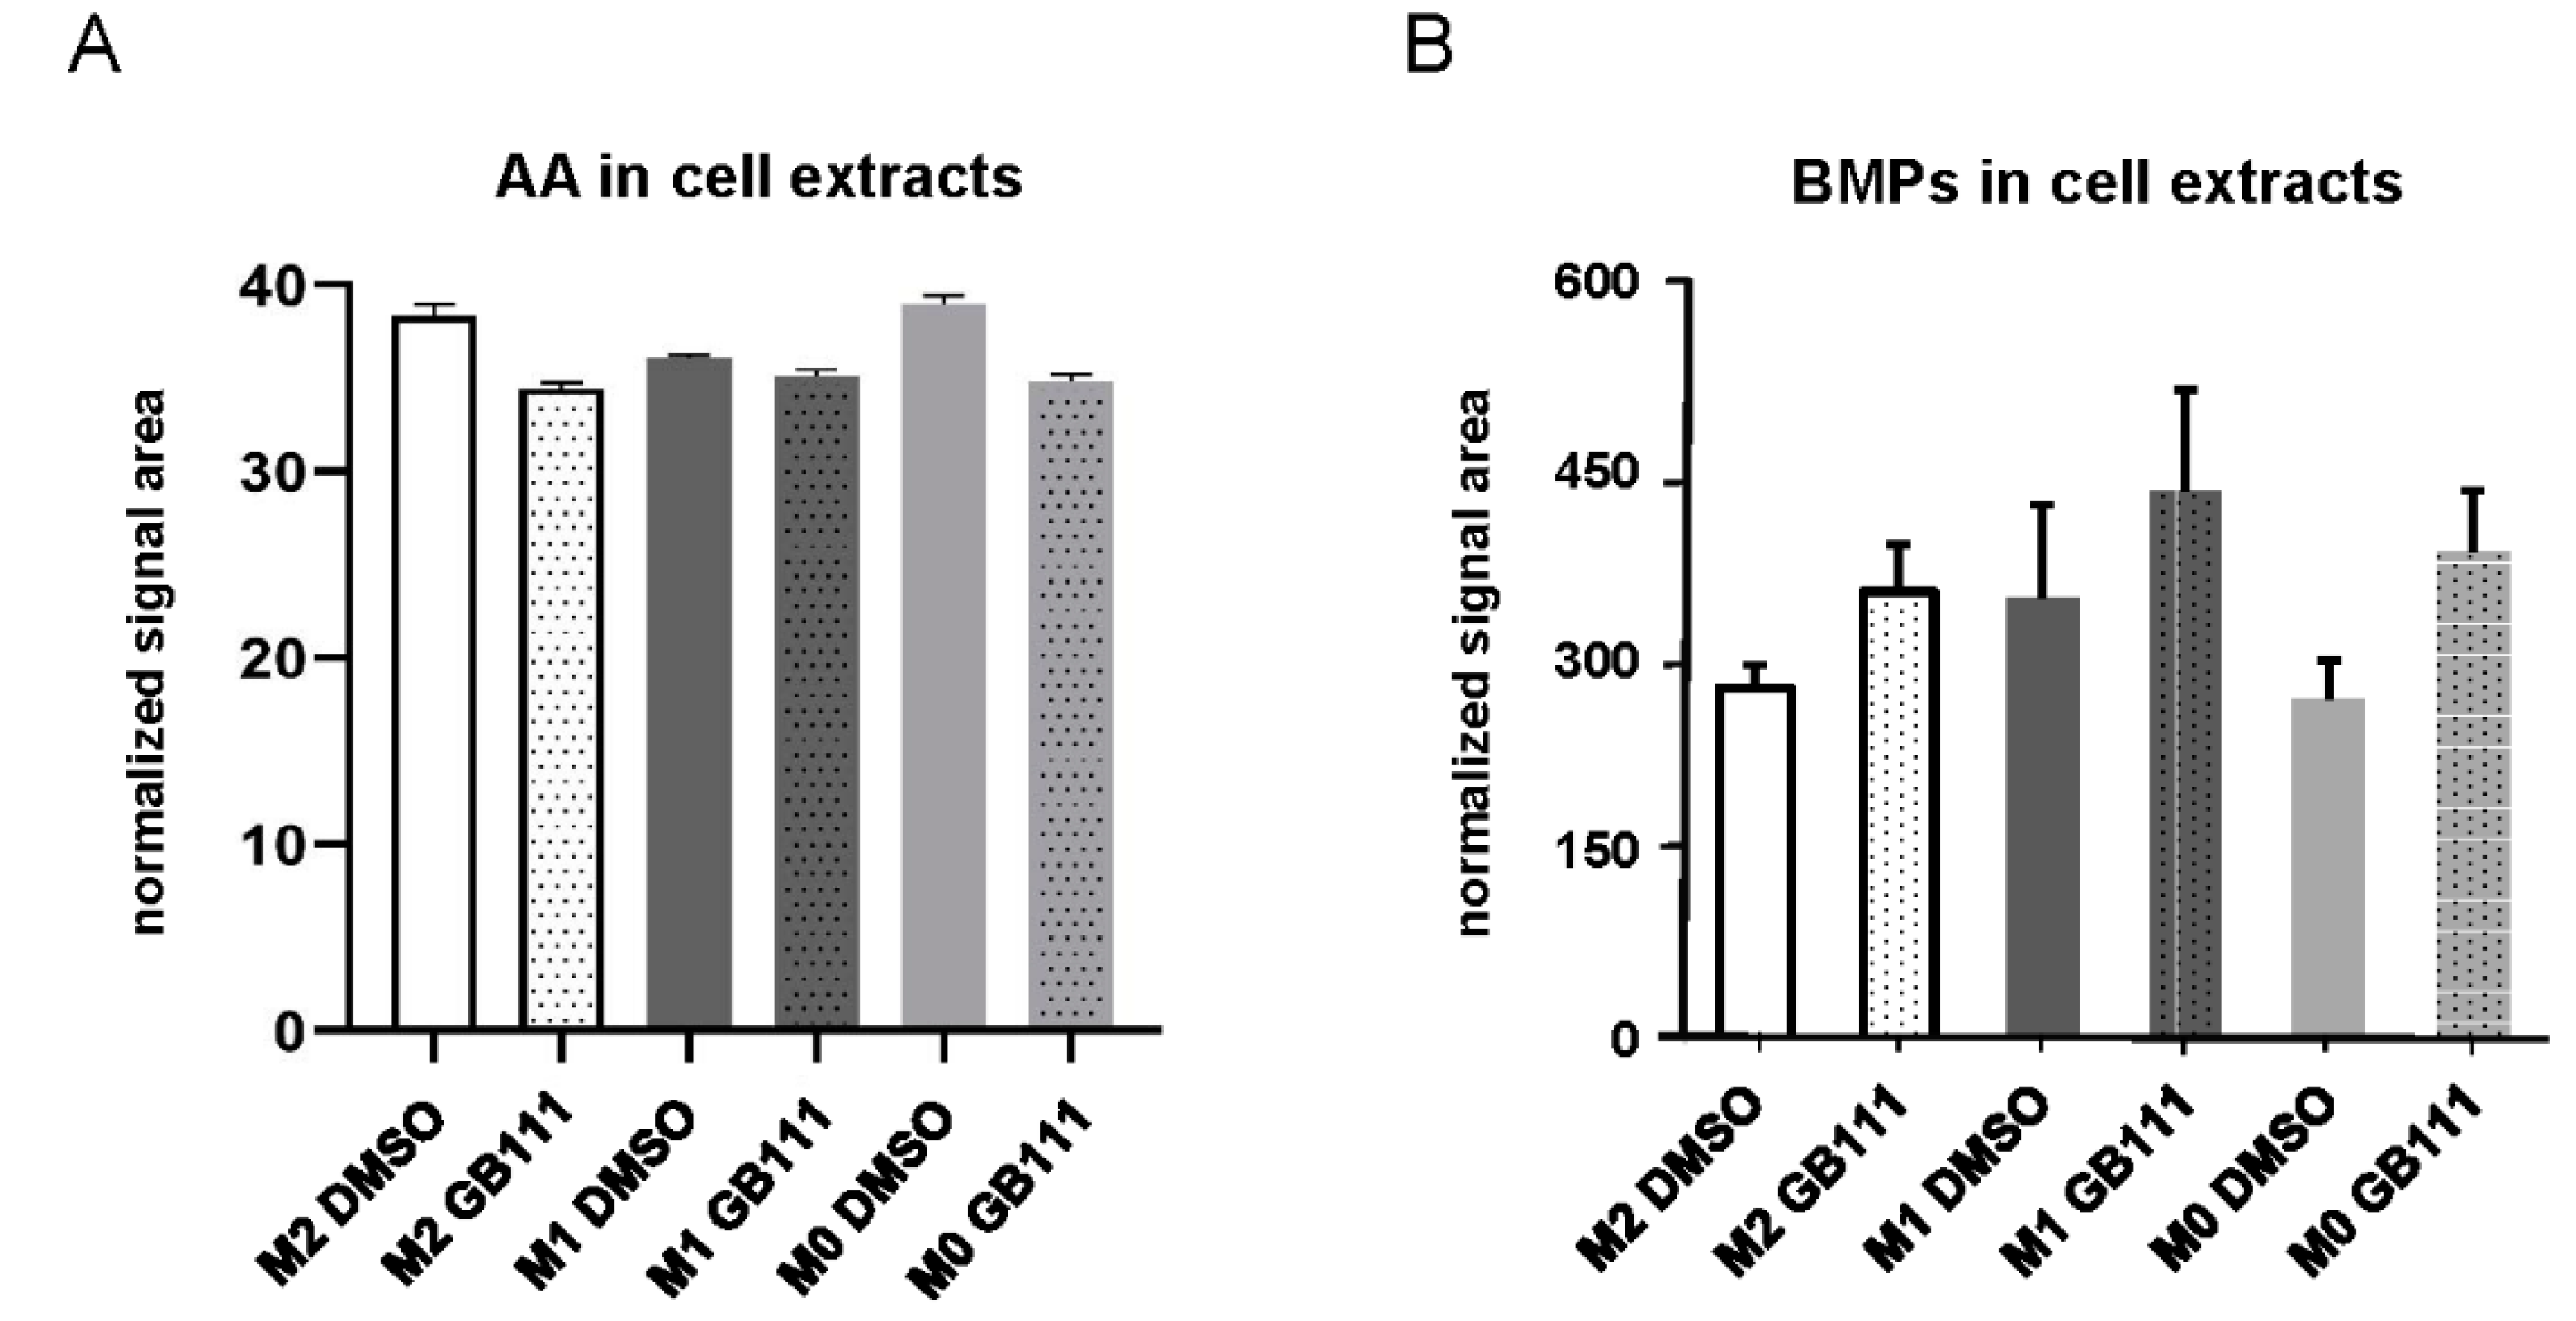
3.4. Cathepsin Inhibition Correlates with Changes in the Cellular Fatty Acid and Phospholipid Profile
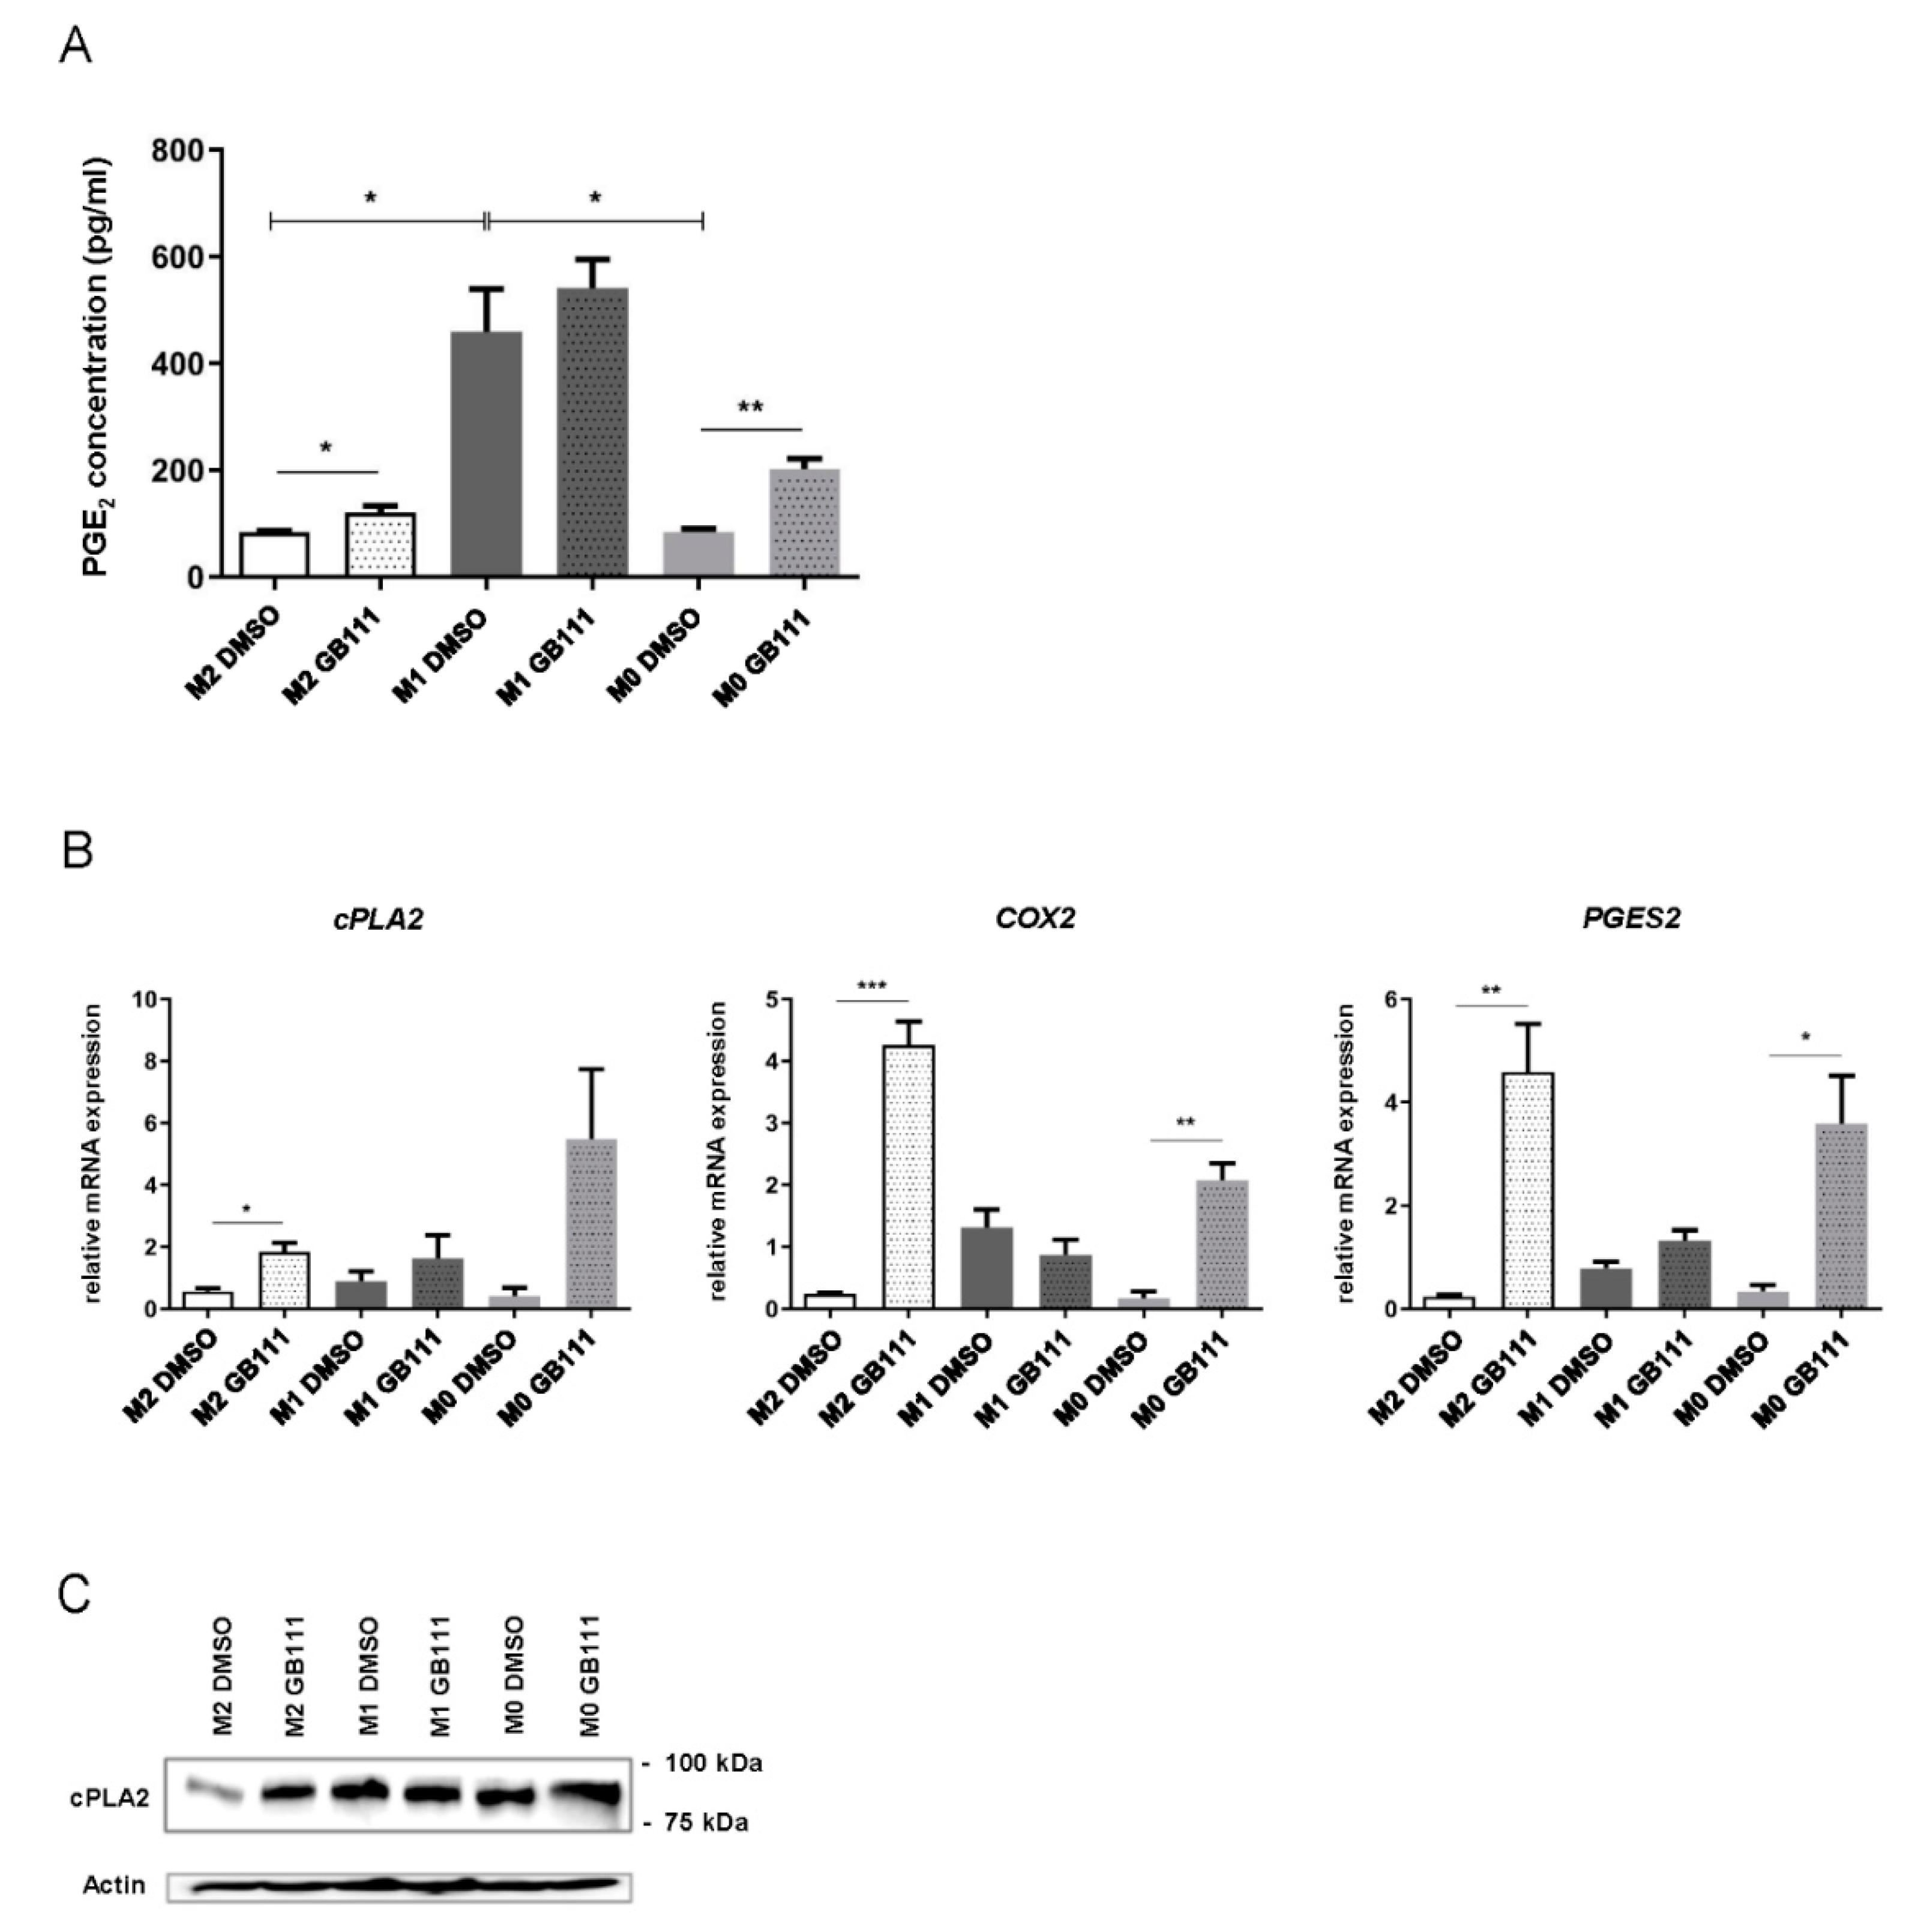
3.5. Changes in the Fatty Acid Profile Are Associated with an Increased Synthesis of the Pro-Inflammatory Mediator Prostaglandin E2
3.6. Cathepsin Inhibition Is Associated with an Enhanced Expression of Pro-Inflammatory and Fatty Acid Metabolism-Associated Genes
4. Discussion
5. Conclusions
Supplementary Materials
Author Contributions
Funding
Acknowledgments
Conflicts of Interest
References
- Solinas, G.; Germano, G.; Mantovani, A.; Allavena, P. Tumor-associated macrophages (TAM) as major players of the cancer-related inflammation. J. Leukoc. Biol. 2009, 86, 1065–1073. [Google Scholar] [CrossRef] [PubMed] [Green Version]
- Mielgo, A.; Schmid, M.C. Impact of tumour associated macrophages in pancreatic cancer. BMB Rep. 2013, 46, 131. [Google Scholar] [CrossRef] [PubMed] [Green Version]
- Kurahara, H.; Shinchi, H.; Mataki, Y.; Maemura, K.; Noma, H.; Kubo, F.; Sakoda, M.; Ueno, S.; Natsugoe, S.; Takao, S. Significance of M2-polarized tumor-associated macrophage in pancreatic cancer. J. Surg. Res. 2011, 167, e211–e219. [Google Scholar] [CrossRef] [PubMed]
- Yoshikawa, K.; Mitsunaga, S.; Kinoshita, T.; Konishi, M.; Takahashi, S.; Gotohda, N.; Kato, Y.; Aizawa, M.; Ochiai, A. Impact of tumor-associated macrophages on invasive ductal carcinoma of the pancreas head. Cancer Sci. 2012, 103, 2012–2020. [Google Scholar] [CrossRef]
- Chanmee, T.; Ontong, P.; Konno, K.; Itano, N. Tumor-associated macrophages as major players in the tumor microenvironment. Cancers 2014, 6, 1670–1690. [Google Scholar] [CrossRef] [Green Version]
- Kuester, D.; Lippert, H.; Roessner, A.; Krueger, S. The cathepsin family and their role in colorectal cancer. Pathol. Res. Pract. 2008, 204, 491–500. [Google Scholar] [CrossRef]
- Cook, J.; Hagemann, T. Tumour-associated macrophages and cancer. Curr. Opin. Pharmacol. 2013, 13, 595–601. [Google Scholar] [CrossRef]
- Gocheva, V.; Wang, H.; Gadea, B.B.; Shree, T.; Hunter, K.E.; Garfall, A.L.; Berman, T.; Joyce, J.A. IL-4 induces cathepsin protease activity in tumor-associated macrophages to promote cancer growth and invasion. Genes Dev. 2010, 24, 241–255. [Google Scholar] [CrossRef] [Green Version]
- Sica, A.; Mantovani, A. Macrophage plasticity and polarization. In vivo veritas. J. Clin. Investig. 2012, 122, 787–795. [Google Scholar] [CrossRef]
- Galli, S.J.; Borregaard, N.; Wynn, T.A. Phenotypic and functional plasticity of cells of innate immunity. Macrophages, mast cells and neutrophils. Nat. Immunol. 2011, 12, 1035. [Google Scholar] [CrossRef] [Green Version]
- Stout, R.D.; Suttles, J. Functional plasticity of macrophages. Reversible adaptation to changing microenvironments. J. Leukoc. Biol. 2004, 76, 509–513. [Google Scholar] [CrossRef]
- Zheng, L.; Xue, J.; Jaffee, E.M.; Habtezion, A. Role of Immune Cells and Immune-Based Therapies in Pancreatitis and Pancreatic Ductal Adenocarcinoma. Gastroenterology 2013, 144, 1230–1240. [Google Scholar] [CrossRef] [PubMed] [Green Version]
- Smith, H.A.; Kang, Y. The metastasis-promoting roles of tumor-associated immune cells. J. Mol. Med. 2013, 91, 411–429. [Google Scholar] [CrossRef] [PubMed]
- Azizi, E.; Carr, A.J.; Plitas, G.; Cornish, A.E.; Konopacki, C.; Prabhakaran, S.; Nainys, J.; Wu, K.; Kiseliovas, V.; Setty, M.; et al. Single-cell Map of Diverse Immune Phenotypes in the Breast Tumor Microenvironment. Cell 2018, 174, 1293–1308. [Google Scholar] [CrossRef] [Green Version]
- Allavena, P.; Sica, A.; Solinas, G.; Porta, C.; Mantovani, A. The inflammatory micro-environment in tumor progression. The role of tumor-associated macrophages. Crit. Rev. Oncol. Hematol. 2008, 66, 1–9. [Google Scholar] [CrossRef] [PubMed]
- Biswas, S.K.; Sica, A.; Lewis, C.E. Plasticity of Macrophage Function during Tumor Progression. Regulation by Distinct Molecular Mechanisms. J. Immunol. 2008, 180, 2011–2017. [Google Scholar] [CrossRef]
- Shree, T.; Olson, O.C.; Elie, B.T.; Kester, J.C.; Garfall, A.L.; Simpson, K.; Bell-McGuinn, K.M.; Zabor, E.C.; Brogi, E.; Joyce, J.A. Macrophages and cathepsin proteases blunt chemotherapeutic response in breast cancer. Genes Dev. 2011, 25, 2465–2479. [Google Scholar] [CrossRef] [Green Version]
- Turk, V.; Stoka, V.; Vasiljeva, O.; Renko, M.; Sun, T.; Turk, B.; Turk, D. Cysteine cathepsins. From structure, function and regulation to new frontiers. Biochim. Biophys. Acta 2012, 1824, 68–88. [Google Scholar] [CrossRef] [Green Version]
- Kirschke, H.; Wiederanders, B.; Brömme, D.; Rinne, A. Cathepsin S from bovine spleen. Purification, distribution, intracellular localization and action on proteins. Biochem. J. 1989, 264, 467–473. [Google Scholar] [CrossRef] [Green Version]
- Vasiljeva, O.; Reinheckel, T.; Peters, C.; Turk, D.; Turk, V.; Turk, B. Emerging Roles of Cysteine Cathepsins in Disease and their Potential as Drug Targets. Curr. Pharm. Des. 2007, 13, 387–403. [Google Scholar] [CrossRef]
- Settembre, C.; Fraldi, A.; Medina, D.L.; Ballabio, A. Signals from the lysosome. A control centre for cellular clearance and energy metabolism. Nat. Rev. Mol. Cell Biol. 2013, 14, 283. [Google Scholar] [CrossRef] [PubMed] [Green Version]
- Jin, S.; White, E. Role of Autophagy in Cancer. Management of Metabolic Stress. Autophagy 2014, 3, 28–31. [Google Scholar] [CrossRef] [PubMed] [Green Version]
- Saftig, P.; Klumperman, J. Lysosome biogenesis and lysosomal membrane proteins. Trafficking meets function. Nat. Rev. Mol. Cell Biol. 2009, 10, 623. [Google Scholar] [CrossRef] [PubMed]
- Shintani, T.; Klionsky, D.J. Autophagy in Health and Disease. A Double-Edged Sword. Science 2004, 306, 990–995. [Google Scholar] [CrossRef] [Green Version]
- Kourtis, N.; Tavernarakis, N. Autophagy and cell death in model organisms. Cell Death Differ. 2009, 16, 21. [Google Scholar] [CrossRef] [Green Version]
- Rabinowitz, J.D.; White, E. Autophagy and Metabolism. Science 2010, 330, 1344–1348. [Google Scholar] [CrossRef] [Green Version]
- Chen, P.; Cescon, M.; Bonaldo, P. Autophagy-mediated regulation of macrophages and its applications for cancer. Autophagy 2014, 10, 192–200. [Google Scholar] [CrossRef] [PubMed]
- Salpeter, S.J.; Pozniak, Y.; Merquiol, E.; Ben-Nun, Y.; Geiger, T.; Blum, G. A novel cysteine cathepsin inhibitor yields macrophage cell death and mammary tumor regression. Oncogene 2015, 34, 6066. [Google Scholar] [CrossRef]
- Blum, G.; Von Degenfeld, G.; Merchant, M.J.; Blau, H.M.; Bogyo, M. Noninvasive optical imaging of cysteine protease activity using fluorescently quenched activity-based probes. Nat. Chem. Biol. 2007, 3, 668. [Google Scholar] [CrossRef]
- Ben-Aderet, L.; Merquiol, E.; Fahham, D.; Kumar, A.; Reich, E.; Ben-Nun, Y.; Kandel, L.; Haze, A.; Liebergall, M.; Kosińska, M.K.; et al. Detecting cathepsin activity in human osteoarthritis via activity-based probes. Arthritis Res. Ther. 2015, 17, 69. [Google Scholar] [CrossRef] [Green Version]
- Ripka, S.; Neesse, A.; Riedel, J.; Bug, E.; Aigner, A.; Poulsom, R.; Fulda, S.; Neoptolemos, J.; Greenhalf, W.; Barth, P.; et al. CUX1. Target of Akt signalling and mediator of resistance to apoptosis in pancreatic cancer. Gut 2010, 59, 1101–1110. [Google Scholar] [CrossRef]
- Bligh, E.G.; Dyer, W.J. A rapid method of total lipid extraction and purification. Can. J. Biochem. Physiol. 1959, 37, 911–917. [Google Scholar] [CrossRef] [PubMed] [Green Version]
- Löfgren, L.; Forsberg, G.-B.; Ståhlman, M. The BUME method. A new rapid and simple chloroform-free method for total lipid extraction of animal tissue. Sci. Rep. 2016, 6, 27688. [Google Scholar] [CrossRef] [PubMed] [Green Version]
- Mühlberg, L.; Kühnemuth, B.; Costello, E.; Shaw, V.; Sipos, B.; Huber, M.; Griesmann, H.; Krug, S.; Schober, M.; Gress, T.M.; et al. miRNA dynamics in tumor-infiltrating myeloid cells modulating tumor progression in pancreatic cancer. Oncoimmunology 2016, 5, e1160181. [Google Scholar] [CrossRef] [PubMed] [Green Version]
- Weiss-Sadan, T.; Maimoun, D.; Oelschlaegel, D.; Kaschani, F.; Misiak, D.; Gaikwad, H.; Ben-Nun, Y.; Merquiol, E.; Anaki, A.; Tsvirkun, D.; et al. Cathepsins Drive Anti-Inflammatory Activity by Regulating Autophagy and Mitochondrial Dynamics in Macrophage Foam Cells. Cell. Physiol. Biochem. 2019, 53, 550–572. [Google Scholar] [CrossRef] [Green Version]
- Yang, M.; Liu, J.; Shao, J.; Qin, Y.; Ji, Q.; Zhang, X.; Du, J. Cathepsin S-mediated autophagic flux in tumor-associated macrophages accelerate tumor development by promoting M2 polarization. Mol. Cancer 2014, 13, 43. [Google Scholar] [CrossRef] [Green Version]
- Van den Bossche, J.; O’Neill, L.A.; Menon, D. Macrophage Immunometabolism. Where Are We (Going)? Trends Immunol. 2017, 38, 395–406. [Google Scholar] [CrossRef]
- O’Neill, L.A.J.; Pearce, E.J. Immunometabolism governs dendritic cell and macrophage function. J. Exp. Med. 2016, 213, 15–23. [Google Scholar] [CrossRef]
- Schulze, H.; Kolter, T.; Sandhoff, K. Principles of lysosomal membrane degradation. Cellular topology and biochemistry of lysosomal lipid degradation. Biochim. Biophys. Acta 2009, 1793, 674–683. [Google Scholar] [CrossRef] [Green Version]
- Scherer, M.; Schmitz, G. Metabolism, function and mass spectrometric analysis of bis(monoacylglycero)phosphate and cardiolipin. Chem. Phys. Lipids 2011, 164, 556–562. [Google Scholar] [CrossRef]
- Ariasnegrete, S.; Keller, K.; Chadee, K. Proinflammatory Cytokines Regulate Cyclooxygenase-2 mRNA Expression in Human Macrophages. Biochem. Biophys. Res. Commun. 1995, 208, 582–589. [Google Scholar] [CrossRef] [PubMed]
- Hanna, V.S.; Hafez, E.A.A. Synopsis of arachidonic acid metabolism: A review. J. Adv. Res. 2018, 11, 23–32. [Google Scholar] [CrossRef] [PubMed]
- Ménégaut, L.; Thomas, C.; Lagrost, L.; Masson, D. Fatty acid metabolism in macrophages. A target in cardio-metabolic diseases. Curr. Opin. Lipidol. 2017, 28, 19–26. [Google Scholar] [CrossRef] [PubMed]
- Rabold, K.; Netea, M.G.; Adema, G.J.; Netea-Maier, R.T. Cellular metabolism of tumor-associated macrophages - functional impact and consequences. FEBS Lett. 2017, 591, 3022–3041. [Google Scholar] [CrossRef] [PubMed] [Green Version]
- Cui, R.; Yue, W.; Lattime, E.C.; Stein, M.N.; Xu, Q.; Tan, X.-L. Targeting tumor-associated macrophages to combat pancreatic cancer. Oncotarget 2016, 7, 50735–50754. [Google Scholar] [CrossRef] [PubMed] [Green Version]
- Lankadasari, M.B.; Mukhopadhyay, P.; Mohammed, S.; Harikumar, K.B. TAMing pancreatic cancer: Combat with a double edged sword. Mol. Cancer 2019, 18, 48. [Google Scholar] [CrossRef] [Green Version]
- Jakoš, T.; Pišlar, A.; Jewett, A.; Kos, J. Cysteine Cathepsins in Tumor-Associated Immune Cells. Front. Immunol. 2019, 10, 2037. [Google Scholar] [CrossRef] [Green Version]
- Rawlings, N.D.; Barrett, A.J.; Thomas, P.D.; Huang, X.; Bateman, A.; Finn, R.D. The MEROPS database of proteolytic enzymes, their substrates and inhibitors in 2017 and a comparison with peptidases in the PANTHER database. Nucleic Acids Res. 2018, 46, D624–D632. [Google Scholar] [CrossRef]
- Reiser, J.; Adair, B.; Reinheckel, T. Specialized roles for cysteine cathepsins in health and disease. J. Clin. Investig. 2010, 120, 3421–3431. [Google Scholar] [CrossRef] [Green Version]
- Goulet, B.; Baruch, A.; Moon, N.-S.; Poirier, M.; Sansregret, L.L.; Erickson, A.; Bogyo, M.; Nepveu, A. A Cathepsin L Isoform that Is Devoid of a Signal Peptide Localizes to the Nucleus in S Phase and Processes the CDP/Cux Transcription Factor. Mol. Cell 2004, 14, 207–219. [Google Scholar] [CrossRef]
- Adams-Cioaba, M.A.; Krupa, J.C.; Xu, C.; Mort, J.S.; Min, J. Structural basis for the recognition and cleavage of histone H3 by cathepsin L. Nat. Commun. 2011, 2, 197. [Google Scholar] [CrossRef] [PubMed] [Green Version]
- Maubach, G.; Lim, M.C.C.; Zhuo, L. Nuclear cathepsin F regulates activation markers in rat hepatic stellate cells. Mol. Biol. Cell 2008, 19, 4238–4248. [Google Scholar] [CrossRef] [Green Version]
- Tedelind, S.; Poliakova, K.; Valeta, A.; Hunegnaw, R.; Yemanaberhan, E.L.; Heldin, N.-E.; Kurebayashi, J.; Weber, E.; Kopitar-Jerala, N.; Turk, B.; et al. Nuclear cysteine cathepsin variants in thyroid carcinoma cells. Biol. Chem. 2010, 391, 923–935. [Google Scholar] [CrossRef] [Green Version]
- Campden, R.I.; Zhang, Y. The role of lysosomal cysteine cathepsins in NLRP3 inflammasome activation. Arch. Biochem. Biophys. 2019, 670, 32–42. [Google Scholar] [CrossRef] [PubMed]
- Mestas, J.; Hughes, C.C.W. Of Mice and Not Men. Differences between Mouse and Human Immunology. J. Immunol. 2004, 172, 2731–2738. [Google Scholar] [CrossRef] [PubMed] [Green Version]
- McWhorter, F.Y.; Wang, T.; Nguyen, P.; Chung, T.; Liu, W.F. Modulation of macrophage phenotype by cell shape. Proc. Natl. Acad. Sci. USA 2013, 110, 17253–17258. [Google Scholar] [CrossRef] [Green Version]
- McWhorter, F.Y.; Davis, C.T.; Liu, W.F. Physical and mechanical regulation of macrophage phenotype and function. Cell. Mol. Life Sci. 2015, 72, 1303–1316. [Google Scholar] [CrossRef] [Green Version]
- Ballotta, V.; Driessen-Mol, A.; Bouten, C.V.C.; Baaijens, F.P.T. Strain-dependent modulation of macrophage polarization within scaffolds. Biomaterials 2014, 35, 4919–4928. [Google Scholar] [CrossRef]
- Vereyken, E.J.F.; Heijnen, P.D.A.M.; Baron, W.; de Vries, E.H.E.; Dijkstra, C.D.; Teunissen, C.E. Classically and alternatively activated bone marrow derived macrophages differ in cytoskeletal functions and migration towards specific CNS cell types. J. Neuroinflamm. 2011, 8, 58. [Google Scholar] [CrossRef] [Green Version]
- Sanman, L.E.; Qian, Y.; Eisele, N.A.; Ng, T.M.; van der Linden, W.A.; Monack, D.M.; Weerapana, E.; Bogyo, M. Disruption of glycolytic flux is a signal for inflammasome signaling and pyroptotic cell death. eLife 2016, 5, e13663. [Google Scholar] [CrossRef]
- Niedergethmann, M.; Wostbrock, B.; Sturm, J.W.; Willeke, F.; Post, S.; Hildenbrand, R. Prognostic impact of cysteine proteases cathepsin B and cathepsin L in pancreatic adenocarcinoma. Pancreas 2004, 29, 204–211. [Google Scholar] [CrossRef] [PubMed]
- Joyce, J.A.; Baruch, A.; Chehade, K.; Meyer-Morse, N.; Giraudo, E.; Tsai, F.Y.; Greenbaum, D.C.; Hager, J.H.; Bogyo, M.; Hanahan, D. Cathepsin cysteine proteases are effectors of invasive growth and angiogenesis during multistage tumorigenesis. Cancer Cell 2004, 5, 443–453. [Google Scholar] [CrossRef] [Green Version]
- Huang, C.C.; Chen, K.L.; Cheung, C.-H.; Chang, J.-Y. Autophagy induced by cathepsin S inhibition induces early ROS production, oxidative DNA damage, and cell death via xanthine oxidase. Free Radic. Biol. Med. 2013, 65, 1473–1486. [Google Scholar] [CrossRef] [PubMed]
- Takahashi, K.; Ueno, T.; Tanida, I.; Minematsu-Ikeguchi, N.; Murata, M.; Kominami, E. Characterization of CAA0225, a Novel Inhibitor Specific for Cathepsin L, as a Probe for Autophagic Proteolysis. Biol. Pharm. Bull. 2009, 32, 475–479. [Google Scholar] [CrossRef] [PubMed] [Green Version]
- Soori, M.; Lu, G.; Mason, R.W. Cathepsin Inhibition Prevents Autophagic Protein Turnover and Downregulates Insulin Growth Factor-1 Receptor-Mediated Signaling in Neuroblastoma. J. Pharmacol. Exp. Ther. 2016, 356, 375–386. [Google Scholar] [CrossRef]
- Mahmood, D.F.D.; Jguirim-Souissi, I.; Khadija, E.-H.; Blondeau, N.; Diderot, V.; Amrani, S.; Slimane, M.-N.; Syrovets, T.; Simmet, T.; Rouis, M. Peroxisome Proliferator-activated Receptor γ Induces Apoptosis and Inhibits Autophagy of Human Monocyte-derived Macrophages via Induction of Cathepsin L POTENTIAL ROLE IN ATHEROSCLEROSIS. J. Biol. Chem. 2011, 286, 28858–28866. [Google Scholar] [CrossRef] [Green Version]
- Man, S.M.; Kanneganti, T.-D. Regulation of lysosomal dynamics and autophagy by CTSB/cathepsin B. Autophagy 2016, 12, 2504–2505. [Google Scholar] [CrossRef] [Green Version]
- Li, L.; Gao, L.; Song, Y.; Qin, Z.-H.; Liang, Z. Activated cathepsin L is associated with the switch from autophagy to apoptotic death of SH-SY5Y cells exposed to 6-hydroxydopamine. Biochem. Biophys. Res. Commun. 2016, 470, 579–585. [Google Scholar] [CrossRef]
- Lystad, A.H.; Simonsen, A. Phosphoinositide-binding proteins in autophagy. FEBS Lett. 2016, 590, 2454–2468. [Google Scholar] [CrossRef]
- Dupont, N.; Nascimbeni, A.C.; Morel, E.; Codogno, P. Molecular Mechanisms of Noncanonical Autophagy. Int. Rev. Cell Mol. Biol. 2017, 328, 1–23. [Google Scholar] [CrossRef]
- Pastore, N.; Brady, O.A.; Diab, H.I.; Martina, J.A.; Sun, L.; Huynh, T.; Lim, J.-A.; Zare, H.; Raben, N.; Ballabio, A.; et al. TFEB and TFE3 cooperate in the regulation of the innate immune response in activated macrophages. Autophagy 2016, 12, 1240–1258. [Google Scholar] [CrossRef]
- Eskelinen, E.-L. Roles of LAMP-1 and LAMP-2 in lysosome biogenesis and autophagy. Mol. Asp. Med. 2006, 27, 495–502. [Google Scholar] [CrossRef]
- Mijaljica, D.; Prescott, M.; Devenish, R.J. V-ATPase engagement in autophagic processes. Autophagy 2011, 7, 666–668. [Google Scholar] [CrossRef] [Green Version]
- Gilleron, M.; Lepore, M.; Layre, E.; Cala-De Paepe, D.; Mebarek, N.; Shayman, J.A.; Canaan, S.; Mori, L.; Carrière, F.; Puzo, G.; et al. Lysosomal Lipases PLRP2 and LPLA2 Process Mycobacterial Multi-acylated Lipids and Generate T Cell Stimulatory Antigens. Cell Chem. Biol. 2016, 23, 1147–1156. [Google Scholar] [CrossRef] [PubMed] [Green Version]
- Hiraoka, M.; Abe, A.; Shayman, J.A. Cloning and characterization of a lysosomal phospholipase A2, 1-O-acylceramide synthase. J. Biol. Chem. 2002, 277, 10090–10099. [Google Scholar] [CrossRef] [PubMed] [Green Version]
- Coant, N.; Sakamoto, W.; Mao, C.; Hannun, Y.A. Ceramidases, roles in sphingolipid metabolism and in health and disease. Adv. Biol. Regul. 2017, 63, 122–131. [Google Scholar] [CrossRef] [PubMed] [Green Version]
- Jha, A.K.; Huang, S.C.-C.; Sergushichev, A.; Lampropoulou, V.; Ivanova, Y.; Loginicheva, E.; Chmielewski, K.; Stewart, K.M.; Ashall, J.; Everts, B.; et al. Network integration of parallel metabolic and transcriptional data reveals metabolic modules that regulate macrophage polarization. Immunity 2015, 42, 419–430. [Google Scholar] [CrossRef] [PubMed] [Green Version]
- Griffiths, H.R.; Gao, D.; Pararasa, C. Redox regulation in metabolic programming and inflammation. Redox Biol. 2017, 12, 50–57. [Google Scholar] [CrossRef] [PubMed]
- Sadan, T.W.; Itzhak, G.; Kaschani, F.; Yu, Z.; Mahameed, M.; Anaki, A.; Ben-Nun, Y.; Merquiol, E.; Tirosh, B.; Kessler, B.; et al. Cathepsin L Regulates Metabolic Networks Controlling Rapid Cell Growth and Proliferation. Mol. Cell. Proteom. 2019, 18, 1330–1344. [Google Scholar] [CrossRef] [PubMed] [Green Version]
- Biswas, S.K.; Mantovani, A. Orchestration of metabolism by macrophages. Cell Metab. 2012, 15, 432–437. [Google Scholar] [CrossRef] [PubMed] [Green Version]
- Montenegro-Burke, J.R.; Sutton, J.A.; Rogers, L.M.; Milne, G.L.; McLean, J.A.; Aronoff, D.M. Lipid profiling of polarized human monocyte-derived macrophages. Prostaglandins Lipid Mediat. 2016, 127, 1–8. [Google Scholar] [CrossRef]
- Bell, R.M.; Ballas, L.M.; Coleman, R.A. Lipid topogenesis. J. Lipid Res. 1981, 22, 391–403. [Google Scholar] [PubMed]
- Orlowski, G.M.; Colbert, J.D.; Sharma, S.; Bogyo, M.; Robertson, S.A.; Rock, K.L. Multiple Cathepsins Promote Pro-IL-1β Synthesis and NLRP3-Mediated IL-1β Activation. J. Immunol. 2015, 195, 1685–1697. [Google Scholar] [CrossRef] [PubMed]
- Chapman, H.A. Endosomal proteases in antigen presentation. Curr. Opin. Immunol. 2006, 18, 78–84. [Google Scholar] [CrossRef] [PubMed]
- Jurewicz, M.M.; Stern, L.J. Class II MHC antigen processing in immune tolerance and inflammation. Immunogenetics 2009, 71, 171–187. [Google Scholar] [CrossRef]
- Gan, P.; Xia, Q.; Hang, G.; Zhou, Y.; Qian, X.; Wang, X.; Ding, L. Knockdown of cathepsin D protects dopaminergic neurons against neuroinflammation-mediated neurotoxicity through inhibition of NF-κB signalling pathway in Parkinson’s disease model. Clin. Exp. Pharmacol. Physiol. 2018, 46, 337–349. [Google Scholar] [CrossRef]
- Alam, S.; Liu, Q.; Liu, S.; Liu, Y.; Zhang, Y.; Yang, X.; Liu, G.; Fan, K.; Ma, J. Up-regulated cathepsin C induces macrophage M1 polarization through FAK-triggered p38 MAPK/NF-κB pathway. Exp. Cell Res. 2019, 382, 111472. [Google Scholar] [CrossRef]


© 2020 by the authors. Licensee MDPI, Basel, Switzerland. This article is an open access article distributed under the terms and conditions of the Creative Commons Attribution (CC BY) license (http://creativecommons.org/licenses/by/4.0/).
Share and Cite
Oelschlaegel, D.; Weiss Sadan, T.; Salpeter, S.; Krug, S.; Blum, G.; Schmitz, W.; Schulze, A.; Michl, P. Cathepsin Inhibition Modulates Metabolism and Polarization of Tumor-Associated Macrophages. Cancers 2020, 12, 2579. https://doi.org/10.3390/cancers12092579
Oelschlaegel D, Weiss Sadan T, Salpeter S, Krug S, Blum G, Schmitz W, Schulze A, Michl P. Cathepsin Inhibition Modulates Metabolism and Polarization of Tumor-Associated Macrophages. Cancers. 2020; 12(9):2579. https://doi.org/10.3390/cancers12092579
Chicago/Turabian StyleOelschlaegel, Diana, Tommy Weiss Sadan, Seth Salpeter, Sebastian Krug, Galia Blum, Werner Schmitz, Almut Schulze, and Patrick Michl. 2020. "Cathepsin Inhibition Modulates Metabolism and Polarization of Tumor-Associated Macrophages" Cancers 12, no. 9: 2579. https://doi.org/10.3390/cancers12092579