Stable Isotope Tracing Metabolomics to Investigate the Metabolic Activity of Bioactive Compounds for Cancer Prevention and Treatment


Abstract
:1. Introduction
2. Bioactive Compounds
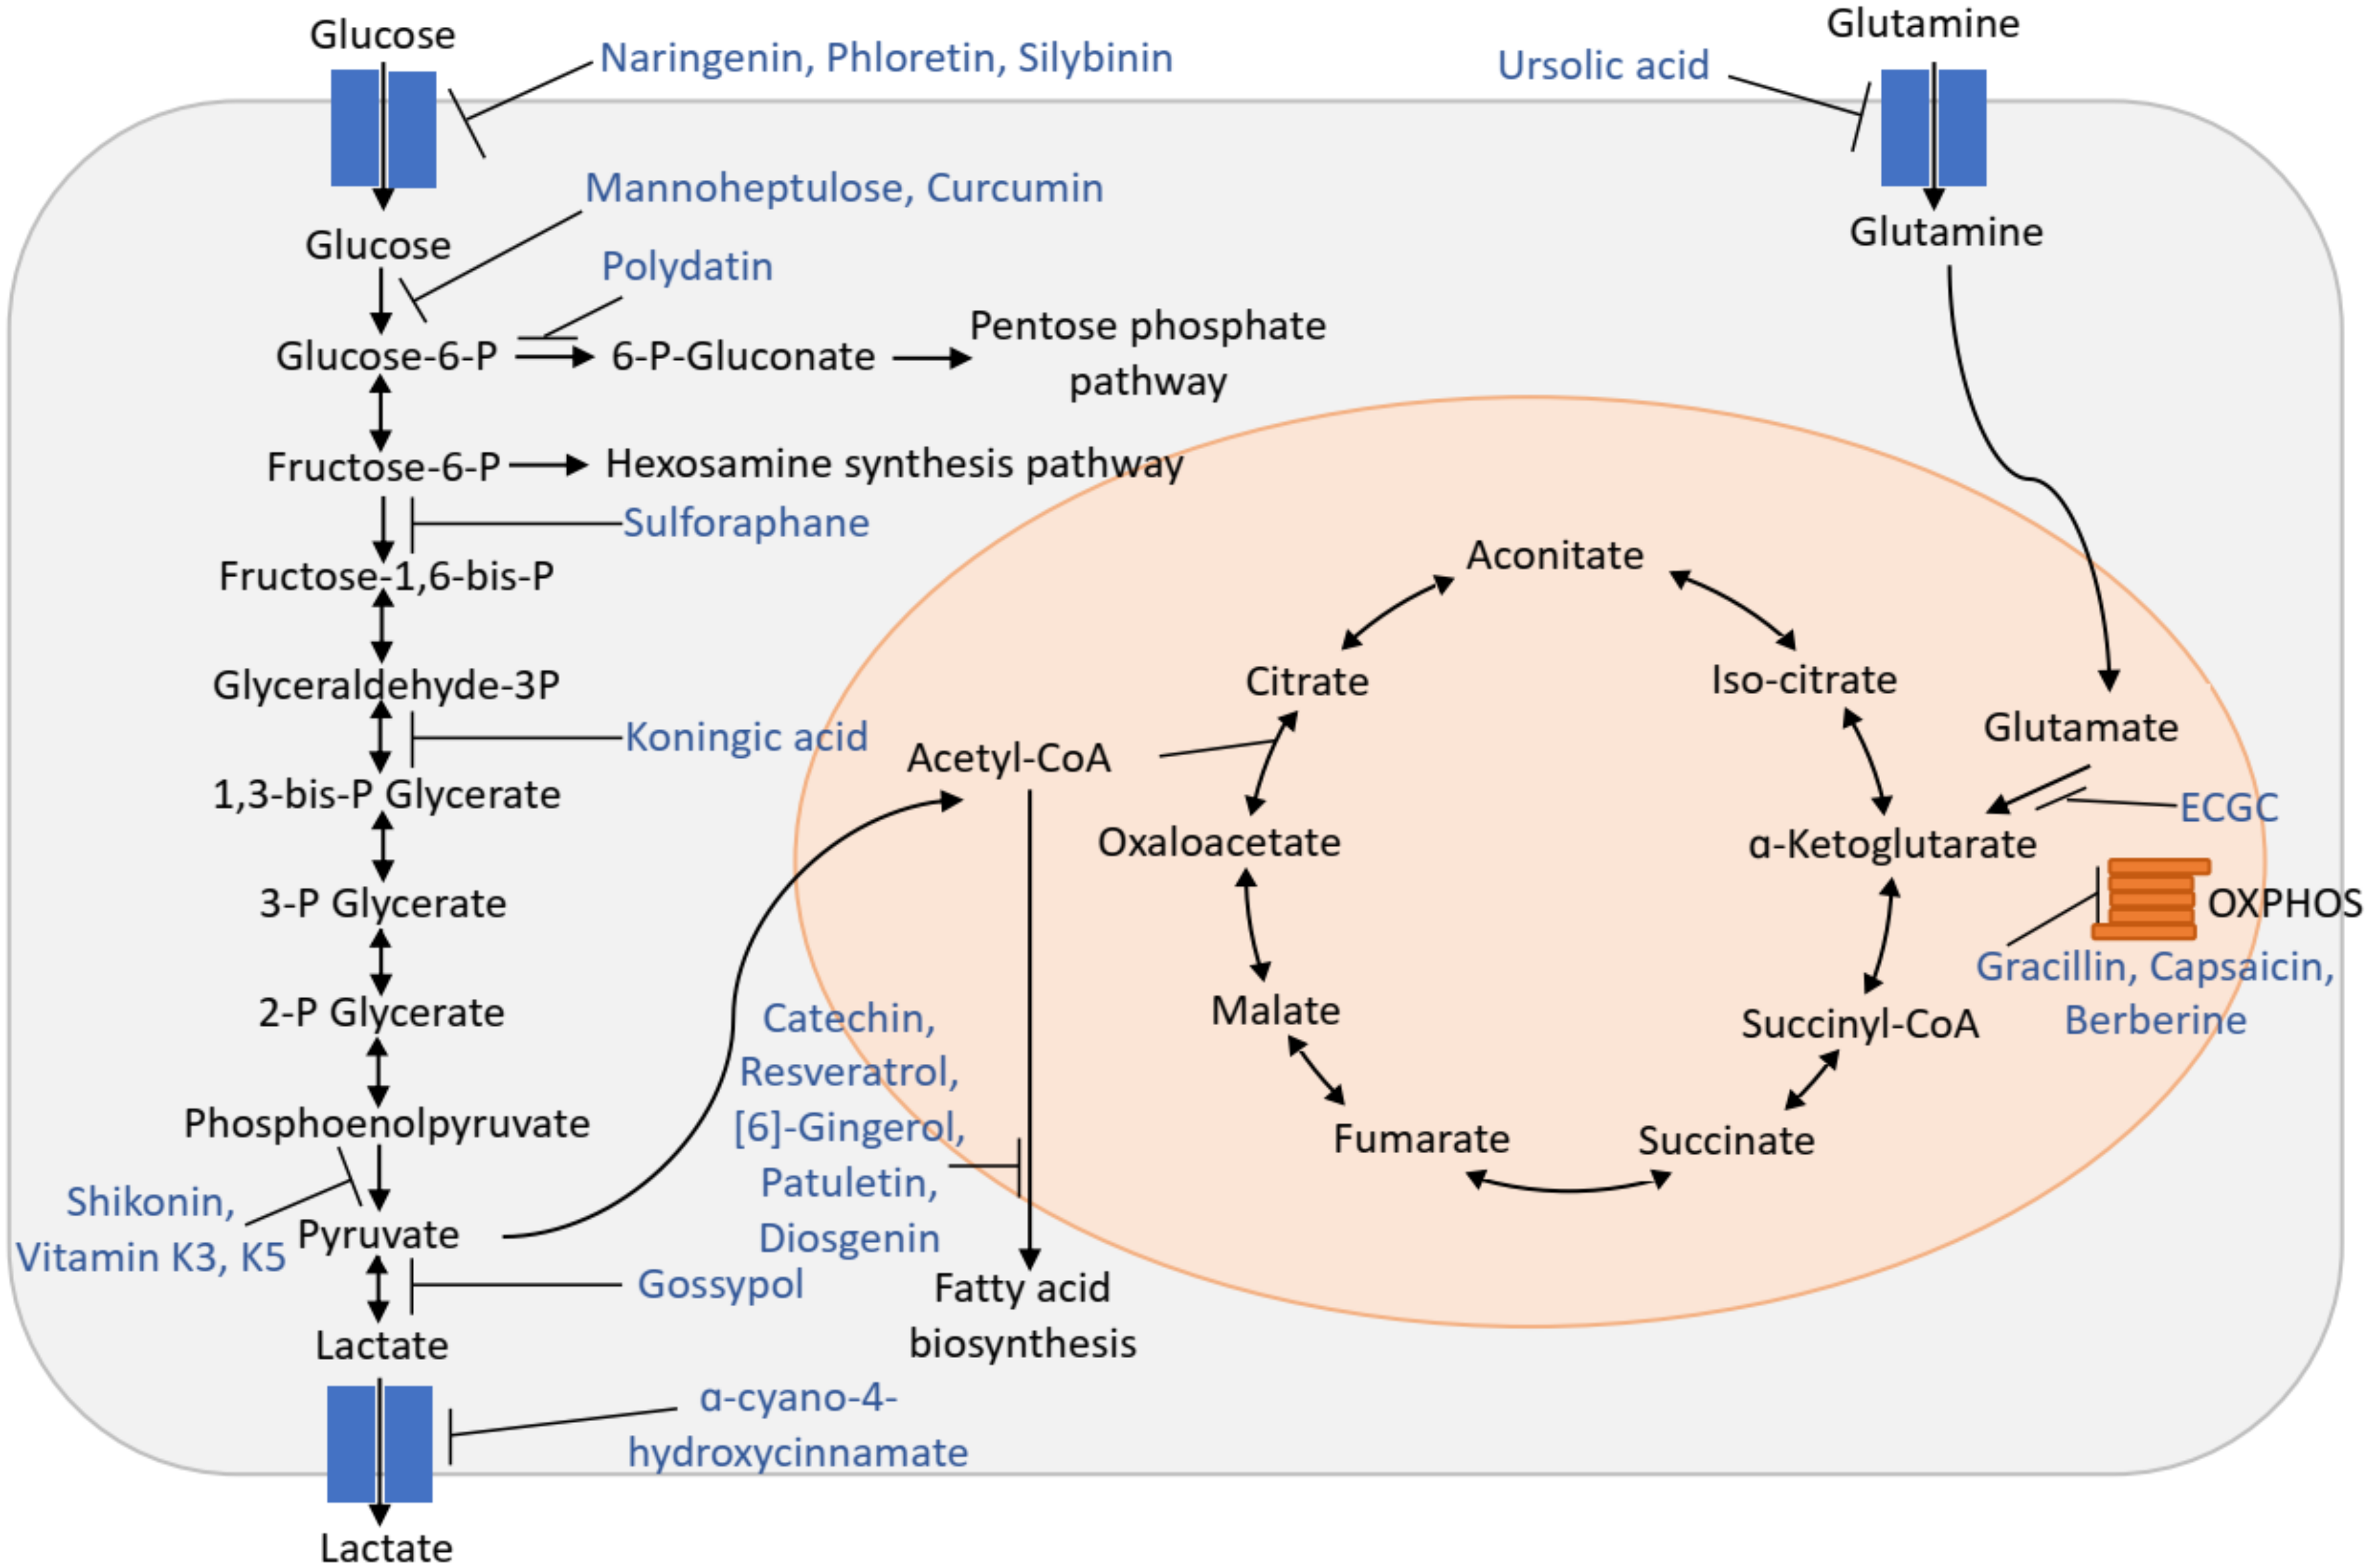
3. Inhibitors of Glucose Uptake
4. Inhibitor of Glycolysis
5. Inhibitor of Pentose Phosphate Pathway
6. Inhibitor of Glutamine Metabolism
7. Inhibitor of Mitochondrial Metabolism
8. Inhibitor of Fatty Acid Synthesis
9. Metabolic Pathway Analysis
9.1. Stable Isotope Tracing
9.2. Glycolysis
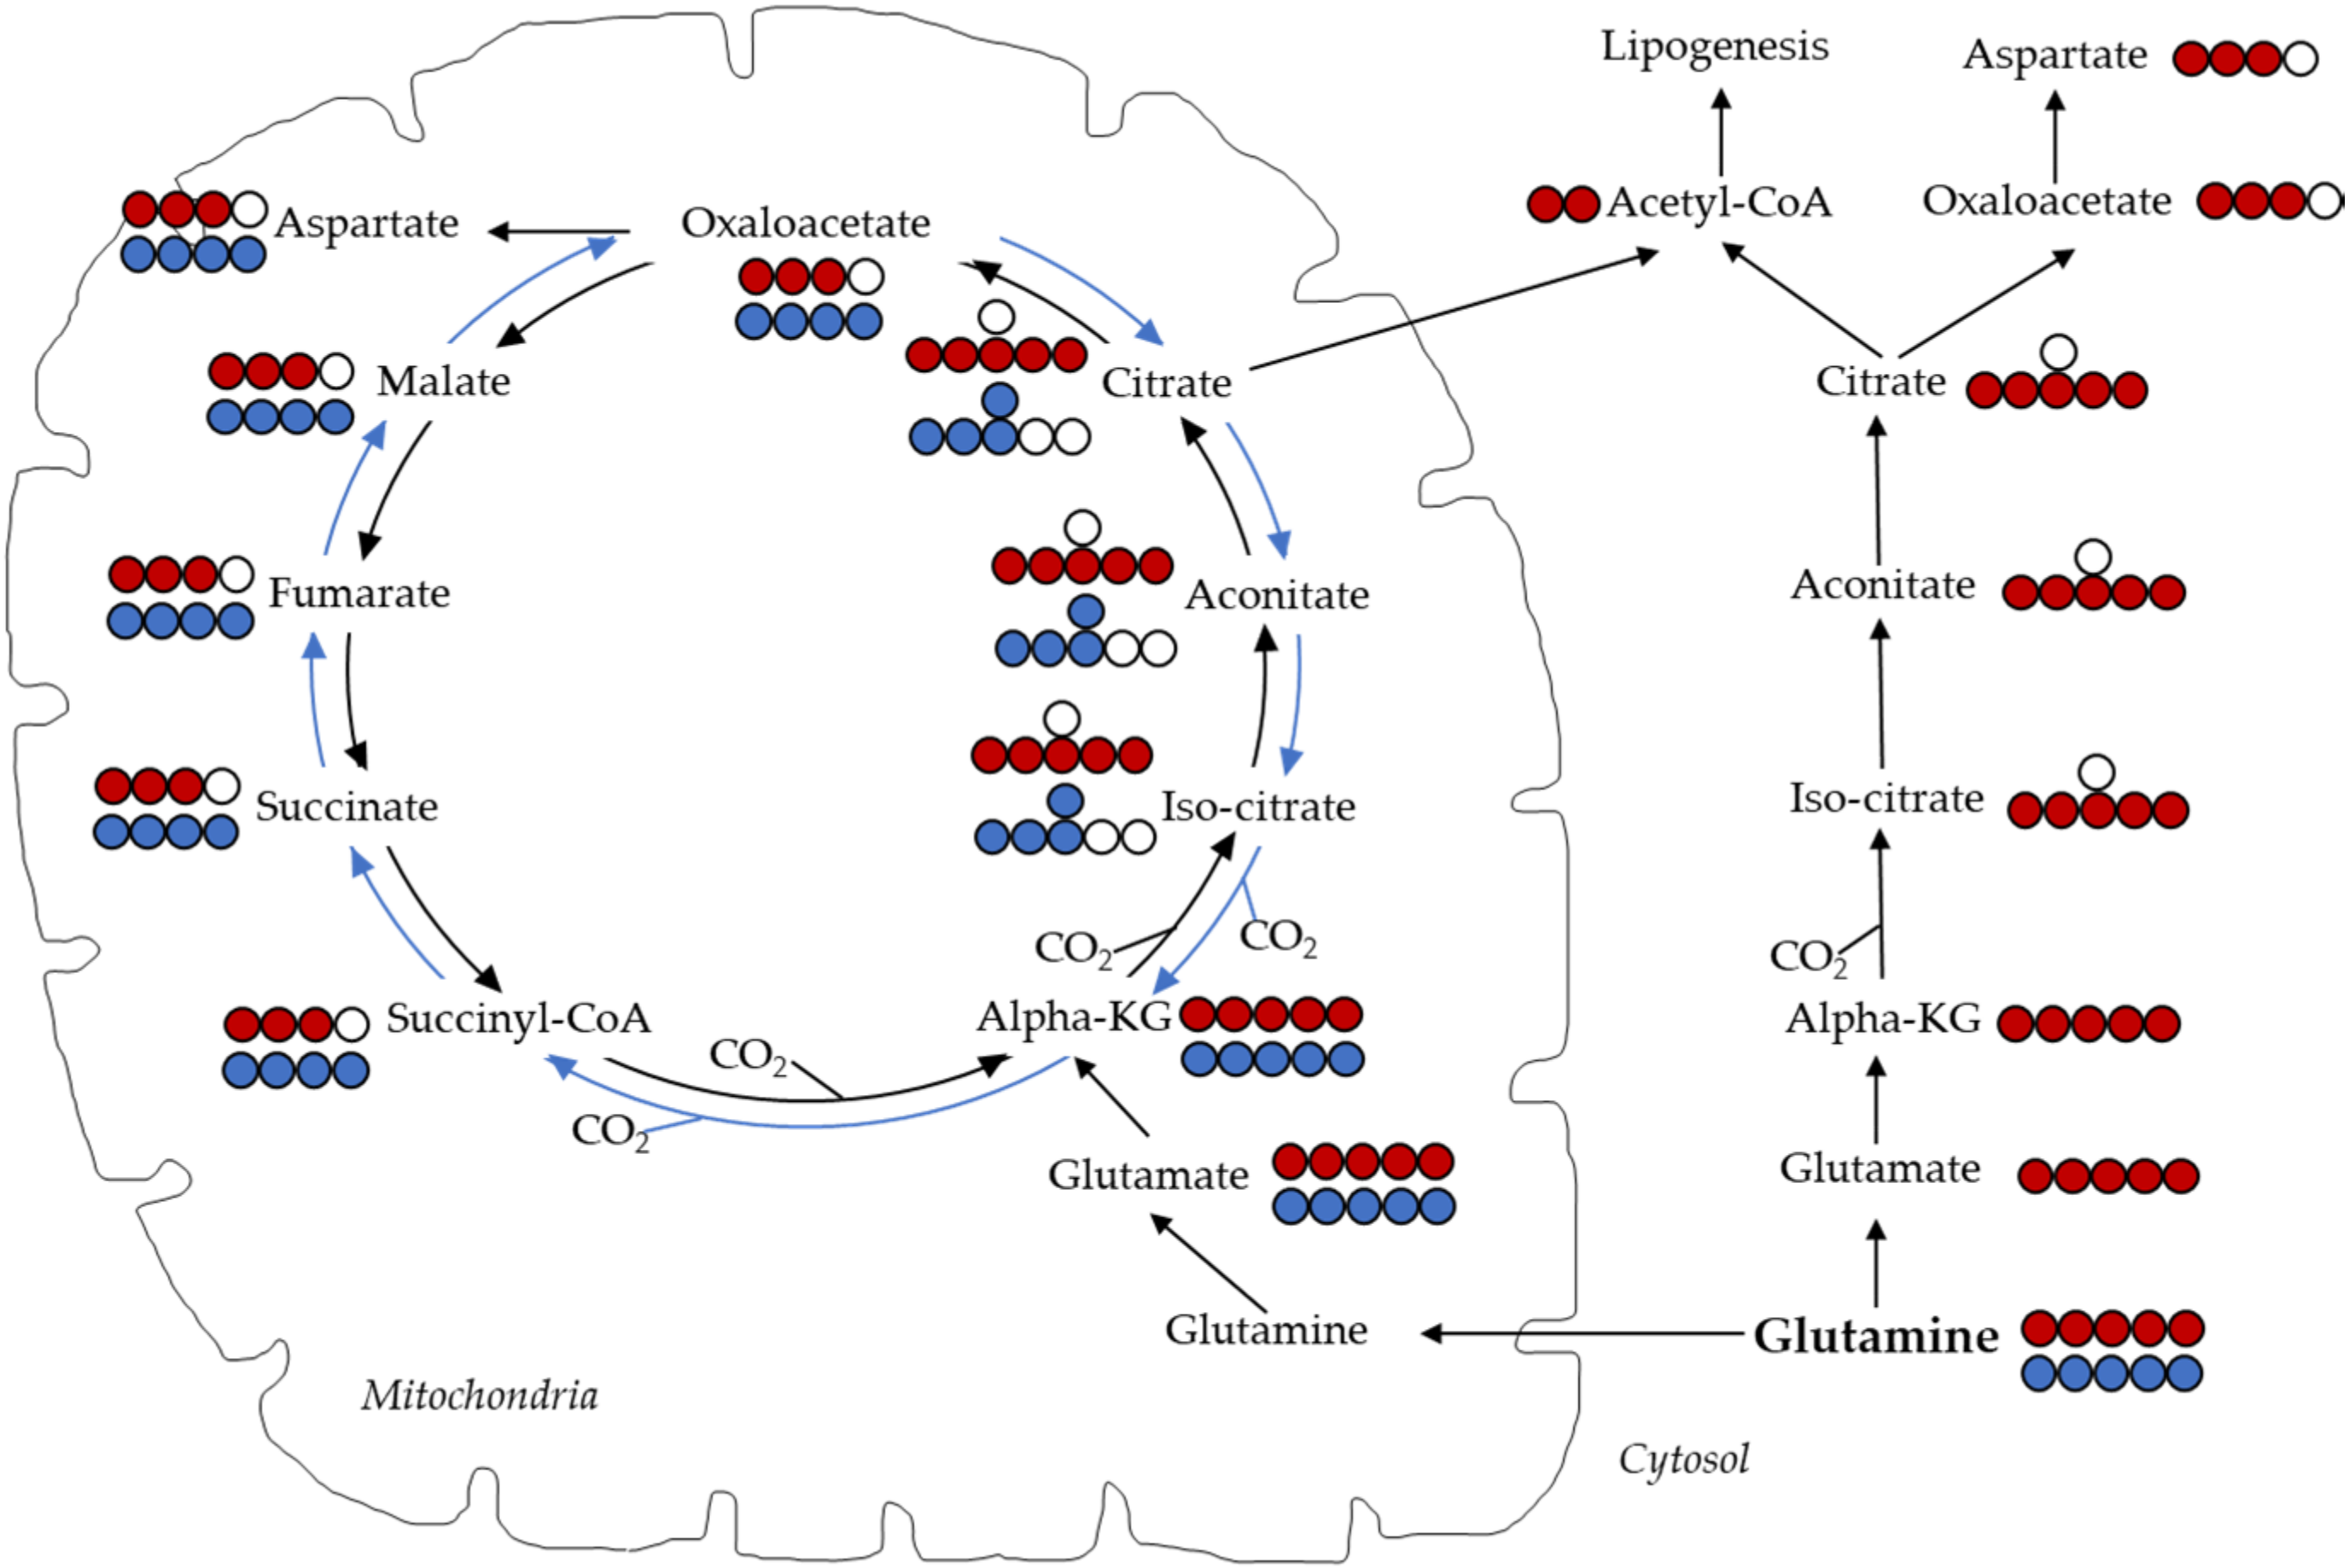
9.3. TCA Cycle
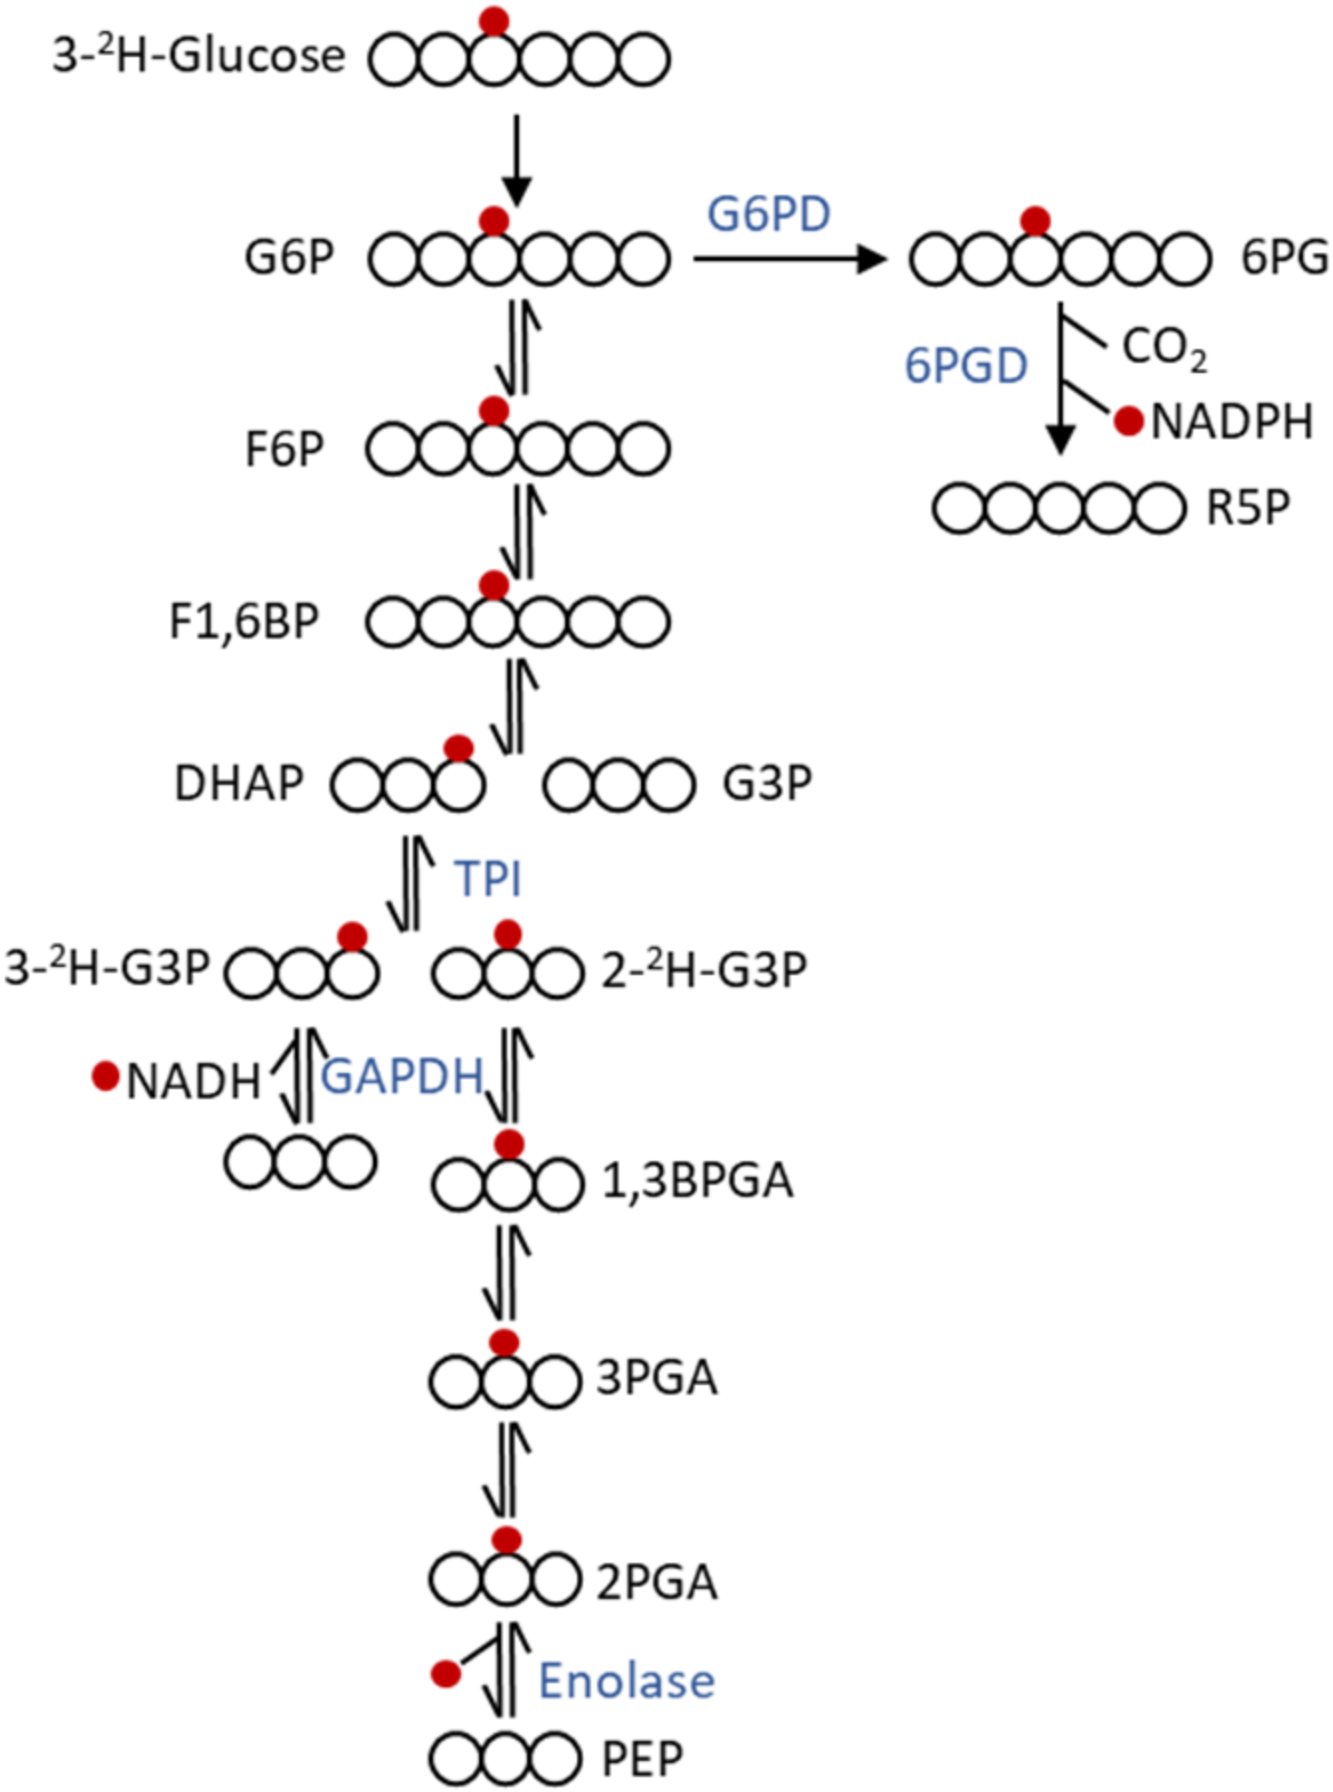
9.4. Pentose Phosphate Pathway (PPP)
9.5. Pyruvate Carboxylase Activity
9.6. Malic Enzyme Activity
9.7. NAD+/NADH Redox State
9.8. NADP+/NADPH Redox State
9.9. Glutathione Biosynthesis
9.10. CoQ Biosynthesis
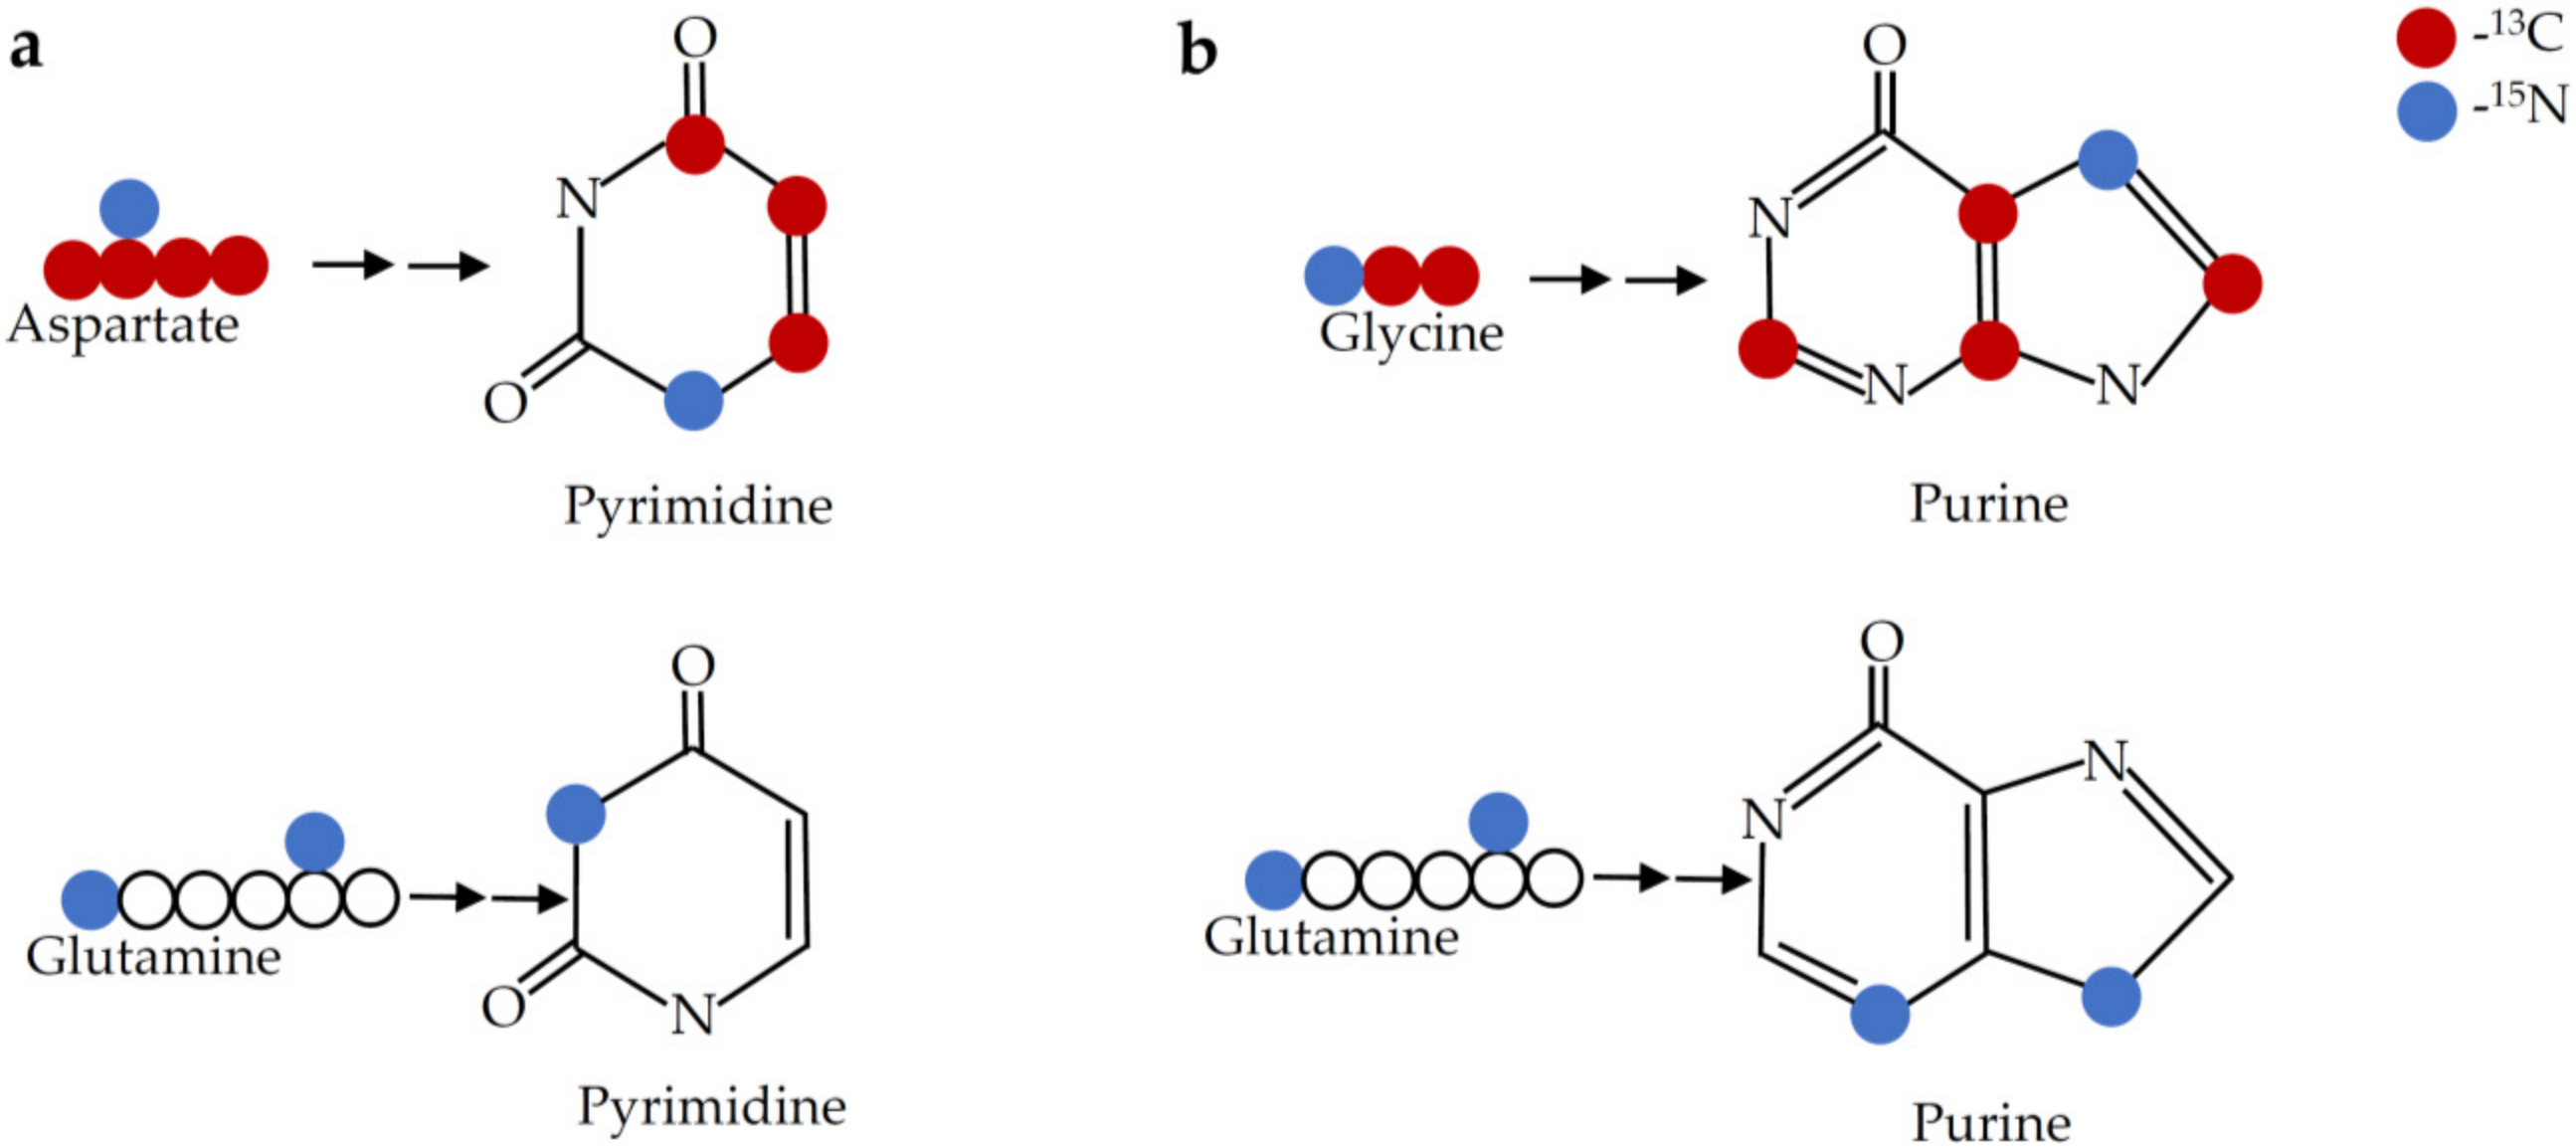
9.11. Nucleotide Biosynthesis
9.12. Folate Pathway
9.13. Fatty Acid Biosynthesis
10. Conclusions
Author Contributions
Funding
Conflicts of Interest
References
- Hanahan, D.; Weinberg, R.A. Hallmarks of cancer: The next generation. Cell 2011, 144, 646–674. [Google Scholar] [CrossRef] [Green Version]
- Hsu, P.P.; Sabatini, D.M. Cancer cell metabolism: Warburg and beyond. Cell 2008, 134, 703–707. [Google Scholar] [CrossRef] [PubMed] [Green Version]
- Vander Heiden, M.G.; Deberardinis, R.J. Understanding the intersections between metabolism and cancer biology. Cell 2017, 168, 657–669. [Google Scholar] [CrossRef] [Green Version]
- Guerra, A.R.; Duarte, M.F.; Duarte, I.F. Targeting tumor metabolism with plant-derived natural products: Emerging trends in cancer therapy. J. Agric. Food Chem. 2018, 66, 10663–10685. [Google Scholar] [CrossRef] [PubMed]
- Cragg, G.M.; Pezzuto, J.M. Natural products as a vital source for the discovery of cancer chemotherapeutic and chemopreventive agents. Med. Princ. Pract. 2015, 25, 41–59. [Google Scholar] [CrossRef] [PubMed]
- Dutta, S.; Mahalanobish, S.; Saha, S.; Ghosh, S.; Sil, P.C. Natural products: An upcoming therapeutic approach to cancer. Food Chem. Toxicol. 2019, 128, 240–255. [Google Scholar] [CrossRef]
- Lin, S.R.; Chang, C.H.; Hsu, C.F.; Tsai, M.J.; Cheng, H.; Leong, M.K.; Sung, P.J.; Chen, J.C.; Weng, C.F. Natural compounds as potential adjuvants to cancer therapy: Preclinical evidence. Br. J. Pharm. 2019, 177, 1409–1423. [Google Scholar] [CrossRef] [Green Version]
- Lodi, A.; Saha, A.; Lu, X.; Wang, B.; Sentandreu, E.; Collins, M.; Kolonin, M.G.; DiGiovanni, J.; Tiziani, S. Combinatorial treatment with natural compounds in prostate cancer inhibits prostate tumor growth and leads to key modulations of cancer cell metabolism. NPJ Precis. Oncol. 2017, 1, 1–12. [Google Scholar] [CrossRef]
- Minutolo, F.; Macchia, M.; Katzenellenbogen, B.S.; Katzenellenbogen, J.A. Estrogen receptor beta ligands: Recent advances and biomedical applications. Med. Res. Rev. 2011, 31, 364–442. [Google Scholar] [CrossRef]
- Barbosa, A.M.; Martel, F. Targeting glucose transporters for breast cancer therapy: The effect of natural and synthetic compounds. Cancers 2020, 12, 154. [Google Scholar] [CrossRef] [Green Version]
- Zhao, Z.; Jin, G.; Ge, Y.; Guo, Z. Naringenin inhibits migration of breast cancer cells via inflammatory and apoptosis cell signaling pathways. Inflammopharmacology 2019, 27, 1021–1036. [Google Scholar] [CrossRef] [PubMed]
- Lim, W.; Park, S.; Bazer, F.W.; Song, G. Naringenin-induced apoptotic cell death in prostate cancer cells is mediated via the pi3k/akt and mapk signaling pathways. J. Cell Biochem. 2017, 118, 1118–1131. [Google Scholar] [CrossRef]
- Nasr Bouzaiene, N.; Chaabane, F.; Sassi, A.; Chekir-Ghedira, L.; Ghedira, K. Effect of apigenin-7-glucoside, genkwanin and naringenin on tyrosinase activity and melanin synthesis in B16F10 melanoma cells. Life Sci. 2016, 144, 80–85. [Google Scholar] [CrossRef]
- Arul, D.; Subramanian, P. Naringenin (citrus flavonone) induces growth inhibition, cell cycle arrest and apoptosis in human hepatocellular carcinoma cells. Pathol. Oncol. Res. 2013, 19, 763–770. [Google Scholar] [CrossRef] [PubMed]
- Chandrika, B.B.; Steephan, M.; Kumar, T.R.S.; Sabu, A.; Haridas, M. Hesperetin and naringenin sensitize HER2 positive cancer cells to death by serving as HER2 tyrosine kinase inhibitors. Life Sci. 2016, 160, 47–56. [Google Scholar] [CrossRef] [PubMed]
- Ke, J.Y.; Banh, T.; Hsiao, Y.H.; Cole, R.M.; Straka, S.R.; Yee, L.D.; Belury, M.A. Citrus flavonoid naringenin reduces mammary tumor cell viability, adipose mass, and adipose inflammation in obese ovariectomized mice. Mol. Nutr. Food Res. 2017, 61, 1600934. [Google Scholar] [CrossRef]
- Camargo, C.A.; Gomes-Marcondes, M.C.; Wutzki, N.C.; Aoyama, H. Naringin inhibits tumor growth and reduces interleukin-6 and tumor necrosis factor alpha levels in rats with walker 256 carcinosarcoma. Anticancer Res. 2012, 32, 129–133. [Google Scholar]
- Salehi, B.; Fokou, P.V.T.; Sharifi-Rad, M.; Zucca, P.; Pezzani, R.; Martins, N.; Sharifi-Rad, J. The therapeutic potential of naringenin: A review of clinical trials. Pharmaceuticals 2019, 12, 11. [Google Scholar] [CrossRef] [Green Version]
- Rajamani, S.; Radhakrishnan, A.; Sengodan, T.; Thangavelu, S. Augmented anticancer activity of naringenin-loaded TPGS polymeric nanosuspension for drug resistive MCF-7 human breast cancer cells. Drug Dev. Ind. Pharm. 2018, 44, 1752–1761. [Google Scholar] [CrossRef]
- Kwon, O.; Eck, P.; Chen, S.; Corpe, C.P.; Lee, J.H.; Kruhlak, M.; Levine, M. Inhibition of the intestinal glucose transporter GLUT2 by flavonoids. FASEB J. 2007, 21, 366–377. [Google Scholar] [CrossRef] [Green Version]
- Akins, N.S.; Nielson, T.C.; Le, H.V. Inhibition of glycolysis and glutaminolysis: An emerging drug discovery approach to combat cancer. Curr. Top. Med. Chem. 2018, 18, 494–504. [Google Scholar] [CrossRef] [PubMed]
- Stompor, M.; Broda, D.; Bajek-Bil, A. Dihydrochalcones: Methods of acquisition and pharmacological properties—A first systematic review. Molecules 2019, 24, 4468. [Google Scholar] [CrossRef] [PubMed] [Green Version]
- Choi, B. Biochemical basis of anti-cancer-effects of phloretin—A natural dihydrochalcone. Molecules 2019, 24, 278. [Google Scholar] [CrossRef] [Green Version]
- Hasan, S.; Taha, R.; Omri, H.E. Current opinions on chemoresistance: An overview. Bioinformation 2018, 14, 80–85. [Google Scholar] [CrossRef] [Green Version]
- Shriwas, P.; Chen, X.; Kinghorn, A.D.; Ren, Y. Plant-derived glucose transport inhibitors with potential antitumor activity. Phytother. Res. 2020, 34, 1027–1040. [Google Scholar] [CrossRef] [PubMed]
- Ma, L.; Wang, R.; Nan, Y.; Li, W.; Wang, Q.; Jin, F. Phloretin exhibits an anticancer effect and enhances the anticancer ability of cisplatin on non-small cell lung cancer cell lines by regulating expression of apoptotic pathways and matrix metalloproteinases. Int. J. Oncol. 2016, 48, 843–853. [Google Scholar] [CrossRef] [PubMed] [Green Version]
- Abkin, S.V.; Ostroumova, O.S.; Komarova, E.Y.; Meshalkina, D.A.; Shevtsov, M.A.; Margulis, B.A.; Guzhova, I.V. Phloretin increases the anti-tumor efficacy of intratumorally delivered heat-shock protein 70 kDa (HSP70) in a murine model of melanoma. Cancer Immunol. Immunother. 2015, 65, 83–92. [Google Scholar] [CrossRef]
- Qin, X.; Xing, Y.F.; Zhou, Z.; Yao, Y. Dihydrochalcone compounds isolated from crabapple leaves showed anticancer effects on human cancer cell lines. Molecules 2015, 20, 21193–21203. [Google Scholar] [CrossRef]
- Xu, M.; Gu, W.; Shen, Z.; Wang, F. Anticancer activity of phloretin against human gastric cancer cell lines involves apoptosis, cell cycle arrest, and inhibition of cell invasion and JNK signalling pathway. Med. Sci. Monit. 2018, 24, 6551–6558. [Google Scholar] [CrossRef]
- Duan, H.; Wang, R.; Yan, X.; Liu, H.; Zhang, Y.; Mu, D.; Han, J.; Li, X. Phloretin induces apoptosis of human esophageal cancer via a mitochondria-dependent pathway. Oncol. Lett. 2017, 14, 6763–6768. [Google Scholar] [CrossRef] [Green Version]
- Wu, K.-H.; Ho, C.-T.; Chen, Z.-F.; Chen, L.-C.; Whang-Peng, J.; Lin, T.-N.; Ho, Y.-S. The apple polyphenol phloretin inhibits breast cancer cell migration and proliferation via inhibition of signals by type 2 glucose transporter. J. Food Drug Anal. 2017. [Google Scholar] [CrossRef] [PubMed] [Green Version]
- Szliszka, E.; Czuba, Z.P.; Mazur, B.; Paradysz, A.; Krol, W. Chalcones and dihydrochalcones augment TRAIL-mediated apoptosis in prostate cancer cells. Molecules 2010, 15, 5336–5353. [Google Scholar] [CrossRef] [PubMed] [Green Version]
- Liu, Y.; Fan, C.; Pu, L.; Wei, C.; Jin, H.; Teng, Y.; Zhao, M.; Yu, A.C.; Jiang, F.; Shu, J.; et al. Phloretin induces cell cycle arrest and apoptosis of human glioblastoma cells through the generation of reactive oxygen species. J. Neurooncol. 2016, 128, 217–223. [Google Scholar] [CrossRef] [PubMed]
- Zielinska, D.; Laparra-Llopis, J.M.; Zielinski, H.; Szawara-Nowak, D.; Giménez-Bastida, J.A. Role of apple phytochemicals, phloretin and phloridzin, in modulating processes related to intestinal inflammation. Nutrients 2019, 11, 1173. [Google Scholar] [CrossRef] [PubMed] [Green Version]
- Yang, Y.C.; Lii, C.K.; Lin, A.H.; Yeh, Y.W.; Yao, H.T.; Li, C.C.; Liu, K.L.; Chen, H.W. Induction of glutathione synthesis and heme oxygenase 1 by the flavonoids butein and phloretin is mediated through the ERK/Nrf2 pathway and protects against oxidative stress. Free Radic. Biol. Med. 2011, 51, 2073–2081. [Google Scholar] [CrossRef]
- Zhan, T.; Digel, M.; Kuch, E.M.; Stremmel, W.; Fullekrug, J. Silybin and dehydrosilybin decrease glucose uptake by inhibiting GLUT proteins. J. Cell Biochem. 2011, 112, 849–859. [Google Scholar] [CrossRef]
- Delmas, D.; Xiao, J.; Vejux, A.; Aires, V. Silymarin and cancer: A dual strategy in both in chemoprevention and chemosensitivity. Molecules 2020, 25, 2009. [Google Scholar] [CrossRef]
- Granchi, C.; Minutolo, F. Anticancer agents that counteract tumor glycolysis. Chem. Med. Chem. 2012, 7, 1318–1350. [Google Scholar] [CrossRef] [Green Version]
- Bailon-Moscoso, N.; Cevallos-Solorzano, G.; Romero-Benavides, J.; Ramirez Orellana, M. Natural compounds as modulators of cell cycle arrest: Application for anticancer chemotherapies. Curr. Genom. 2017, 18, 106–131. [Google Scholar] [CrossRef] [Green Version]
- Bijak, M.; Synowiec, E.; Sitarek, P.; Sliwiński, T.; Saluk-Bijak, J. Evaluation of the cytotoxicity and genotoxicity of flavonolignans in different cellular models. Nutrients 2017, 9, 1356. [Google Scholar] [CrossRef] [Green Version]
- Luo, H.; Vong, C.T.; Chen, H.; Gao, Y.; Lyu, P.; Qiu, L.; Zhao, M.; Liu, Q.; Cheng, Z.; Zou, J.; et al. Naturally occurring anti-cancer compounds: Shining from Chinese herbal medicine. Chin. Med. 2019, 14, 48. [Google Scholar] [CrossRef] [PubMed] [Green Version]
- Deep, G.; Agarwal, R. Chemopreventive efficacy of silymarin in skin and prostate cancer. Integr. Cancer Ther. 2007, 6, 130–145. [Google Scholar] [CrossRef]
- Liao, H.; Wang, Z.; Deng, Z.; Ren, H.; Li, X. Curcumin inhibits lung cancer invasion and metastasis by attenuating GLUT1/MT1-MMP/MMP2 pathway. Int. J. Clin. Exp. Med. 2015, 8, 8948–8957. [Google Scholar]
- Wang, K.; Fan, H.; Chen, Q.; Ma, G.; Zhu, M.; Zhang, X.; Zhang, Y.; Yu, J. Curcumin inhibits aerobic glycolysis and induces mitochondrial-mediated apoptosis through hexokinase II in human colorectal cancer cells in vitro. Anticancer Drugs 2015, 26, 15–24. [Google Scholar] [CrossRef] [PubMed]
- Geng, C.; Li, J.; Ding, F.; Wu, G.; Yang, Q.; Sun, Y.; Zhang, Z.; Dong, T.; Tian, X. Curcumin suppresses 4-hydroxytamoxifen resistance in breast cancer cells by targeting SLUG/Hexokinase 2 pathway. Biochem. Biophys. Res. Commun. 2016, 473, 147–153. [Google Scholar] [CrossRef] [PubMed]
- Fan, H.; Tian, W.; Ma, X. Curcumin induces apoptosis of HepG2 cells via inhibiting fatty acid synthase. Target. Oncol. 2014, 9, 279–286. [Google Scholar] [CrossRef]
- Fan, H.; Liang, Y.; Jiang, B.; Li, X.; Xun, H.; Sun, J.; He, W.; Lau, H.T.; Ma, X. Curcumin inhibits intracellular fatty acid synthase and induces apoptosis in human breast cancer MDA-MB-231 cells. Oncol. Rep. 2016, 35, 2651–2656. [Google Scholar] [CrossRef] [Green Version]
- Giordano, A.; Tommonaro, G. Curcumin and cancer. Nutrients 2019, 11, 2376. [Google Scholar] [CrossRef] [Green Version]
- Tomeh, M.A.; Hadianamrei, R.; Zhao, X. A review of curcumin and its derivatives as anticancer agents. Int. J. Mol. Sci. 2019, 20, 1033. [Google Scholar] [CrossRef] [Green Version]
- Zhang, Y.; Courtois, P.; Sener, A.; Malaisse, W.J. Dissimilar effects of D-mannoheptulose on the phosphorylation of alpha- versus beta-D-glucose by either hexokinase or glucokinase. Int. J. Mol. Med. 2004, 14, 107–112. [Google Scholar]
- Jeon, Y.K.; Yoo, D.R.; Jang, Y.H.; Jang, S.Y.; Nam, M.J. Sulforaphane induces apoptosis in human hepatic cancer cells through inhibition of 6-phosphofructo-2-kinase/fructose-2,6-biphosphatase4, mediated by hypoxia inducible factor-1-dependent pathway. Biochim. Biophys. Acta 2011, 1814, 1340–1348. [Google Scholar] [CrossRef] [PubMed]
- Liang, J.; Hansch, G.M.; Hubner, K.; Samstag, Y. Sulforaphane as anticancer agent: A double-edged sword? Tricky balance between effects on tumor cells and immune cells. Adv. Biol. Regul. 2019, 71, 79–87. [Google Scholar] [CrossRef] [PubMed]
- Su, X.; Jiang, X.; Meng, L.; Dong, X.; Shen, Y.; Xin, Y. Anticancer activity of sulforaphane: The epigenetic mechanisms and the Nrf2 signaling pathway. Oxid. Med. Cell. Longev. 2018, 2018, 5438179. [Google Scholar] [CrossRef] [PubMed]
- Alumkal, J.J.; Slottke, R.; Schwartzman, J.; Cherala, G.; Munar, M.; Graff, J.N.; Beer, T.M.; Ryan, C.W.; Koop, D.R.; Gibbs, A.; et al. A phase II study of sulforaphane-rich broccoli sprout extracts in men with recurrent prostate cancer. Investig. New Drugs 2015, 33, 480–489. [Google Scholar] [CrossRef] [PubMed]
- Lozanovski, V.J.; Houben, P.; Hinz, U.; Hackert, T.; Herr, I.; Schemmer, P. Pilot study evaluating broccoli sprouts in advanced pancreatic cancer (POUDER trial)—Study protocol for a randomized controlled trial. Trials 2014, 15, 204. [Google Scholar] [CrossRef] [PubMed] [Green Version]
- Nakazawa, M.; Uehara, T.; Nomura, Y. Koningic acid (a potent glyceraldehyde-3-phosphate dehydrogenase inhibitor)-induced fragmentation and condensation of DNA in NG108-15 cells. J. Neurochem. 1997, 68, 2493–2499. [Google Scholar] [CrossRef] [Green Version]
- Rahier, N.J.; Molinier, N.; Long, C.; Deshmukh, S.K.; Kate, A.S.; Ranadive, P.; Verekar, S.A.; Jiotode, M.; Lavhale, R.R.; Tokdar, P.; et al. Anticancer activity of koningic acid and semisynthetic derivatives. Bioorg. Med. Chem. 2015, 23, 3712–3721. [Google Scholar] [CrossRef]
- Ganapathy-Kanniappan, S. Evolution of GAPDH as a druggable target of tumor glycolysis? Expert Opin. Ther. Targets 2018, 22, 295–298. [Google Scholar] [CrossRef] [Green Version]
- Chen, J.; Xie, J.; Jiang, Z.; Wang, B.; Wang, Y.; Hu, X. Shikonin and its analogs inhibit cancer cell glycolysis by targeting tumor pyruvate kinase-M2. Oncogene 2011, 30, 4297–4306. [Google Scholar] [CrossRef] [Green Version]
- Sweeney, S.; Collins, M.; Pandey, R.; Chiou, J.; Lodi, A.; Tiziani, S. Identification of a synergistic combination of dimethylaminoparthenolide and shikonin alters metabolism and inhibits proliferation of pediatric precursor-B cell acute lymphoblastic leukemia. Mol. Carcinogen. 2020, 59, 399–411. [Google Scholar] [CrossRef]
- Zhao, X.; Zhu, Y.; Hu, J.; Jiang, L.; Li, L.; Jia, S.; Zen, K. Shikonin inhibits tumor growth in mice by suppressing pyruvate kinase M2-mediated aerobic glycolysis. Sci. Rep. 2018, 8, 14517. [Google Scholar] [CrossRef] [PubMed]
- Wang, Y.; Hao, F.; Nan, Y.; Qu, L.; Na, W.; Jia, C.; Chen, X. PKM2 inhibitor shikonin overcomes the cisplatin resistance in bladder cancer by inducing necroptosis. Int. J. Biol. Sci. 2018, 14, 1883–1891. [Google Scholar] [CrossRef] [PubMed] [Green Version]
- Tang, J.C.; Zhao, J.; Long, F.; Chen, J.Y.; Mu, B.; Jiang, Z.; Ren, Y.; Yang, J. Efficacy of shikonin against esophageal cancer cells and its possible mechanisms in vitro and in vivo. J. Cancer 2018, 9, 32–40. [Google Scholar] [CrossRef] [PubMed] [Green Version]
- Chen, J.; Jiang, Z.; Wang, B.; Wang, Y.; Hu, X. Vitamin K (3) and K (5) are inhibitors of tumor pyruvate kinase M2. Cancer Lett. 2012, 316, 204–210. [Google Scholar] [CrossRef] [PubMed]
- Liu, J.; Wu, N.; Ma, L.; Liu, M.; Liu, G.; Zhang, Y.; Lin, X. Oleanolic acid suppresses aerobic glycolysis in cancer cells by switching pyruvate kinase type M isoforms. PLoS ONE 2014, 9, e91606. [Google Scholar] [CrossRef] [PubMed] [Green Version]
- Gomez, M.S.; Piper, R.C.; Hunsaker, L.A.; Royer, R.E.; Deck, L.M.; Makler, M.T.; Vander Jagt, D.L. Substrate and cofactor specificity and selective inhibition of lactate dehydrogenase from the malarial parasite P. falciparum. Mol. Biochem. Parasitol. 1997, 90, 235–246. [Google Scholar] [CrossRef]
- Feng, Y.; Xiong, Y.; Qiao, T.; Li, X.; Jia, L.; Han, Y. Lactate dehydrogenase: A key player in carcinogenesis and potential target in cancer therapy. Cancer Med. 2018, 7, 6124–6136. [Google Scholar] [CrossRef] [Green Version]
- Kim, H.Y.; Lee, B.I.; Jeon, J.H.; Kim, D.K.; Kang, S.G.; Shim, J.K.; Kim, S.Y.; Kang, S.W.; Jang, H. Gossypol suppresses growth of temozolomide-resistant glioblastoma tumor spheres. Biomolecules 2019, 9, 595. [Google Scholar] [CrossRef] [Green Version]
- Zhang, L.; Sun, S.; Wang, Y.; Mo, Y.; Xiong, F.; Zhang, S.; Zeng, Z.; Xiong, W.; Li, G.; Chen, H.; et al. Gossypol induces apoptosis of multiple myeloma cells through the JUN-JNK pathway. Am. J. Cancer Res. 2020, 10, 870–883. [Google Scholar]
- Lu, M.D.; Li, L.Y.; Li, P.H.; You, T.; Wang, F.H.; Sun, W.J.; Zheng, Z.Q. Gossypol induces cell death by activating apoptosis and autophagy in HT-29 cells. Mol. Med. Rep. 2017, 16, 2128–2132. [Google Scholar] [CrossRef] [Green Version]
- Lampson, B.L.; Davids, M.S. The development and current use of BCL-2 inhibitors for the treatment of chronic lymphocytic leukemia. Curr. Hematol. Malig. Rep. 2017, 12, 11–19. [Google Scholar] [CrossRef] [PubMed] [Green Version]
- Volate, S.R.; Kawasaki, B.T.; Hurt, E.M.; Milner, J.A.; Kim, Y.S.; White, J.; Farrar, W.L. Gossypol induces apoptosis by activating p53 in prostate cancer cells and prostate tumor-initiating cells. Mol. Cancer 2010, 9, 461–470. [Google Scholar] [CrossRef] [PubMed] [Green Version]
- Moon, D.O.; Choi, Y.H.; Moon, S.K.; Kim, W.J.; Kim, G.Y. Gossypol decreases tumor necrosis factor-alpha-induced intercellular adhesion molecule-1 expression via suppression of NF-kappaB activity. Food Chem. Toxicol. 2011, 49, 999–1005. [Google Scholar] [CrossRef] [PubMed]
- Halestrap, A.P.; Denton, R.M. The specificity and metabolic implications of the inhibition of pyruvate transport in isolated mitochondria and intact tissue preparations by alpha-Cyano-4-hydroxycinnamate and related compounds. Biochem. J. 1975, 148, 97–106. [Google Scholar] [CrossRef]
- Wilkins, L.R.; Brautigan, D.L.; Wu, H.; Yarmohammadi, H.; Kubicka, E.; Serbulea, V.; Leitinger, N.; Liu, W.; Haaga, J.R. Cinnamic acid derivatives enhance the efficacy of transarterial embolization in a rat model of hepatocellular carcinoma. Cardiovasc. Interv. Radiol. 2016. [Google Scholar] [CrossRef]
- Payen, V.L.; Mina, E.; Van Hée, V.F.; Porporato, P.E.; Sonveaux, P. Monocarboxylate transporters in cancer. Mol. Metab. 2020, 33, 48–66. [Google Scholar] [CrossRef]
- Coss, R.A.; Storck, C.W.; Daskalakis, C.; Berd, D.; Wahl, M.L. Intracellular acidification abrogates the heat shock response and compromises survival of human melanoma cells. Mol. Cancer Ther. 2003, 2, 383–388. [Google Scholar]
- Caruso, J.P.; Koch, B.J.; Benson, P.D.; Varughese, E.; Monterey, M.D.; Lee, A.E.; Dave, A.M.; Kiousis, S.; Sloan, A.E.; Mathupala, S.P. pH, lactate, and hypoxia: Reciprocity in regulating high-affinity monocarboxylate transporter expression in glioblastoma. Neoplasia 2017, 19, 121–134. [Google Scholar] [CrossRef]
- Colen, C.B.; Shen, Y.; Ghoddoussi, F.; Yu, P.; Francis, T.B.; Koch, B.J.; Monterey, M.D.; Galloway, M.P.; Sloan, A.E.; Mathupala, S.P. Metabolic targeting of lactate efflux by malignant glioma inhibits invasiveness and induces necrosis: An in vivo study. Neoplasia 2011, 13, 620–632. [Google Scholar] [CrossRef] [Green Version]
- Schonrogge, M.; Kerndl, H.; Zhang, X.; Kumstel, S.; Vollmar, B.; Zechner, D. Alpha-cyano-4-hydroxycinnamate impairs pancreatic cancer cells by stimulating the p38 signaling pathway. Cell Signal. 2018, 47, 101–108. [Google Scholar] [CrossRef]
- Kumar, A.; Kant, S.; Singh, S.M. Alpha-Cyano-4-hydroxycinnamate induces apoptosis in Dalton’s lymphoma cells: Role of altered cell survival-regulatory mechanisms. Anticancer Drugs 2013, 24, 158–171. [Google Scholar] [CrossRef] [PubMed]
- Mele, L.; Paino, F.; Papaccio, F.; Regad, T.; Boocock, D.; Stiuso, P.; Lombardi, A.; Liccardo, D.; Aquino, G.; Barbieri, A.; et al. A new inhibitor of glucose-6-phosphate dehydrogenase blocks pentose phosphate pathway and suppresses malignant proliferation and metastasis in vivo. Cell Death Dis. 2018, 9, 572. [Google Scholar] [CrossRef] [PubMed] [Green Version]
- Du, Q.H.; Peng, C.; Zhang, H. Polydatin: A review of pharmacology and pharmacokinetics. Pharm. Biol. 2013, 51, 1347–1354. [Google Scholar] [CrossRef] [PubMed]
- Scalise, M.; Pochini, L.; Console, L.; Losso, M.A.; Indiveri, C. The human SLC1A5 (ASCT2) amino acid transporter: From function to structure and role in cell biology. Front. Cell Dev. Biol. 2018, 6, 96. [Google Scholar] [CrossRef]
- Yin, R.; Li, T.; Tian, J.X.; Xi, P.; Liu, R.H. Ursolic acid, a potential anticancer compound for breast cancer therapy. Crit. Rev. Food Sci. Nutr. 2018, 58, 568–574. [Google Scholar] [CrossRef]
- Leng, S.; Hao, Y.; Du, D.; Xie, S.; Hong, L.; Gu, H.; Zhu, X.; Zhang, J.; Fan, D.; Kung, H.F. Ursolic acid promotes cancer cell death by inducing Atg5-dependent autophagy. Int. J. Cancer 2013, 133, 2781–2790. [Google Scholar] [CrossRef]
- Min, H.Y.; Jang, H.J.; Park, K.H.; Hyun, S.Y.; Park, S.J.; Kim, J.H.; Son, J.; Kang, S.S.; Lee, H.Y. The natural compound gracillin exerts potent antitumor activity by targeting mitochondrial complex II. Cell Death Dis. 2019, 10, 810. [Google Scholar] [CrossRef] [Green Version]
- Hail, N., Jr.; Lotan, R. Examining the role of mitochondrial respiration in vanilloid-induced apoptosis. J. Natl. Cancer Inst. 2002, 94, 1281–1292. [Google Scholar] [CrossRef]
- Yan, X.-J.; Yu, X.; Wang, X.-P.; Jiang, J.-F.; Yuan, Z.-Y.; Lu, X.; Lei, F.; Xing, D.-M. Mitochondria play an important role in the cell proliferation suppressing activity of berberine. Sci. Rep. 2017, 7, 41712. [Google Scholar] [CrossRef] [Green Version]
- Zhang, J.S.; Lei, J.P.; Wei, G.Q.; Chen, H.; Ma, C.Y.; Jiang, H.Z. Natural fatty acid synthase inhibitors as potent therapeutic agents for cancers: A review. Pharm. Biol. 2016, 54, 1919–1925. [Google Scholar] [CrossRef]
- Du, G.J.; Zhang, Z.; Wen, X.D.; Yu, C.; Calway, T.; Yuan, C.S.; Wang, C.Z. Epigallocatechin gallate (EGCG) is the most effective cancer chemopreventive polyphenol in green tea. Nutrients 2012, 4, 1679–1691. [Google Scholar] [CrossRef] [PubMed]
- Yu, Y.; Deng, Y.; Lu, B.M.; Liu, Y.X.; Li, J.; Bao, J.K. Green tea catechins: A fresh flavor to anticancer therapy. Apoptosis 2014, 19, 1–18. [Google Scholar] [CrossRef] [PubMed]
- Suganuma, M.; Saha, A.; Fujiki, H. New cancer treatment strategy using combination of green tea catechins and anticancer drugs. Cancer Sci. 2011, 102, 317–323. [Google Scholar] [CrossRef] [PubMed]
- Wei, R.; Mao, L.; Xu, P.; Zheng, X.; Hackman, R.M.; Mackenzie, G.G.; Wang, Y. Suppressing glucose metabolism with epigallocatechin-3-gallate (EGCG) reduces breast cancer cell growth in preclinical models. Food Funct. 2018, 9, 5682–5696. [Google Scholar] [CrossRef] [PubMed]
- Pournourmohammadi, S.; Grimaldi, M.; Stridh, M.H.; Lavallard, V.; Waagepetersen, H.S.; Wollheim, C.B.; Maechler, P. Epigallocatechin-3-gallate (EGCG) activates AMPK through the inhibition of glutamate dehydrogenase in muscle and pancreatic ß-cells: A potential beneficial effect in the pre-diabetic state? Int. J. Biochem. Cell Biol. 2017, 88, 220–225. [Google Scholar] [CrossRef] [PubMed] [Green Version]
- Rauf, A.; Imran, M.; Butt, M.S.; Nadeem, M.; Peters, D.G.; Mubarak, M.S. Resveratrol as an anti-cancer agent: A review. Crit. Rev. Food Sci. Nutr. 2017, 58, 1428–1447. [Google Scholar] [CrossRef]
- Pandey, P.R.; Okuda, H.; Watabe, M.; Pai, S.K.; Liu, W.; Kobayashi, A.; Xing, F.; Fukuda, K.; Hirota, S.; Sugai, T.; et al. Resveratrol suppresses growth of cancer stem-like cells by inhibiting fatty acid synthase. Breast Cancer Res. Treat. 2011, 130, 387–398. [Google Scholar] [CrossRef] [Green Version]
- Rojas, C.; Pan-Castillo, B.; Valls, C.; Pujadas, G.; Garcia-Vallve, S.; Arola, L.; Mulero, M. Resveratrol enhances palmitate-induced ER stress and apoptosis in cancer cells. PLoS ONE 2014, 9, e113929. [Google Scholar] [CrossRef]
- Kma, L. Synergistic effect of resveratrol and radiotherapy in control of cancers. Asian Pac. J. Cancer Prev. 2013, 14, 6197–6208. [Google Scholar] [CrossRef] [Green Version]
- Zhu, W.; Lv, C.; Wang, J.; Gao, Q.; Zhu, H.; Wen, H. Patuletin induces apoptosis of human breast cancer SK-BR-3 cell line via inhibiting fatty acid synthase gene expression and activity. Oncol. Lett. 2017, 14, 7449–7454. [Google Scholar] [CrossRef]
- Wang, Y.; Nie, F.; Ouyang, J.; Wang, X.; Ma, X. Inhibitory effects of sea buckthorn procyanidins on fatty acid synthase and MDA-MB-231 cells. Tumor Biol. 2014, 35, 9563–9569. [Google Scholar] [CrossRef] [PubMed]
- Chiang, C.T.; Way, T.D.; Tsai, S.J.; Lin, J.K. Diosgenin, a naturally occurring steroid, suppresses fatty acid synthase expression in HER2-overexpressing breast cancer cells through modulating Akt, mTOR and JNK phosphorylation. FEBS Lett. 2007, 581, 5735–5742. [Google Scholar] [CrossRef] [PubMed]
- Impheng, H.; Richert, L.; Pekthong, D.; Scholfield, C.N.; Pongcharoen, S.; Pungpetchara, I.; Srisawang, P. [6]-Gingerol inhibits de novo fatty acid synthesis and carnitine palmitoyltransferase-1 activity which triggers apoptosis in HepG2. Am. J. Cancer Res. 2015, 5, 1319–1336. [Google Scholar]
- Lin, V.C.; Chou, C.H.; Lin, Y.C.; Lin, J.N.; Yu, C.C.; Tang, C.H.; Lin, H.Y.; Way, T.D. Osthole suppresses fatty acid synthase expression in HER2-overexpressing breast cancer cells through modulating Akt/mTOR pathway. J. Agric. Food Chem. 2010, 58, 4786–4793. [Google Scholar] [CrossRef] [PubMed]
- Lee, J.S.; Sul, J.Y.; Park, J.B.; Lee, M.S.; Cha, E.Y.; Song, I.S.; Kim, J.R.; Chang, E.S. Fatty acid synthase inhibition by amentoflavone suppresses HER2/neu (erbB2) oncogene in SKBR3 human breast cancer cells. Phytother. Res. 2013, 27, 713–720. [Google Scholar] [CrossRef] [PubMed]
- Liu, W.; Furuta, E.; Shindo, K.; Watabe, M.; Xing, F.; Pandey, P.R.; Okuda, H.; Pai, S.K.; Murphy, L.L.; Cao, D.; et al. Cacalol, a natural sesquiterpene, induces apoptosis in breast cancer cells by modulating Akt-SREBP-FAS signaling pathway. Breast Cancer Res. Treat. 2011, 128, 57–68. [Google Scholar] [CrossRef]
- Murata, S.; Yanagisawa, K.; Fukunaga, K.; Oda, T.; Kobayashi, A.; Sasaki, R.; Ohkohchi, N. Fatty acid synthase inhibitor cerulenin suppresses liver metastasis of colon cancer in mice. Cancer Sci. 2010, 101, 1861–1865. [Google Scholar] [CrossRef] [Green Version]
- Oh, J.; Hwang, I.H.; Hong, C.E.; Lyu, S.Y.; Na, M. Inhibition of fatty acid synthase by ginkgolic acids from the leaves of Ginkgo biloba and their cytotoxic activity. J. Enzym. Inhib. Med. Chem. 2012, 28, 565–568. [Google Scholar] [CrossRef] [Green Version]
- Losada-Echeberría, M.; Herranz-López, M.; Micol, V.; Barrajón-Catalán, E. Polyphenols as promising drugs against main breast cancer signatures. Antioxidants 2017, 6, 88. [Google Scholar] [CrossRef] [PubMed] [Green Version]
- Bruntz, R.C.; Lane, A.N.; Higashi, R.M.; Fan, T.W. Exploring cancer metabolism using stable isotope-resolved metabolomics (SIRM). J. Biol. Chem. 2017, 292, 11601–11609. [Google Scholar] [CrossRef] [PubMed] [Green Version]
- Jang, C.; Chen, L.; Rabinowitz, J.D. Metabolomics and isotope tracing. Cell 2018, 173, 822–837. [Google Scholar] [CrossRef] [PubMed]
- Gao, J.L.; Chen, Y.G. Natural compounds regulate glycolysis in hypoxic tumor microenvironment. Biomed. Res. Int. 2015, 2015, 354143. [Google Scholar] [CrossRef] [PubMed]
- Marbaniang, C.; Kma, L. Dysregulation of glucose metabolism by oncogenes and tumor suppressors in cancer cells. Asian Pac. J. Cancer Prev. 2018, 19, 2377–2390. [Google Scholar] [PubMed]
- Martinez-Outschoorn, U.E.; Peiris-Pages, M.; Pestell, R.G.; Sotgia, F.; Lisanti, M.P. Cancer metabolism: A therapeutic perspective. Nat. Rev. Clin. Oncol. 2017, 14, 113. [Google Scholar] [CrossRef] [Green Version]
- De Alteriis, E.; Cartenì, F.; Parascandola, P.; Serpa, J.; Mazzoleni, S. Revisiting the crabtree/warburg effect in a dynamic perspective: A fitness advantage against sugar-induced cell death. Cell Cycle 2018, 17, 688–701. [Google Scholar] [CrossRef] [Green Version]
- Adekola, K.; Rosen, S.T.; Shanmugam, M. Glucose transporters in cancer metabolism. Curr. Opin. Oncol. 2012, 24, 650–654. [Google Scholar] [CrossRef]
- De Berardinis, R.J.; Mancuso, A.; Daikhin, E.; Nissim, I.; Yudkoff, M.; Wehrli, S.; Thompson, C.B. Beyond aerobic glycolysis: Transformed cells can engage in glutamine metabolism that exceeds the requirement for protein and nucleotide synthesis. Proc. Natl. Acad. Sci. USA 2007, 104, 19345–19350. [Google Scholar] [CrossRef] [Green Version]
- Metallo, C.M.; Gameiro, P.A.; Bell, E.L.; Mattaini, K.R.; Yang, J.; Hiller, K.; Jewell, C.M.; Johnson, Z.R.; Irvine, D.J.; Guarente, L.; et al. Reductive glutamine metabolism by IDH1 mediates lipogenesis under hypoxia. Nature 2012, 481, 380–384. [Google Scholar] [CrossRef] [Green Version]
- Jiang, L.; Shestov, A.A.; Swain, P.; Yang, C.; Parker, S.J.; Wang, Q.A.; Terada, L.S.; Adams, N.D.; McCabe, M.T.; Pietrak, B.; et al. Reductive carboxylation supports redox homeostasis during anchorage-independent growth. Nature 2016, 532, 255–258. [Google Scholar] [CrossRef]
- Du, J.; Yanagida, A.; Knight, K.; Engel, A.L.; Vo, A.H.; Jankowski, C.; Sadilek, M.; Tran, V.T.; Manson, M.A.; Ramakrishnan, A.; et al. Reductive carboxylation is a major metabolic pathway in the retinal pigment epithelium. Proc. Natl. Acad. Sci. USA 2016, 113, 14710–14715. [Google Scholar] [CrossRef] [Green Version]
- Mullen, A.R.; Wheaton, W.W.; Jin, E.S.; Chen, P.H.; Sullivan, L.B.; Cheng, T.; Yang, Y.; Linehan, W.M.; Chandel, N.S.; De Berardinis, R.J. Reductive carboxylation supports growth in tumour cells with defective mitochondria. Nature 2011, 481, 385–388. [Google Scholar] [CrossRef] [PubMed] [Green Version]
- Kowalik, M.A.; Columbano, A.; Perra, A. Emerging role of the pentose phosphate pathway in hepatocellular carcinoma. Front. Oncol. 2017, 7, 87. [Google Scholar] [CrossRef] [PubMed] [Green Version]
- Li, B.; Qiu, B.; Lee, D.S.; Walton, Z.E.; Ochocki, J.D.; Mathew, L.K.; Mancuso, A.; Gade, T.P.; Keith, B.; Nissim, I.; et al. Fructose-1,6-bisphosphatase opposes renal carcinoma progression. Nature 2014, 513, 251–255. [Google Scholar] [CrossRef] [PubMed] [Green Version]
- Fan, J.; Ye, J.; Kamphorst, J.J.; Shlomi, T.; Thompson, C.B.; Rabinowitz, J.D. Quantitative flux analysis reveals folate-dependent NADPH production. Nature 2014, 510, 298–302. [Google Scholar] [CrossRef] [Green Version]
- Lao-On, U.; Attwood, P.V.; Jitrapakdee, S. Roles of pyruvate carboxylase in human diseases: From diabetes to cancers and infection. J. Mol. Med. 2018, 96, 237–247. [Google Scholar] [CrossRef] [PubMed]
- Forbes, N.S.; Meadows, A.L.; Clark, D.S.; Blanch, H.W. Estradiol stimulates the biosynthetic pathways of breast cancer cells: Detection by metabolic flux analysis. Metab. Eng. 2006, 8, 639–652. [Google Scholar] [CrossRef]
- Gaude, E.; Schmidt, C.; Gammage, P.A.; Dugourd, A.; Blacker, T.; Chew, S.P.; Saez-Rodriguez, J.; O′Neill, J.S.; Szabadkai, G.; Minczuk, M.; et al. NADH shuttling couples cytosolic reductive carboxylation of glutamine with glycolysis in cells with mitochondrial dysfunction. Mol. Cell 2018, 69, 581–593. [Google Scholar] [CrossRef] [Green Version]
- Lewis, C.A.; Parker, S.J.; Fiske, B.P.; McCloskey, D.; Gui, D.Y.; Green, C.R.; Vokes, N.I.; Feist, A.M.; Vander Heiden, M.G.; Metallo, C.M. Tracing compartmentalized NADPH metabolism in the cytosol and mitochondria of mammalian cells. Mol. Cell 2014, 55, 253–263. [Google Scholar] [CrossRef] [Green Version]
- Pandey, R.; Riley, C.L.; Mills, E.M.; Tiziani, S. Highly sensitive and selective determination of redox states of coenzymes Q9 and Q10 in mice tissues: Application of orbitrap mass spectrometry. Anal. Chim. Acta 2018, 1011, 68–76. [Google Scholar] [CrossRef]
- Stefely, J.A.; Pagliarini, D.J. Biochemistry of mitochondrial coenzyme q biosynthesis. Trends Biochem. Sci. 2017, 42, 824–843. [Google Scholar] [CrossRef]
- Ducker, G.S.; Chen, L.; Morscher, R.J.; Ghergurovich, J.M.; Esposito, M.; Teng, X.; Kang, Y.; Rabinowitz, J.D. Reversal of cytosolic one-carbon flux compensates for loss of the mitochondrial folate pathway. Cell Metab. 2016, 23, 1140–1153. [Google Scholar] [CrossRef] [PubMed] [Green Version]


| Bioactive Compounds | Source | Effect | Cancers | Ref. |
|---|---|---|---|---|
| Naringenin (a flavonoid) | Citrus fruits, tomatoes, figs | Inhibit insulin stimulated glucose uptake | Breast, prostate, melanoma, liver | [9,10,11,12,13,14,15,16,17,18,19] |
| Myricetin, Fisetin, Quercetin, Isoquercitin (flavonoid) | Tomatoes, oranges, nuts, berries, tea | Inhibit GLUT2 | [20] | |
| Phloretin (dihydrochalcone) | Apple tree leaves, apple | Inhibit GLUT1 and GUT2, induce glutathione biosynthesis | Lung, liver, colon, gastric, esophageal, breast epithelial, prostate, glioblastoma | [21,22,23,24,25,26,27,28,29,30,31,32,33,34,35] |
| Silybinin (flavonoid) | Milk thistle | Interact with GLUT1 and GLUT4 | Prostate, breast, ovary, colon, lung, bladder | [36,37,38,39,40,41,42] |
| Curcumin | Turmeric | Decrease GLUT1 and hexokinase II protein level | Liver, breast, pancreatic, hepatic, gastric, colorectal, prostate | [43,44,45,46,47,48,49] |
| Mannoheptulose | Avocado | Inhibit hexokinase | [38,50] | |
| Sulforaphane (isothiocyanate derivative) | Cruciferous vegetables, such as broccoli | Inhibit phosphofructokinase | breast, prostate, colon, skin, lung, gastric, bladder | [51,52,53,54,55] |
| Koningic acid | Fungi | Inhibit glyceraldehyde-3-phohohate dehydrogenase | Neuroblastoma | [56,57,58] |
| Shikonin (naphthoquinone derivative) | Dried root of the plant Lithospermum erythrorhizon | Inhibit pyruvate kinase M2 | Lung, leukemia, breast, melanoma, bladder, esophageal | [59,60,61,62,63] |
| Vitamin K3 and K5 | Inhibit pyruvate kinase M2 | Cervix | [64] | |
| Oleanolic acid | Olive oil, garlic | Switch PKM2 to PKM1 | [65] | |
| Gossypol (polyphenolic aldehyde) | Cotton seeds | Non-selective lactate dehydrogenase inhibitor that competes with NADH | Melanoma, lung, breast, cervix, leukemia, glioblastoma, myeloma, colon, prostate | [66,67,68,69,70,71,72,73] |
| α-cyano-4-hydroxycinnamate (Cinnamic acid derivative) | Inhibit monocarboxylate transporter | Glioma, pancreatic, Dalton’s lymphoma | [74,75,76,77,78,79,80,81] | |
| Polydatin | Grape, peanut, hop cones, red wines, hop pellets, cocoa-containing products | Inhibit glucose-6-phosphate dehydrogenase | Cervix, hepatoma, epidermal carcinoma, nasopharyngeal carcinoma | [82,83] |
| Ursolic acid | Apples, basil, cranberries, peppermint, rosemary, lavender, oregano, thyme, prunes | Inhibit ASCT2- glutamine transporter | Prostate, breast, cervix | [8,84,85,86] |
| Gracillin | Inhibit mitochondrial complex II | Lung, colorectum, prostate, pharynx, liver | [87] | |
| Capsaicin | Peppers | Inhibit mitochondrial respiration | Cutaneous squamous cell carcinoma | [88] |
| Berberine | Root, rhizome, and stem bark of barberry, goldenseal, Oregon grape, and tree turmeric | Inhibit mitochondrial respiration | [89] | |
| (-)-epigallocatechin-3- gallate (EGCG) | Tea | Inhibit expression of fatty acid synthase | Colorectal, breast | [90,91,92,93,94,95] |
| Resveratrol | Peels and seeds of grape | Inhibit fatty acid synthase | Breast, uterine, blood, kidney, liver, eye, bladder, thyroid, esophageal, prostate, brain, lung, skin, gastric, colon, head and neck, bone, ovarian, cervix | [90,96,97,98,99] |
| Patuletin | Pipeworts | Inhibit expression of fatty acid synthase | Breast | [100] |
| Sea buckthorn procyanidins | Sea buckthorn | Inhibit fatty acid synthase | Breast | [101] |
| Diosgenin | Fenugreek, wild yam | Inhibit fatty acid synthase | HER2 overexpressing breast | [102] |
| [6]-Gingerol | Ginger | Suppress fatty acid β-oxidation | Liver | [103] |
| Bioactive Compounds | Target | Stable Isotope Tracer |
|---|---|---|
| Naringenin, phloretin, sylibinin, cytochalasin, curcumin, mannoheptulose, sulforaphane, gossypol, konningic acid, shikonin | Inhibit glucose uptake and glycolysis | U-13C glucose |
| Polydatin | Inhibit PPP | [1,2-U-13C] glucose, 1-13C glucose and 6-13C glucose |
| Ursolic acid | Inhibit glutamine uptake | U-13C glutamine |
| Koningic acid | Inhibit GAPDH | 4-2H-glucose |
| Phloretin | Induce glutathione biosynthesis | U-13C- glutamine or U-13C- glycine |
| EGCG, resveratrol, patuletin, diosgenin, [6]-gingerol | Inhibit fatty acid biosynthesis | U-13C glucose, U-13C glutamine |
© 2020 by the authors. Licensee MDPI, Basel, Switzerland. This article is an open access article distributed under the terms and conditions of the Creative Commons Attribution (CC BY) license (http://creativecommons.org/licenses/by/4.0/).
Share and Cite
Choudhury, F.K.; Hackman, G.L.; Lodi, A.; Tiziani, S. Stable Isotope Tracing Metabolomics to Investigate the Metabolic Activity of Bioactive Compounds for Cancer Prevention and Treatment. Cancers 2020, 12, 2147. https://doi.org/10.3390/cancers12082147
Choudhury FK, Hackman GL, Lodi A, Tiziani S. Stable Isotope Tracing Metabolomics to Investigate the Metabolic Activity of Bioactive Compounds for Cancer Prevention and Treatment. Cancers. 2020; 12(8):2147. https://doi.org/10.3390/cancers12082147
Chicago/Turabian StyleChoudhury, Feroza K., G. Lavender Hackman, Alessia Lodi, and Stefano Tiziani. 2020. "Stable Isotope Tracing Metabolomics to Investigate the Metabolic Activity of Bioactive Compounds for Cancer Prevention and Treatment" Cancers 12, no. 8: 2147. https://doi.org/10.3390/cancers12082147