


Abstract
The role of CTGF/CCN2 in osteolytic metastasis by breast cancer cells and its mechanism of action were studied. Osteolytic metastasis accompanied by CCN2 and PTHrP overproduction was efficiently inhibited by an anti‐CCN2 antibody. Furthermore, we found that CCN2 was induced by PTHrP through PKA‐, PKC‐, and ERK‐mediated pathways therein.
Introduction: Connective tissue growth factor (CTGF/CCN2) is a mediator of local angiogenesis induced by breast cancer, but its role in osteolytic metastasis has not been evaluated. PTH‐related peptide (PTHrP) is another critical factor in the development of the osteolytic metastasis. Using both in vivo and in vitro approaches, we studied whether/how neutralization of CCN2 prevented bone metastasis and how PTHrP signaling is related.
Materials and Methods: A mouse model of bone metastasis by human breast cancer cell line MDA231 was treated with a CCN2‐neutralizing antibody, and osteolytic bone metastases were assessed on radiographs and immunohistochemistry. Ccn2 gene expression and transcription were examined by Northern blot and luciferase analysis. Immunoblot analysis and kinase inhibitors were used to identify the signaling pathways implicated. Anti‐angiogenic/osteoclastogenic effects of ccn2 downregulation were also evaluated.
Results: Treatment of mice with a CCN2‐neutralizing antibody greatly decreased osteolytic bone metastasis, microvasculature, and osteoclasts involved. The antibody also suppressed the growth of subcutaneous tumor in vivo and proliferation and migration of human umbilical vein endothelial cells (HUVECs) in vitro. Downregulation of ccn2 also repressed osteoclastogenesis. CCN2 expression was specifically observed in cancer cells producing PTHrP and type I PTH/PTHrP receptor (PTH1R) invaded the bone marrow, and PTHrP strongly upregulated ccn2 in MDA231 cells in vitro. Activation of protein kinase C (PKC) and protein kinase A (PKA) was necessary and sufficient for the stimulation of ccn2 by PTHrP. Indeed, inhibition of the extracellular signal‐regulated kinase (ERK1/2), PKC, or PKA by specific inhibitors counteracted the stimulation of ccn2 expression. Incubation of MDA231 cells with PTHrP induced the activation of ERK1/2. Consistent with these findings, inhibition of PKC prevented PTHrP‐induced ERK1/2 activation, whereas 12‐O‐tetradecanoylphorbol13‐acetate (TPA), a stimulator of PKC, upregulated it.
Conclusions: CCN2 was critically involved in osteolytic metastasis and was induced by PKA‐ and PKC‐dependent activation of ERK1/2 signaling by PTHrP. Thus, CCN2 may be a new molecular target for anti‐osteolytic therapy to shut off the PTHrP–CCN2 signaling pathway.
INTRODUCTION
Bone metastasis is a frequent complication of several common human malignancies, including breast, prostate, and lung cancer,(1,2) and is associated with a high morbidity rate because of intractable bone pain, pathological fractures, hypercalcemia, and nerve compression.(2) Current experimental studies support the notion that there is a vicious circle at the bone metastatic site where metastatic cells stimulate osteoclast‐mediated bone resorption, whereas bone‐derived growth factors released from the resorbed bone promote tumor growth.(3) Also, tumor‐associated neovascularization is another necessary event for the growth and metastatic spread of these tumors.(4,5) In fact, there has been some experimental evidence to indicate that human MDA231 breast cancer cells cause the development of highly vascularized skeletal lesions in animals.(6) Interestingly, the systemic treatment of animals with the anticancer drug TNP‐470 (a synthetic analog of fumagillin with anti‐angiogenic properties) reduced the formation of bone metastases caused by MDA231 cells.(7) However, the molecular mechanism underlying the contribution of tumor osteolysis and angiogenesis to the growth of bone metastases is not well understood.
Connective tissue growth factor (CTGF/CCN2) is a cysteine‐rich secretory protein and belongs to the CCN family, which consists of six members: CYR61 (CCN1), CTGF (CCN2), NOV (CCN3), Wnt‐induced secreted protein WISP‐1 (CCN4), WISP‐2 (CCN5), and WISP‐3 (CCN6). These proteins consist of distinct modules in their structure (i.e., IGF‐binding protein‐like module [IGF‐BP], von Willebrand factor type C repeat [VWC], thrombospondin type‐1 repeat [TSP1], and C‐terminal module [CT]), except for CCN5, which lacks the CT module. With these modules, CCN proteins interact with a number of extracellular molecules, such as adhesion proteins, proteoglycans, and growth factors including TGF‐β(8–12) and modulate diverse cellular functions including chemotaxis, differentiation, and apoptosis.(13,14) In particular, we found that CCN2 induced the proliferation, migration, and adhesion of, and tube formation by, vascular endothelial cells in culture.(15,16) Consistent with these findings, Ivkovic et al.(17) reported that CCN2‐null mice were lethal on delivery and were characterized by defective angiogenesis and critical protease expression in growth plate resulting in derangement of endochondral ossification and skeletal malformation. It should be noted that CCN2 was earlier found to be strongly expressed by MDA231 breast cancer cells and that experimental neovascularization induced by these cells in the chicken chorioallantoic membrane was suppressed by CCN2‐neutralizing antibodies.(18) Moreover, Kang et al.(19) recently reported that CCN2 was one of the contributors to bone metastasis, which could convert low‐metastatic breast cancer cells to high‐metastatic ones under the collaboration with the other contributors. Also, CCN2 is regulated by TGF‐β in skin and renal fibroblasts in promoting fibrotic disorders(20,21) and is a stromal‐expressed factor that promotes tumorigenesis.(22)
Substantial evidence suggests that PTH‐related peptide (PTHrP) is involved in breast cancer progression as well. In particular, studies have shown that PTHrP plays a major role in the preferential metastatic spread of breast cancer cells to the skeleton.(23) Neutralizing antibodies against PTHrP were shown to inhibit the development and progression of bone metastasis of the human breast cancer cells in a mouse model.(23,24) Localized production of PTHrP by breast cancer cells in those lesions was shown to promote the survival and proliferation of cancer cells and osteolysis in this mouse model.(23) A prospective clinical study has shown that PTHrP expression by primary breast cancer cells correlates with decreased metastasis to bone, suggesting different roles for this factor at primary and metastatic sites.(25) Therefore, the role of PTHrP in bone metastasis is still controversial. However, it should be noted here that PTHrP strongly induces CCN2 gene expression in bladder smooth muscle cells.(26)
PTHrP and PTH bind to the type 1 PTH/PTHrP receptor (PTH1R(27,28)), a seven transmembrane spanning G protein–coupled receptor (GPCR) (29–31); and the receptor‐ligand interaction results in activation of at least two signal transduction systems (i.e., the adenylyl cyclase/protein kinase A [PKA] and the phopholipase C/protein kinase C [PKC] pathways).(29) In Chinese hamster ovary cells and yolk sac carcinoma cells, PTH activates extracellular signal‐regulated kinase (ERK1/2) through a cAMP‐mediated pathway.(32) PTHrP enhances proliferation in osteoblastic cell cultures and marrow osteoprogenitor cells through PKC‐dependent activation of ERK1/2.(33) Thus, it seems that PTHrP action during growth and differentiation of diverse cell types involves the participation of multiple signaling pathways.(34)
In this study, we obtained evidence for the critical involvement of CCN2 in osteolytic metastasis of breast cancer cells and the use of this factor as a new molecular target therein. Using in vivo and in vitro models, we show that (1) neutralizing antibodies against CCN2 significantly inhibited local tumor growth, angiogenesis, and osteolysis caused by metastatic human breast cancer cells and (2) ccn2 gene expression was stimulated by PTHrP, which is mediated through PKA‐ and PKC‐dependent activation of an ERK1/2 pathway.
MATERIALS AND METHODS
Materials
Human PTHrP(1‐34), dibutyryl‐cAMP (db‐cAMP), and 12‐O‐tetradecanoylphorbol‐13‐acetate (TPA) were obtained from Sigma (St Louis, MO, USA). PD98059, SB203580, H89, GF109203X, and wortmannin were purchased from Calbiochem (La Jolla, CA, USA). Recombinant TGF‐β1 was purchased from R&D Systems (Minneapolis, MN, USA). Anti‐TGF‐β (goat IgG), PTHrP (goat IgG), PTH1R (mouse IgG), ERK1/2 (mouse IgG), pERK1/2 (mouse IgG), p38 (mouse IgG), and p‐p38 (mouse IgM) antibodies for immunohistochemistry and immunoblot were purchased from Santa Cruz Biotechnology (Santa Cruz, CA, USA). Anti‐CCN2 (mouse IgG) antibody for immunohistochemistry and immunoblot was purchased from R&D Systems. Humanized anti‐PTHrP neutralizing antibody(35) was kindly provided by Chugai Research Laboratories (Kanagawa, Japan). Anti‐mouse CD31 monoclonal antibody was purchased from BD Biosciences (San Jose, CA, USA). An anti‐CCN2 monoclonal antibody used in vivo, JMAb 31, was prepared and humanized based on an established methodology using a recombinant CCN2 protein as an immunogen. The subclass of the antibody was determined to be human IgG2 and specifically recognized the VWC module of human CCN2.(36) This monoclonal antibody and human ccn2 promoter construct pTS589 (from −802 to +22(37)) were kindly prepared and provided by JT Central Pharmaceutical Research Institute (Takatsuki, Japan). For control experiments, normal mouse IgG was purchased from MP Biomedicals (Aurora, OH, USA).
Cell culture
A highly metastatic variant of MDA‐MB‐231/MDA231(38,39) was cultured in DMEM (Invitrogen, Grand Island, NY, USA) containing 10% FCS (JRH Bioscience, Lenexa, KS, USA) and 1% penicillin/streptomycin solution (Invitrogen), in a 37°C atmosphere of 5% CO2/air. Normal human umbilical vein endothelial cells (HUVECs) were cultured in endothelial cell growth medium‐2 (Cambrex BioScience, Verviers, Belgium).
Evaluation of the effects of CCN2 antibody on MDA231‐induced bone metastases
A mouse model of bone metastasis was prepared by inoculating mice with tumor cell suspensions of MDA231 cells (105 cells/100 μl of PBS) through the left cardiac ventricle, as described previously.(39) The mice were divided into three treatment groups (n = 10/group) and injected with the cells on day 0. Administration of antibodies was carried out at a dose of 100 μg intraperitoneal injection twice per week, starting on day 0 of tumor inoculation and continuing throughout the experiment. These three groups comprised mice injected with murine monoclonal antibody directed against human CCN2 (CCN2 Ab), those given control IgG, and those left uninjected. On day 25, radiographs were obtained; and hind limbs were processed. The Animal Committee of Okayama University Graduate School of Medicine and Dentistry approved all of the experimental procedures.
Radiographs and measurement of osteolytic lesion areas
Osteolytic bone metastases were assessed on radiographs as previously described.(39) The mice were anesthetized with an intraperitoneal injection of pentobarbital (0.05 mg/g body weight), placed laterally in the prone position against the films (22 × 27 cm; Fuji industrial film FR: Fuji Photo Film Co., Tokyo, Japan), and exposed to soft X‐rays at 35 kV for 20 s using a Sofron apparatus (Sofron, Tokyo, Japan). The radiolucent bone lesions in the hind limbs were observed microscopically (×20; Nikon, Tokyo, Japan), and the areas were quantified with a Hamamatsu image processor (ARGUS 20; Hamamatsu Photonics, Hamamatsu, Japan) and NIH image‐processing and ‐analyzing software (NIH, Bethesda, MD, USA).
Bone histology and immunochemistry
Hindlimb long bones of nude mice that had been injected with cancer cells were excised, fixed in 10% neutral‐buffered formalin, decalcified, and embedded in paraffin. The sections were stained with H&E. The total tumor area, number of microvascular vessels (200x/field), and osteoclast number per millimeter of tumor/bone interface were measured in midsections of tibias and femora without knowledge of the experimental groups. Histomorphometric analysis was performed by using NIH image‐processing and ‐analyzing software (NIH). For immunochemistry, the paraffin sections were treated with 1500 units/ml bovine testis hyaluronidase in PBS containing 10% FCS for 3 h at 37°C. They were next blocked with 10% goat serum and reacted with a 1:200 dilution of anti‐CCN2, TGF‐β, PTHrP, PTH1R, or CD31 antibody overnight at 4°C. Then, the sections were washed three times with PBS and thereafter reacted for 1 h with fluorescein isothiocyanate (FITC) or tetramethyl rhodamine isothiocyanate (TRITC)‐conjugated anti‐rabbit or anti‐mouse IgG serum in 3% BSA‐PBS. CD31+ vessels were stained with a VECTASTAIN ABC Kit according to the manufacturer's instruction (Vector Laboratories, Burlingame, CA, USA). Counterstaining was performed with hematoxylin. The sections were finally washed three times with PBS, mounted, and viewed under a laser‐scanning confocal microscope (BIO‐RAD) or light microscope (NIKON).
Northern blot analysis
Total RNA was prepared from cultured MDA231 cells by using TRIZOL (Life Technologies) reagent. Northern blot analysis was carried out by following a standard procedure. Briefly, total RNA was denatured by glyoxalation, size‐fractionated by gel electrophoresis in 1% agarose gels at 20 μg/lane, and transferred to membrane by capillary blotting, as described previously.(40) Blots were stained with 0.04% methylene blue to verify that each sample had been transferred efficiently. Subsequently, blots were hybridized for 16 h with [32P]labeled human ccn2 cDNA probes(41) at a concentration of 2.5 × 10⁶ dpm/ml in hybridization solution containing 50% formamide, 6× SSC, 1% SDS, 200 μg/ml sheared and denatured salmon sperm DNA, and 10× Denhardt reagent. The hybridization temperature was 42°C. After hybridization, the blots were rinsed several times at room temperature with 2× SSC and 0.5% SDS, followed by a final high‐stringency rinse with 0.1× SSC and 0.5% SDS at room temperature. Finally, they were exposed to Hyper X‐ray film (Amersham Pharmacia Biotech, Buckinghamshire, UK) at −70°C for 1 day.
Immunoblot analysis
For the analysis of supernatants, immunoprecipitation was carried out before immunoblotting. Namely, 300 μl of culture medium was precleared by incubation with 0.25 μg of rabbit IgGs and protein G‐agarose beads for 30 minutes at 4°C. Beads were pelleted by centrifugation at 2500 rpm for 5 minutes at 4°C, and the cleared supernatants were transferred to fresh tubes at 4°C. Supernatants were mixed with 10 μl of CCN2 antibodies (∼5 μg) for 1 h at 4°C; 20 μl of protein G‐agarose beads was added and mixture was incubated at 4°C on a rotator overnight. Beads were recovered by centrifugation, rinsed three times with lysis buffer, and resuspended in sample buffer (50 mM Tris‐HCl, pH 6.8, 2% SDS, 0.1% bromophenol blue, and 10% glycerol). MDA231 cultures were rinsed with ice‐cold PBS and lysed in ice‐cold lysis buffer (50 mM Tris‐HCl, 150 mM NaCl, 1% Triton X‐100, 1% NP‐40, 10 mM NaF, 1 μg/ml leupeptin, 2 μg/ml aprotinin, and 1 mM phenylmethylsufonyl fluoride, pH 7.4) on ice. Lysates were clarified by centrifugation at 14,000 rpm for 20 minutes at 4°C, and protein concentrations in the supernatant were determined by BCA assay. Aliquots of cell lysates (20 μg proteins) and culture medium from each sample were separated by electrophoresis on 10% SDS‐polyacrylamide gels. Proteins were transferred to polyvinylidene difluoride membranes (Immobilon‐P; Millipore Co.) and processed for immunoblot with 1: 200 dilutions of the antibodies. Bands were visualized by the ECL detection method (RPN 2109, Amersham Biosciences), as described previously.(42)
DNA transfection and luciferase assay
An 800‐bp ccn2 promoter‐driven firefly luciferase reporter construct, pTS589, was used.(37) For transient transfection studies, MDA231 cells were plated at a density of 1 × 10⁵ cells/well in 12‐well plates and incubated for 24 h in complete medium. The cells were transfected with 1 μg of the specific promoter‐reporter construct using FuGENE 6 transfection reagent (Roche, Basel, Switzerland) according to the manufacturer's instructions. A Renilla luciferase construct, phRL‐TK (int‐; Promega, Madison, WI, USA), was used as an internal control for monitoring transfection efficiency. The Dual Luciferase System (Promega) was used for the sequential measurement of firefly and Renilla luciferase activities with specific substrates of beetle luciferin and coelenterazine, respectively. Quantification of both luciferase activities and calculation of relative ratios were carried out manually with a luminometer (Fluoroskan Ascent FL, Labsystems, Helsinki, Finland). All transfection experiments were repeated three times in duplicate.
Evaluation of the effects of CCN2 antibody on MDA231 xenograft at extraskeletal site
A mouse model of xenograft at extraskeletal site was prepared by inoculating mice with tumor cell suspensions of MDA231 cells (8 × 10⁶ cells/100 μl of PBS) by subcutaneous injection at the right hip area, as described previously.(39) The mice were divided into three treatment groups (n = 4/group) and were implanted with the cells on day 0. Administration of antibodies was carried out at a dose of 100 μg intraperitoneal injection twice per week, starting on day 0 of tumor inoculation and continuing throughout the experiment. The tumor growth was determined with a caliper. The tumor volume (cubic mm) was calculated from the equation, 4π/3 × (r1/2 + r2/2)3, where r1 = longitudinal radius, and r2 = transverse radius, as described previously.(43) The Animal Committee of Okayama University Graduate School of Medicine and Dentistry approved all of the experimental procedures.
Inhibition of ccn2 gene expression by antisense phosphorothioate (S)‐oligodeoxynucleotides
The S‐oligodeoxynucleotide with the antisense sequence from the 1st to the 16th nucleotide of mouse ccn2 cDNA coding region was synthesized and purified by reverse‐phase high‐performance liquid chromatography (Greiner Japan, Tokyo, Japan). The nucleotide sequence of the antisense was 5′‐CGACGGAGGCGAGCAT‐3′. The corresponding sense sequence 16‐mer was also prepared as a negative control. The cells were treated with 5 or 10 μM antisense or sense S‐oligodeoxynucleotide for 6 days, with medium exchange and addition of S‐oligodeoxynucleotides every 2 days. After that, the cells were used for further experiments. The effectiveness of the antisense S‐oligodeoxynucleotide on repressing ccn2 expression was already established.(15)
[3H] Thymidine incorporation assay
The proliferation of HUVEC and MDA231 cells were assessed by measuring the incorporation of [3H] thymidine into the cells. HUVEC and MDA231 cells (1 × 10⁴) were treated with antibodies in EBM‐2 or DMEM containing 10% FCS in 96‐well plates, respectively. These cultures were pulse‐labeled for the last 4 h of a 48‐h culture period with 10 μCi/well of [3H] thymidine (Amersham Pharmacia). The radioactivity incorporated into acid‐precipitated materials was counted by μβ scintillation counter (Micro Beta Plus; Wallac, Gaithersburg, MD, USA).
Migration assay
Migration of HUVEC and MDA231 cells were studied in Boyden chamber. HUVEC and MDA231 cells in logarithmic growth phase were detached by trypsin‐EDTA, and 1 × 10⁵ cells were pretreated with antibodies for 15 minutes at room temperature in EBM‐2 or DMEM containing 10% FCS and were added onto polycarbonate membranes (pore size 8.0 mm: Becton Dickinson, Franklin Lakes, NJ, USA). EBM‐2 or DMEM containing 10% FCS was added to the lower chamber, and the system was incubated at 37 °C for 6 h in 5% CO2. After incubation and fixation, nonmigrating cells were removed with a cotton swab, and the remaining were stained by 2% Crystal Violet (Sigma). Filters were examined microscopically for cells on the lower side of the membrane. The number of cells in four microscopic fields were counted and the average of three wells was determined.
In vitro osteoclastogenesis
We examined the effect of CCN2 on osteoclast formation in a murine bone marrow culture stimulated with 1,25(OH)2 vitamin D3 under a modification of the technique originally described by Takahashi et al.(44) In brief, bone marrow cells were aseptically obtained from the tibia and femur of 5‐week‐old male C57BL/6 mice (CLEA Japan, Tokyo, Japan). The bone marrow cells were cultured in a 24‐well plate (2 × 10⁶ cells/0.5 ml/well) with α‐MEM (Invitrogen) supplemented with 1% penicillin‐streptomycin solution (Invitrogen), 10% FCS, and 10−8 M 1,25(OH)2 vitamin D3 (Calbiochem) containing CCN2 S‐oligodeoxynucleotide at 37°C in humidified atmosphere of 5% CO2 in air. For formation of osteoclast from co‐culture, spleen cells were collected from 5‐week‐old male C57BL/6 mice. Erythrocytes contaminating the spleen cell fraction were eliminated by adding 0.83% ammonium chloride in 10 mM Tris/HCl (pH 7.4) to the cell pellet. Mouse clonal stromal cells from bone marrow (ST2 cells RIKEN Cell Bank, Tsukuba, Japan) were co‐cultured (2 × 10⁴ cells/well) with mouse spleen cells (1 × 10⁵ cells/well) in α‐MEM that contained 10% FCS and 10−8 M 1,25(OH)2 vitamin D3 in 48‐well plates. The cultures were maintained at 37°C in a humidified atmosphere of 5% CO2 in air. Fresh medium, 1,25(OH)2 vitamin D3 and CCN2 S‐oligodeoxynucleotide were supplied at 2‐day intervals. On day 7, the cultures were fixed with 60% acetone in citrate buffer (Sigma) and stained for TRACP as a marker for osteoclast using a Leukocyte Acid Phosphatase Kit (Sigma). Stained TRACP+ multinucleated cells (three or more nuclei) were counted manually under light microscopy.
RT‐PCR analysis
The reverse transcription was carried out using 5 μg total RNA, 0.5 μg oligo d(T)18, 10 mM dNTP, 0.01 M DTT, 1× first strand buffer, 40 U RNaseOut, and 200 U SuperScript‐II RNaseH− Reverse Transcriptase (Invitrogen Life Technologies) in a final volume of 20 μl, following the manufacturer's instructions. PCR reaction was carried out using 1 μl of diluted (1:5) cDNA and 10 μM oligonucleotide primers specific for mouse CCN2 mRNA: sense, 5′‐GGTAAGGTCCGATTCCTACCAGG‐3′; antisense, 5′‐CTAGAAAGGTGCAAACATGTAAC‐3′ (predicted size of the amplicon: 120 bp) in PCR (Invitrogen). PCR conditions were as follows: one cycle at 94°C for 5 minutes; 30 cycles at 94°C for 30 s, 56°C for 30 s, and 72°C for 30 s; and one cycle at 72°C for 7 minutes. To normalize the signals, 1 μl of diluted cDNA was mixed with 10 μM primers specific for the mouse glyceroaldehyde‐3‐phosphate dehydrogenase (G3PDH) mRNA: sense, 5′‐AACGGGAAGCTCACTGGCATG‐3′; antisense, 5′‐TCCACCACCCTGTTGCT‐3′ (predicted size of the amplicon: 368 bp); and amplified in the previously described PCR mix. Finally, 25 μl of PCR amplification mixture was analyzed by electrophoresis on 2.0% agarose gel in 1× TAE buffer with 0.5 μg/ml ethidium bromide.
Statistical analysis
Data were analyzed using the unpaired Student's t‐test for analysis of two groups, Fisher's protected least significant difference (PLSD) for analysis of multiple group comparisons, and Mann‐Whitney's U‐test for analysis of subcutaneous tumor volume. Results were expressed as mean ± SD. p < 0.05 was considered statistically significant.
RESULTS
Effects of an anti‐CCN2 antibody on osteolytic bone metastasis in vivo
Because the recent study by Kang et al.(19) suggested that local CCN2 production by cancer cells in bone may be important in breast cancer–associated osteolysis, the first experiment was designed to determine the role of CCN2 in the development of MDA231‐induced osteolysis. Nude mice were treated with a murine monoclonal antibody directed against CCN2 before intracardiac inoculation of tumor cells and comparatively analyzed with similarly inoculated animals treated with control IgG. Anti‐CCN2 Ab and control IgG were administered at a dose of 100 μg/mouse twice per week throughout the experiment. The mice were processed 25 days after tumor inoculation. Figure 1A shows representative radiographs taken 25 days after tumor inoculation. Obvious osteolytic lesions were present in mice that had received control IgG or no treatment (data not shown), whereas very few metastatic lesions were present in the mice treated with the anti‐CCN2 Ab. The total area of radiographic osteolytic lesions from all long bones was quantified using a computerized image‐analysis system (Fig. 1C). The lesion area was significantly smaller in mice treated with the anti‐CCN2 Ab than in those given the control IgG (p < 0.01). Values for the control IgG and no treatment groups were not statistically different (data not shown). Representative histologic sections through the proximal tibial metaphysis are presented in Fig. 1B. The tumor cells had filled the bone marrow space and destroyed both trabecular and cortical bone in mice that had received the control IgG. In contrast, most of the anti‐CCN2 Ab‐treated mice retained intact cortical and trabecular bone; many bones had no evidence of tumor involvement. Even when a tumor was present in the bone marrow space in these mice, it was often present as small, discrete foci within the marrow cavity and associated with little bone destruction. Histomorphometric analysis of the hind limbs from mice in all treatment groups confirmed the radiographic quantification of the osteolytic lesion area (Fig. 1D). The histological tumor area (Fig. 1E), CD31+ vascular endothelial cell number (Figs. 1C and 1F), and osteoclast number per millimeter of tumor/bone interface (Fig. 1G) were significantly smaller in mice treated with the anti‐CCN2 Ab than in those that received the control IgG.
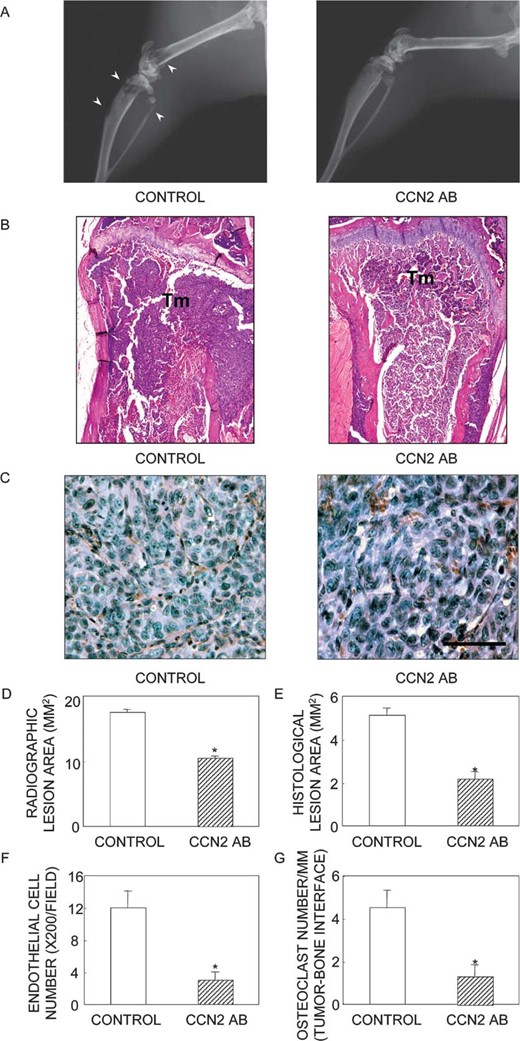
Radiographic and histomorphometric analysis of bone from mice bearing MDA231 and treated with either control IgG or neutralizing CCN2 mAb (n = 10/group). (A) Representative radiographs of hind limbs from mice 25 days after tumor inoculation. The arrowheads indicate osteolytic lesions. (B) Bone histology of the midtibial metaphyses. Tumor (Tm) filled the marrow cavity and replaced normal cellular elements in mice treated with control IgG. Significant loss of trabecular and cortical bone was observed in this group. In contrast, only small foci of tumor cells were present in mice treated with anti‐CCN2 mAb, and bone destruction was not evident. (C) Angiogenesis of MDA231 tumor tissue sections after immunostaining of blood vessels with an anti‐CD31 antibody. CD31‐positive microvessels are stained brown. (D) Osteolytic lesion area (mm) on radiographs of hind limbs from tumor‐bearing mice. (E) Histomorphometric analysis of hind limbs from mice with osteolytic lesions. Data represent measurements of tumor area (mm2) from midsections of tibias and femora of mice. (F) Microvasculature (endothelial cell number/mm2) in the tumor area. (G) osteoclast number/mm of tumor margin adjacent to bone (tumor‐bone border). These values were significantly lower in anti‐CCN2 mAb‐treated animals than in control IgG‐treated ones: *p < 0.01 for tumor area, microvasculature, and osteoclast number. The values represent the means ± SD.
Co‐localization of CCN2 with TGF‐β and PTHrP in bone metastasis
In the metastatic cells, ccn2 induction through the paracrine TGF‐β pathway may participate in the vicious circle of bone metastasis, whereas PTHrP is the central mediator of TGF‐β–induced osteolytic metastasis.(45) Therefore, we examined the distribution patterns of CCN2, TGF‐β, PTHrP, and PTH1R therein. Interestingly, CCN2 (Fig. 2A) and TGF‐β (Fig. 2B) were strongly expressed in cancer cells that had invaded the bone matrix (Figs. 2A–2C), and these CCN2‐expressing cells also expressed PTHrP (Figs. 2D–2F). PTHrP and PTH1R were co‐localized in cancer cells (Figs. 2G–2I), supporting the idea that PTHrP may act in an autocrine manner on cancer cells in regions of bone metastasis. These results also indicate that CCN2 expression may be regulated not only by TGF‐β but also by PTHrP in cancer cells in the bone microenvironment.
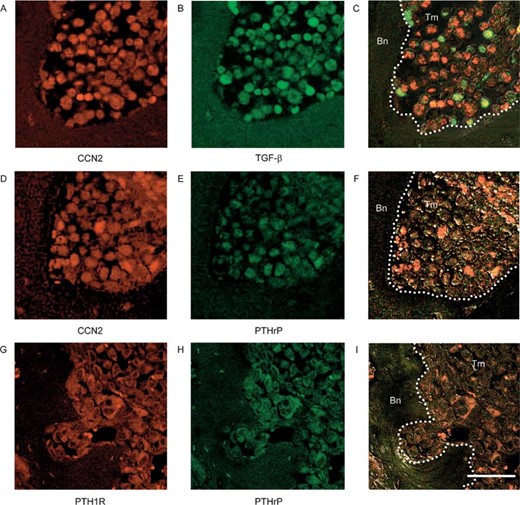
Localization patterns of CCN2, TGF‐β, PTHrP, and PTH1R in cancer cells involved in osteolytic bone metastasis. Hind limbs from mice bearing MDA231 tumors were isolated and analyzed by immunohistochemistry for the expression of (A and D) CCN2, (B) TGF‐β, (E and H) PTHrP, or (G) PTH1R. (C) A merged image of phase‐contrast microscopic views A and B. (F) A merged image of D and E with phase‐contrast microscopic view of the same fields. (I) A merged image of G and H with phase‐contrast microscopic view of the same field. Tm, tumor cells; Bn, bone. Scale bar, 50 μm.
Stimulation of ccn2 gene expression by PTHrP
Based on these findings, we turned to a study on cultured MDA231 cells to determine whether PTHrP regulates the expression of ccn2. Semiconfluent cultures were treated with increasing concentrations of PTHrP for different periods of time, and the resultant samples were processed for Northern blot analysis. As shown in Fig. 3A, PTHrP stimulated ccn2 gene expression in a dose‐dependent manner and was effective after both 4 and 8 h of treatment. A significant increase in ccn2 expression was found even at 1 nM PTHrP (Figs. 3A and 3B, lane 8), and the level became maximal at 100 nM PTHrP (Figs. 3A and 3B, lane 10), amounting to an increase to a level ∼2‐fold compared with the control (Figs. 3A and 3B, lanes 8–10).
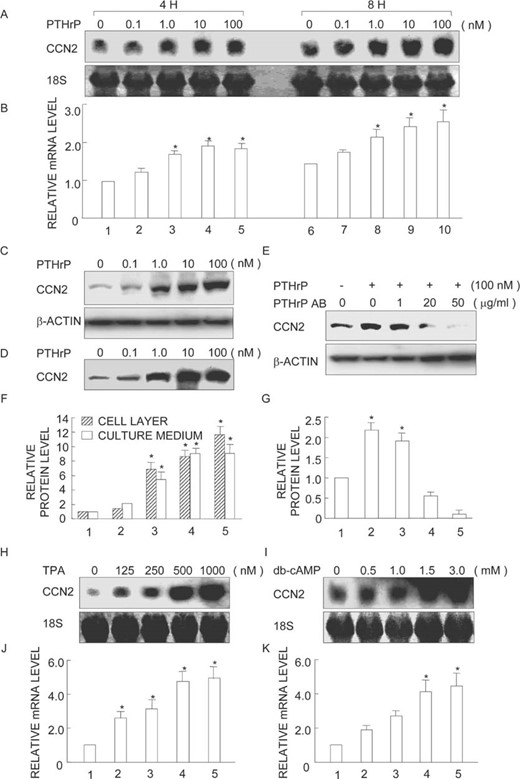
ccn2 gene and protein expression is stimulated by PTHrP or by activation of PKC or PKA. MDA231 cells were treated with the indicated doses of (A) PTHrP for 4 or 8 h, (H) TPA for 8 h, or (I) dibutyryl‐cAMP (db‐cAMP) for 8 h. Total RNA was extracted and analyzed by Northern blotting with a probe for ccn2. Similar cultures were treated with indicated doses of PTHrP in the (C and D) absence or (E) presence of PTHrP neutralizing antibody (PTHrP AB) for 24 h and processed for immunoblot analysis of (C and E) cellular and (D) culture media levels of CCN2 and β‐actin. A representative autoradiogram is displayed. (B, F, G, J, and K) Quantitative analysis by computer‐assisted densitometry. The results obtained from three independent blots represented in arbitrary units were averaged and are displayed. SDs are indicated by vertical error bars. *Statistically significant differences (p < 0.01) relative to controls (vehicle).
Immunoblots with cell lysates (Fig. 3C) and culture media (Fig. 3D) show that the increases in ccn2 mRNA levels during PTHrP treatment were paralleled by increases in CCN2 protein levels, whereas a housekeeping protein β‐actin remained constant (Fig. 3C). To verify the specificity of PTHrP action, MDA231 cells were treated with 100 nM PTHrP for 24 h in the absence or presence of different concentrations of PTHrP neutralizing antibody (1, 20, or 50 μg/ml). PTHrP boosted CCN2 expression over control values as expected (Figs. 3E and 3G, lane 1–2), whereas increasing amounts of the neutralizing antibody progressively reversed PTHrP action, and 50 μg/ml of antibody completely blocked it (Figs. 3E and 3G, lane 5).
PKC and PKA involvement in ccn2 gene regulation by PTHrP
To identify possible signaling pathways involved in the stimulation of ccn2 expression by PTHrP, we determined whether activation of PKC or PKA would mimic the effect of PTHrP on ccn2 expression. Semiconfluent cultures of MDA231 were treated with increasing concentrations of TPA, which activates PKC, or db‐cAMP, which activates PKA. Both treatments resulted in stimulation of ccn2 expression (Figs. 3H and 3I, lanes 2–5). The effect of TPA stimulation was maximal at 1000 nM, which gave rise to a value 5‐fold as high as the control (Figs. 3H and 3J, lane 5). Stimulation by db‐cAMP was also effective, yielding maximal effects at 1.5 mM (Figs. 3I and 3K, lane 4).
To confirm whether PKC and/or PKA actually mediated the effects of PTHrP on ccn2 expression or not, we treated MDA231 cells with 100 nM PTHrP for 8 h in the absence or presence of increasing concentration of GF109203X (a widely used inhibitor of PKC) or H89 (a widely used inhibitor of PKA). Treatment with GF109203X suppressed the PTHrP stimulation of ccn2 expression at 20 μM (Figs. 4A and 4B, lane 6). H89 also significantly counteracted the PTHrP stimulation of ccn2 expression at both 10 and 20 μM concentrations (Figs. 4A and 4B, lanes 10 and 12).
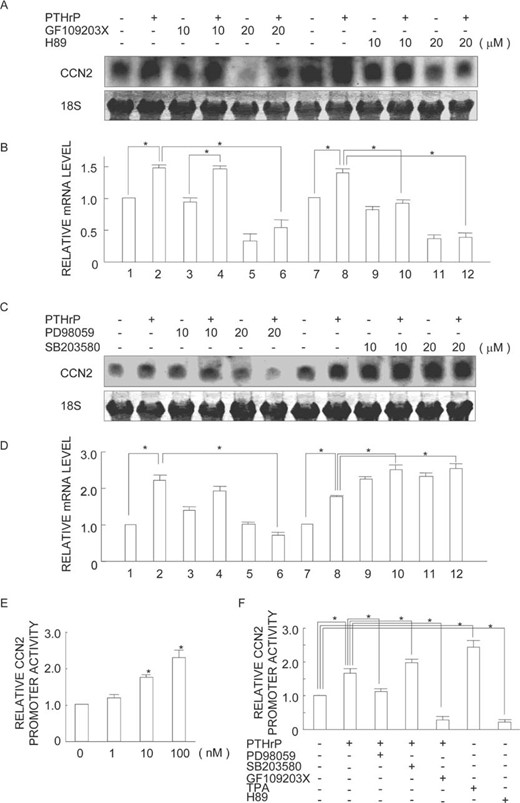
Differential modulation of ccn2 gene expression and promoter activity by PKC, PKA, and MAPK inhibitors. (A–D) MDA231 cells were preincubated with (A) GF109203X, (A) H89, (C) PD98059, or (C) SB203580 for 30 minutes and incubated with 100 nM PTHrP for 8 h. Total RNA was analyzed by Northern blotting (A and C) and band densities were quantified (B and D). A representative result from three individual experiments is shown in A and C. The relative ccn2 mRNA levels normalized by the 18 S rRNA level are displayed with error bars indicating SD. *p < 0.01, significant difference as indicated by the brackets. (E and F) MDA231 cells were transiently transfected with a ccn2 promoter‐reporter construct for the evaluation of promoter activity. (E) The cells were serum starved (24 h) and treated with increasing concentrations of PTHrP. (F) Cells were preincubated with PD98059, SB203580, GF109203X, TPA, or H89 for 30 minutes and incubated or not with 100 nM PTHrP. After 24 h of incubation, firefly luciferase activity was measured. Values are shown as n‐fold values relative to Renilla luciferase activity (internal control). Mean values of the results of three experiments are displayed with error bars of SD. *p < 0.05, significantly different from control or as indicated by the brackets.
Role of ERK mitogen‐activated protein kinase and p38 MAPK in the PTHrP‐stimulated ccn2 expression
Next, we examined the possible roles of mitogen‐activated protein kinase (MAPK) in ccn2 induction by PTHrP. MDA231 cells were exposed to 100 nM PTHrP for 8 h in the absence or presence of increasing concentrations of PD98059 (a widely used inhibitor of MAPK/ERK kinase [MEK]1/2) or SB203580 (a widely used inhibitor of p38 kinase). Interestingly, treatment with PD98059 completely neutralized the PTHrP stimulation of ccn2 expression at 20 μM (Figs. 4C and 4D, lane 6). In contrast, increasing amounts of SB203580 progressively increased the basal level of ccn2 expression (Figs. 4C and 4D, lanes 9–12).
Effect of PTHrP on transcriptional activity of ccn2 proximal promoter
Because Northern blot analysis suggested that PTHrP upregulation of ccn2 expression was dependent on the PKC‐ERK MAPK pathway, a ccn2 promoter reporter construct was used to analyze the regulatory mechanism of ccn2 induction by PTHrP and the role of the MAPK pathway in it. Effects at the transcriptional level were examined using a pTS589 (from −802 to +22) luciferase reporter plasmid that contained a 820‐bp ccn2 proximal promoter segment. PTHrP concentrations from 1 to 100 nM significantly increased the ccn2 promoter activity, with 100 nM having the maximal effect (Fig. 4E). H89 and GF109203X pretreatment drastically decreased PTHrP stimulated ccn2 promoter activity (Fig. 4F). PD98059 suppressed the PTHrP effects, whereas TPA increased ccn2 promoter activity (Fig. 4F).
Effect of PTHrP on the activation of ERK1/2 MAPK pathway
Using immunoblot analysis with antibodies against the active, phosphorylated form of ERK1/2 MAPK, we found that PTHrP treatment resulted in a time‐dependent increase in ERK1/2 MAPK phosphorylation (Fig. 5A, lanes 2–6). The phosphorylation started to increase as early as 1 minute after addition of 100 nM PTHrP (Fig. 5A, lane 2), and the level became maximal at 30 minutes (2.4‐fold over control, Fig. 5A, lane 6). Total levels of ERK1/2 MAPK remained constant during the 30‐minute period, as revealed by reprobing the same membranes with antibodies against ERK1/2 MAPK (Fig. 5A, lanes 1–6). Subsequently, to confirm whether PTHrP activated ERK1/2 MAPK in a MEK‐dependent fashion, we pretreated cells for 30 minutes with 20 μM PD98059, a specific inhibitor of MEK1/2, and co‐incubated them with 100 nM PTHrP for various time periods. As expected, PD98059 treatment blocked PTHrP‐stimulated ERK1/2 phosphorylation dramatically (Fig. 5B, lanes 2–6). Total ERK1/2 MAPK levels remained constant at all time‐points (Fig. 5B, lanes 1–6). To assess possible upstream mediators of ERK1/2 MAPK activation by PTHrP, we next first pretreated cells with 10 μM PKA inhibitor H89 or PI3K inhibitor wortmannin for 30 minutes and treated them with 100 nM PTHrP for various lengths of time. Neither of these inhibitors was able to block the stimulation of ERK1/2 phosphorylation by PTHrP (data not shown). In contrast, ERK1/2 MAPK activation by PTHrP was blocked by treatment with GF109203X, an established PKC inhibitor (Fig. 5C, lanes 2–6). To substantiate the conclusion, we treated cells with TPA, a PKC activator, and conducted a similar analysis. Indeed, TPA caused a progressive and substantial increase in ERK1/2 MAPK phosphorylation starting at 5 minutes of treatment (Fig. 5D, lanes 4–6).
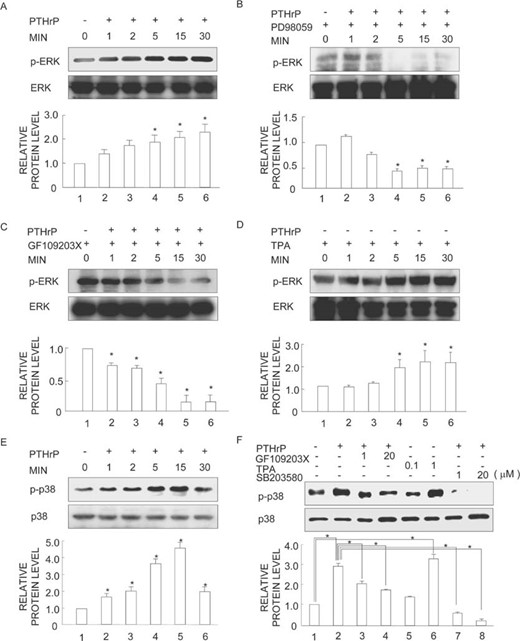
Effects of PD98059, GF109203X, and TPA on PTHrP‐simulated ERK1/2 and p38 MAPK activity. (A and E) MDA231 cells were transferred to serum‐free medium overnight and incubated with 100 nM PTHrP for various time periods. (B–D) MDA231 cells were transferred to serum‐free medium overnight and preincubated with (B) 20 μM PD98059, (C) 20 μM GF109203 X, or (D) 1 μM TPA for 30 minutes and incubated with 100 nM PTHrP or not for various time periods. (F) Cells were preincubated with SB203580, GF109203 X, or TPA for 30 minutes and were further incubated with 100 nM PTHrP or not for 30 minutes. After stimulation, the cells were analyzed for p‐ERK1/2, ERK1/2, p‐p38, or p38 by Western blotting. Bar graphs show the averages of quantified data from three independent experiments with error bars (SD). *p < 0.01, significantly different from the control or as indicated by the brackets.
Effect of PTHrP on the activation of p38 MAPK pathway
We also analyzed the involvement of p38 MAPK in PTHrP action. MDA231 cells were treated with 100 nM PTHrP alone or together with p38 inhibitor SB203580. Interestingly, PTHrP treatment resulted in a time‐dependent increase in the level of phosphorylated p38 MAPK as revealed on the immunoblots (Fig. 5E, lanes 2–6), whereas overall p38 levels were unchanged (Fig. 5E, lanes 1–6). The enhanced phosphorylation of p38 was neutralized beyond the control level by SB203580 (Fig. 5F, lanes 7–8). To examine the relationship between the phosphorylation of p38 MAPK and PKC, we treated cultures with TPA or GF109203X and performed a similar evaluation. As a result, p38 MAPK activation by PTHrP was blocked by GF109203X (Fig. 5F, lanes 3–4), whereas TPA caused a progressive increase in p38 MAPK phosphorylation (Fig. 5F, lanes 5–6).
Effect of the anti‐CCN2 antibody on MDA231 extraskeletal xenograft model
Next, to assess if the effect of the anti‐CCN2 Ab is specific to osteolytic bone metastatic events, we further examined the effect of the same Ab on the growth of a subcutaneous MDA231 tumor. The mice were divided into three treatment groups (n = 4/group), and the cells were implanted on day 0. Anti‐CCN2 Ab and control IgG were administered at a dose of 100 μg/mouse twice per week throughout the experiment, whereas tumor size was monitored at 7, 10, 14, and 21 days after cell implantation. As seen in Fig. 6A, treatment with the anti‐CCN2 Ab resulted in a significant reduction of tumor growth from day 14 compared with control IgG (p < 0.05). Remarkable difference was observed in day 21 tumor weight as shown in Fig. 6B. These results confirm the activity of the anti‐CCN2 Ab as an anti‐angiogenic agent in the subcutaneous MDA231 tumor model, suggesting that the observed effect against anti‐osteolytic metastasis can be partially ascribed to its anti‐angiogenic effect.
![Effect of CCN2 downregulation on angiogenesis and osteoclastogenesis. (A) Effect of neutralizing CCN2 Ab on a MDA231 xenograft model in vivo. BALB/c nu/nu mice were inoculated subcutaneously in the right hip area with 8 × 10⁶ MDA231 cells. Mice were treated intraperitoneally with the neutralizing CCN2 Ab or control IgG twice a week. Tumor diameter was measured with a caliper and the tumor volume (cubic mm) was calculated. A significant tumor growth suppression is shown from 14 days after the beginning of treatment (Mann‐Whitney's U‐test, p < 0.05). (B) Wet weight of tumors formed by subcutaneous MDA231 treated with neutralizing CCN2 Ab or control IgG (day 21 after inoculation). (C and D) Effect of neutralizing CCN2 Ab on [3H] thymidine incorporation of (C) HUVEC or (D) MDA231 cells. (E and F) Effect of neutralizing CCN2 Ab on migration of (E) HUVEC or (F) MDA231 cells. (G) ccn2 gene expression in stromal ST2 cells and spleen cells. ST2 and spleen cells were treated with or without 1 ng/ml TGF‐β for 6 h. Total RNA was extracted and analyzed by RT‐PCR. (H) effect of CCN2 antisense S‐oligodeoxynucleotide on the osteoclastogenesis of total bone marrow cells and co‐culture of spleen and ST2 cells induced by 1,25(OH)2 vitamin D3. *p < 0.05 and **p < 0.01, significant difference as indicated by the brackets.](https://oup.silverchair-cdn.com/oup/backfile/Content_public/Journal/jbmr/21/7/10.1359_jbmr.060416/1/m_5650210708-fig006.jpeg?Expires=1716369277&Signature=CSMj9iN0938Fa0Fo3eZMmoFZ8iHb2S9e4aPG5O0Wk2FY-zDbnwBi7IDykYTNSmF98NrM-lbQOUIji1lkE5DNhiRoUcBUobzfORmHj~JLPa4jdNHzdG5qCYXh7ZZS0h0YaNtd90QogEYkcV88mkwj2uFpt2v8z4j3QMTyyr2TzoSwaBy2uayMRXpXdgAD4hZG6kco9UTI9keUQ3cyTEOr9upUf6yWqPJKcl2N~kiBebEgTUAOUMHifYtPoriPsYUbfMhvWdkj2mr~OXh1QveUYVH6PltMzGUgdncUnwph4Vw3mEUqShd2ivESW8-ANN~IQTJmgij~J1mEcGTYOBbMWg__&Key-Pair-Id=APKAIE5G5CRDK6RD3PGA)
Effect of CCN2 downregulation on angiogenesis and osteoclastogenesis. (A) Effect of neutralizing CCN2 Ab on a MDA231 xenograft model in vivo. BALB/c nu/nu mice were inoculated subcutaneously in the right hip area with 8 × 10⁶ MDA231 cells. Mice were treated intraperitoneally with the neutralizing CCN2 Ab or control IgG twice a week. Tumor diameter was measured with a caliper and the tumor volume (cubic mm) was calculated. A significant tumor growth suppression is shown from 14 days after the beginning of treatment (Mann‐Whitney's U‐test, p < 0.05). (B) Wet weight of tumors formed by subcutaneous MDA231 treated with neutralizing CCN2 Ab or control IgG (day 21 after inoculation). (C and D) Effect of neutralizing CCN2 Ab on [3H] thymidine incorporation of (C) HUVEC or (D) MDA231 cells. (E and F) Effect of neutralizing CCN2 Ab on migration of (E) HUVEC or (F) MDA231 cells. (G) ccn2 gene expression in stromal ST2 cells and spleen cells. ST2 and spleen cells were treated with or without 1 ng/ml TGF‐β for 6 h. Total RNA was extracted and analyzed by RT‐PCR. (H) effect of CCN2 antisense S‐oligodeoxynucleotide on the osteoclastogenesis of total bone marrow cells and co‐culture of spleen and ST2 cells induced by 1,25(OH)2 vitamin D3. *p < 0.05 and **p < 0.01, significant difference as indicated by the brackets.
Effect of the anti‐CCN2 antibody on HUVEC and MDA231 proliferation and migration
To further confirm the anti‐angiogenic effect of the anti‐CCN2 Ab in vitro, we used HUVECs that highly produce and use CCN2 in an autocrine manner.(15) The 1 and 10 μg/ml anti‐CCN2 Ab slightly inhibited the serum‐induced [3H] thymidine incorporation of HUVEC cells (Fig. 6C), whereas the anti‐CCN2 Ab did not affect the MDA231 proliferation (Fig. 6D). Moreover, the 10 and 30 μg/ml anti‐CCN2 Ab remarkably inhibited the serum‐induced migration of HUVEC cells (Fig. 6E), whereas the anti‐CCN2 Ab did not with MDA231 cells (Fig. 6F). These significant, but not drastic, effects of the anti‐CCN2 Ab support the idea that its anti‐bone metastatic effect is partially caused by the anti‐angiogenic effect, and another mechanism should be involved therein as well.
Role of CCN2 on osteoclastogenesis
Because the anti‐CCN2 Ab reduced the number of osteoclasts, as well as endothelial cells in the osteolytic bone metastasis area (Fig. 1H), we studied the role of CCN2 on osteoclastogenesis. Two in vitro osteoclastogenesis systems comprising mixtures of stromal or osteoblastic cells together with osteoclast precursors from bone marrow were used for evaluation.(46) First, we examined the ccn2 gene expression in stromal cells and osteoclast precursor cells by RT‐PCR. The ccn2 gene was highly expressed in bone marrow–derived ST2 cells but not in spleen cells (Fig. 6G). TGF‐β, which stimulates CCN2 production by stromal cells, is stored in bone matrix(47) and released locally in active form during osteoclastic resorption.(9,48) In fact, we also confirmed that ccn2 gene expression was upregulated by TGF‐β in ST2 cells and spleen cells (Fig. 6G). Next we determined the role of CCN2 on osteoclastogenesis by a loss of function analysis. Knocking‐down the ccn2 gene expression by an CCN2 antisense S‐oligodeoxynucleotide dramatically inhibited the 1,25(OH)2 vitamin D3–induced TRACP+ osteoclast‐like cell formation in a dose‐dependent fashion, whereas CCN2 sense S‐oligodeoxynucleotide did not (Fig. 6H). We further confirmed the effect of CCN2 antisense S‐oligodeoxynucleotide on osteoclast formation from co‐culturing spleen cells with ST2 stromal cells. ST2 is known to support osteoclast formation from mouse spleen cells in the presence of 1,25(OH)2 vitamin D3 and dexamethasone.(49) When the co‐culture was treated with CCN2 antisense S‐oligodeoxynucleotide in the presence of 1,25(OH)2 vitamin D3, osteoclast formation was significantly repressed, compared with that from the CCN2 sense S‐oligodeoxynucleotide–treated cells (Fig. 6H).
DISCUSSION
The importance of CCN2 in angiogenesis by breast cancer cells was first revealed by our previous in vitro and in vivo studies(18,41,50) and was recently reaffirmed by the analysis of selected human breast cancer cell line subpopulations with elevated metastatic activity, which showed increased ccn2 expression.(19) In this study, treatment with an anti‐CCN2 monoclonal antibody in our model of breast cancer–mediated osteolysis resulted in marked inhibition of the development of new osteolytic lesions, in a reduction in the amount of microvasculature that invaded the cancerous tissues, and in a decreased number of osteoclast per millimeter of tumor/bone interface. Such effects indicate that CCN2 is a critical mediator of metastatic bone destruction in this microenvironment. We also found a marked decrease in the tumor area in mice treated with anti‐CCN2 Ab, which is consistent with the notion that tumor growth is positively correlated with the rate of bone resorption. Therefore, our data clearly indicate that CCN2 can be a promising target for combating metastatic breast cancers.
One of the possible explanations for the observed effects is that the neutralizing antibodies against CCN2 had a direct effect on tumor growth; however, this assumption is unlikely, because anti‐CCN2 Ab inhibited proliferation and migration of HUVEC but not MDA231 cells (Figs. 6C–6F) in vitro. The most likely hypothesis is that the antibodies neutralized the biological activity of CCN2, thereby preventing the angiogenesis and bone resorption to release growth factors from bone, which might enhance growth of the tumor cells locally, which is supported by the data in Fig. 6. In yielding the anti‐metastatic effects, the anti‐CCN2 Ab may have acted not only against tumor‐produced human CCN2, but also against host CCN2. Although the antibody was raised against human CCN2,(36) it is possible that the anti‐CCN2 Ab may recognize and neutralize the murine ortholog with ∼90% homology at the amino acid level. If so, from a clinical point of view, the obtained results may even better represent the situation that would occur in clinical cases, because any therapeutic anti‐CCN2 does react with human CCN2 either from normal tissue or autologous tumor cells.
There is growing evidence of a link between angiogenesis and bone turnover. First, circulating endothelial cell precursors are known to be derived from the monocyte cell lineage leading to osteoclasts. Second, endothelial cells express phenotypic markers similar to those of osteoclasts, such as the calcitonin receptor.(51) Recent studies have also shown that anti‐angiogenic factors may inhibit osteoclast function and tumor osteolysis.(52) Importantly, CCN2 antisense S‐oligodeoxynucleotide inhibited the induction of osteoclast formation in both mouse bone marrow cells and a co‐culture system that consisted of mouse spleen and ST2 cells (Fig. 6H), indicating a role of CCN2 in osteolysis. Stromal/osteoblastic cells are essential for in vitro osteoclastogenesis through a cell‐to‐cell interaction. These cells highly produce CCN2, and the secreted CCN2 regulates osteoblast development and function.(53–56) Our results showing that the ccn2 gene is highly expressed in ST2 cells and is upregulated by TGF‐β stored in bone matrix(48) are consistent with these findings (Fig. 6G). CCN2 binds to integrin αvβ3 on vascular endothelial cells,(57) and stromal cells and osteoclasts progenitors also express this same integrin. Integrin αvβ3 is important for the proliferation of osteoclast precursor cells in an adherent environment to form multinuclear cells.(58,59) Therefore, it is hypothesized that CCN2 contributed by stromal/osteoblastic cells may support osteoclastogenesis by binding to integrin αvβ3. This very important question deserves further attention.
The data in this study provide evidence that ccn2 expression in MDA231 cells is upregulated by PTHrP signaling in contrast with the effect on ccn3.(60) PTHrP is now well recognized as an important factor in the development of osteolytic bone marrow metastasis induced by breast cancer. Neutralizing antibodies to PTHrP not only decreased osteoclastic bone resorption but also inhibited the development of metastases in bone by MDA231.(23) In the light of these findings, we also confirmed that PTHrP and PTH1R were strongly expressed in the breast cancer cells that had invaded bone. The presence of the PTH1R in metastatic breast cancer cells clearly indicates that these cells could respond to PTHrP in a paracrine or autocrine manner. As such, PTHrP and PTH1R expression may provide metastatic breast cancer cells a selective advantage that allows them to colonize and expand in secondary sites through autocrine signaling. Indeed, PTH1R expression occurs more frequently at high levels in bone marrow metastasis than in the primary cancer and soft tissue metastasis lesions.(61,62)
Alternatively, tumor cells may upregulate PTH1R expression as a result of their exposure to the bone microenvironment. Such an action may be realized by growth factors present in bone marrow, which stimulate the production of endogenous PTHrP by cancer cells. Our hypothesis is supported by the fact that TGF‐β is stored in the bone matrix(47) released locally in active form during osteoclastic resorption(48) and stimulates PTHrP production by tumor cells. These published data establish that TGF‐β in bone can promote osteolysis by increasing PTHrP secretion from metastatic breast cancer cells.(45) At the same time, TGF‐β released from bone causes a further increase in the expression of the TGF‐responsive gene, ccn2, which establishes a composite positive feedback vicious circle of metastasis.(19) Interestingly, ccn2 expression was specifically observed in PTH1R+ cancer cells that had invaded the bone marrow. Therefore, the observed osteolytic property may include an autocrine action to yield increased ccn2 expression in response to PTHrP in addition to the matricrine cycle mediated by TGF‐β (Fig. 7).
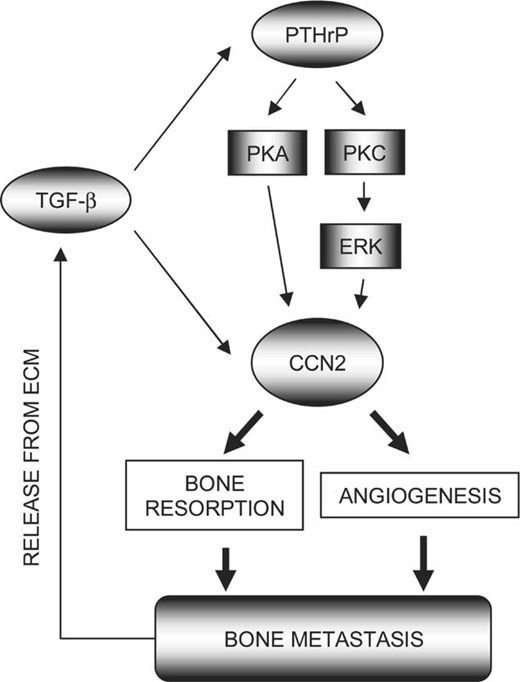
A schema for the roles and regulation of CCN2 in osteolytic metastasis. As a result of bone resorption, TGF‐β is released from extracellular matrix (ECM) and stimulates PTHrP and CCN2 production by tumor cells. CCN2 gene expression is further increased through the autocrine action of PTHrP, which is mediated by PKA and PKC‐dependent activation of an ERK1/2 pathway. Finally, abundantly produced CCN2 stimulate further angiogenesis and osteolysis, maintaining the vicious circle mediated by the three pathways. Such a cycle would potentiate the osteolytic potential of tumors once established in bone.
Next, to gain further insight into the molecular mechanism of PTHrP action on ccn2 in MDA231 cells, we examined whether PTHrP activated certain MAPK signaling pathways. Our results showed that PTHrP induced activation of ERK MAPK in a time‐dependent fashion through MEK in MDA231 cells. Furthermore, PTHrP‐induced ccn2 expression in MDA231 cells occurred in an ERK MAPK‐dependent manner. This is the first report describing a role for PTHrP in stimulating ccn2 expression through an ERK MAPK‐dependent pathway. Also, these results are consistent with previous studies, which showed that PTHrP stimulated ERK MAPK activation in osteogenic cells,(63) CHO‐R15 cells,(32) osteosarcoma cells, and calvarial osteoblasts.(33)
We subsequently studied upstream activators of the MAPK in MDA231 cells. According to previous studies that examined PTHrP signaling, two major signal transduction systems were shown to be involved.(64) One is a Gαs‐mediated increase in cAMP, leading to activation of PKA. The other is Gq‐mediated activation of phospholipase Cβ, leading to increased levels of intracellular inositol triphosphate and diacylglycerol and activation of PKC. Linkage of GPCRs to the MAPK signaling pathway through PI3K has been shown in COS‐7 cells overexpressing PI3K,(65) and linkage through PKC has been shown in osteosarcoma cells.(33) In this study, we examined three possible pathways that might stimulate the ccn2 expression through PI3K, PKA, and PKC. In our hands, wortmannin, an inhibitor of the PI3K pathway, could not block the MAPK activity stimulated by PTHrP (data not shown). Also H89, an inhibitor of the PKA pathway, failed to block the MAPK activity stimulated by PTHrP (data not shown). We did show, however, that GF109203X, a well‐known PKC inhibitor, blocked PTHrP‐induced ERK1/2 MAPK activation in MDA231 cells. Furthermore, TPA, a PKC activator, was able to activate ERK1/2 MAPK in MDA231 cells. These results suggest that activation of PKC is required for the MEK‐dependent ERK1/2 MAPK activation by PTHrP.
Our studies provide an insight into the mechanism by which PTHrP induces ccn2 mRNA in MDA231 cells. A pathway involving PKC and ERK1/2 MAPK was required for the PTHrP‐induced ccn2 expression in MDA231 cells, because the expression could be blocked by either GF109203X or PD98059. Of note, both PKA and PKC have been reported to regulate the p38 MAPK pathway as well, and the effects seems to be highly cell type specific.(66,67) In this study, we showed that PKC pathway signals also stimulated p38 MAPK activity in MDA231 cells. Therefore, p38 MAPK may be another downstream signaling molecule in PKC‐regulated ccn2 expression in MDA231. It is of interest that the PTHrP‐p38 MAPK pathway rather repressed the basal ccn2 expression level. A possible biological significance of this phenomenon may be that the balanced activation of ERK and p38 MAPK by PTHrP may be required for the optional induction of ccn2 to yield a profound consequence of tumor growth and survival in regions of bone metastasis. Our data taken together suggest that the net stimulation of ccn2 expression ought to be the result of the ERK‐mediated strong induction that overcomes the p38‐mediated basal attenuation in those breast cancer cells. It should also be noted that p38 MAPK mediates the TGF‐β–stimulated PTHrP production in MDA231 cells.(45) Thus, in the co‐presence of TGF‐β, even p38 MAPK can be considered to be an indirect mediator of ccn2 induction. In addition, it is also clear that PKA contributed to ccn2 induction, albeit independently of the MAPK pathway examined. A possible downstream mediator of the PKA signal is suggested below.
Finally, to determine the target of the MAPK‐transduced PTHrP signal in ccn2, we examined the effects of PTHrP on the ccn2 proximal promoter in the absence or presence of the kinase inhibitors. The results of the ccn2 promoter assay suggest that this regulation was effected at the transcriptional level. Moreover, blockade of ERK1/2, PKC, and PKA partially decreased the basal and PTHrP‐induced activity of the ccn2 promoter. These data indicate that ERK1/2‐PKC and PKA pathways may play a role in the regulation of ccn2 promoter activity. At present, it is difficult to define completely the mechanisms of the regulation in PTHrP‐induced activation of the ccn2 promoter. One possibility is the involvement of the transcription factor activator protein 1 (AP‐1), as the components in AP‐1 complex serve as substrates for MAPK, and an AP‐1 binding site exists in the promoter region of the ccn2 gene. Additionally, a few studies found that MAPK regulation by PKA requires members of the Src family.(68) Because tyrosine kinase Src family members are downstream of PKA signaling cascade, they might play a role in the cross‐talk between MAPK and PKA pathways in the induction of ccn2 transcription by PTHrP in MDA231 cells.
In conclusion, this study is, to the best of our knowledge, the first one to show that CCN2 should be considered a target for treatment of osteolytic bone metastases. Our experiments revealed that metastatic breast cancer cells in the bone microenvironment secreted PTHrP, which stimulated ccn2 through PKA, PKC, and ERK1/2 MAPK pathways to induce angiogenesis and further osteolysis. This vicious circle is now believed to result in the bone destruction and morbidity associated with breast cancer. Investigation of the molecular mechanisms responsible for osteolytic metastasis is crucial for our goal of finding effective therapy for osteolytic metastasis of cancer.
Acknowledgements
This work was supported in part by grants from the Uehara Memorial Foundation, the Okayama Health Foundation, the Ryobi‐teien Memorial Foundation, the Okayama Medical Foundation, and the programs Grants‐in‐Aid for Young Scientists (B) (to TS), Scientific Research (B and C) (to AS), and (S) (to MT) from the Ministry of Education, Culture, Sports, Science and Technology.
REFERENCES
Author notes
The authors state that they have no conflicts of interest.
