


Abstract
Several studies have established the active form of vitamin D 3 as an effective tumor-suppressing agent; however, its antitumor activity is achieved at doses that are hypercalcemic in vivo . Therefore, less calcemic vitamin D 3 analog, 1α-hydroxy-24-ethyl-cholecalciferol (1α[OH]D5), was evaluated for its potential use in breast cancer chemoprevention. Previously, 1α(OH)D5 showed anticarcinogenic activity in several in vivo and in vitro models. However, its effects on growth of normal tissue were not known. The present study was conducted to determine the effects of 1α(OH)D5 on the growth of normal mouse mammary gland and normal-like human breast epithelial MCF-12F cells and to compare these effects with carcinogen-transformed MCF-12F and breast cancer cells. No significant difference was observed in the growth or morphology of cultured mouse mammary gland and MCF-12F cells in the presence of 1α(OH)D5. However, the transformed MCF-12F cells underwent growth inhibition (40–60%, P < 0.05) upon 1α(OH)D5 treatment as determined by cell viability assays. Cell cycle analysis showed marked increase (50%) in G-1 phase for cells treated with 1α(OH)D5 compared with the controls. Moreover, the percentage of cells in the synthesis (S) phase of cell cycle was decreased by 70% in transformed MCF-12F, BT-474 and MCF-7 cells. The growth arrest was preceded by an increase in expression of cell cycle regulatory proteins p21 Waf-1 and p27 Kip-1 . In addition, differential expression studies of parent and transformed MCF-12F cell lines using microarrays showed that prohibitin mRNA was increased 4-fold in the transformed cells. These results indicate that the growth inhibitory effect of 1α(OH)D5 was achieved in both carcinogen-transformed MCF-12F and breast cancer cells at a dose that was non-inhibitory in normal-like breast epithelial cells.
Introduction
Cancer is a multistage process that involves transformation of normal tissue to malignant phenotype. Breast cancer is the second leading cause of cancer-related deaths among women in the USA. Since breast cancer results in considerable morbidity and patient care cost, chemopreventive strategies for breast cancer management are being extensively studied. Chemoprevention implies intake of one or several compounds, either natural or synthetic, to block or delay the onset or progression of cancer ( 1 , 2 ). Ideally, a chemopreventive agent should promote cell differentiation and selective growth inhibition of potentially malignant cells. Several epidemiological studies have supported the negative association of breast, prostate and colon cancer mortality rates with annual sunlight exposure and serum vitamin D 3 levels in different geographical areas ( 3 – 5 ). Based on these observations, the chemopreventive potential of vitamin D 3 has been explored in various in vivo as well as in vitro models.
Vitamin D 3 is a seco-steroid, which is classified as a fat-soluble vitamin. Its dietary intake is not crucial as it can be synthesized in the skin with sunlight exposure. It has to undergo two hydroxylation steps to attain biological activity. The active form of vitamin D 3 , 1α,25(OH) 2 D 3 or calcitriol, has two major biological functions: (i) regulation of calcium and phosphorus homeostasis and metabolism and (ii) induction of cell differentiation and growth modulation ( 6 ). Calcitriol exerts its biological activity through both genomic and non-genomic pathways; the genomic pathway involves signaling through a high affinity nuclear receptor (vitamin D 3 receptor or VDR). Calcitriol is now well recognized as an effective growth suppressing and differentiating agent for leukemia, melanoma, breast, colon and prostate cancer cells in vitro ( 7 , 8 ). However, the antiproliferative effects of 1α,25(OH) 2 D 3 are achieved at concentrations that are hypercalcemic and toxic in vivo . Consequently, much attention has been paid to developing less calcemic and safer analogs of 1α,25(OH) 2 D 3 (referred to as deltanoids) that would have desirable growth modulatory effects. Over 2000 different deltanoids have been synthesized so far, with most containing structural changes in the C or D ring, or the side chain of vitamin D 3 molecule. These deltanoids are designed to be selective VDR agonists. Out of the nearly 2000 synthetic deltanoids, only a few have shown potential for use in chemoprevention or therapy of breast cancer.
An analog of 1α,25(OH) 2 D 3 , 1α-hydroxy-24-ethyl-cholecalciferol (1α(OH)D5), has been evaluated for the past few years for its potential use in breast cancer chemoprevention ( 9 , 10 ). It has been shown to be one of the least toxic of all the vitamin D series of compounds tested ( 11 ). Previous studies have shown that 1α(OH)D5 at 1 μM concentration inhibited development of carcinogen-induced precancerous lesions in mouse mammary gland organ culture ( 9 ). In rodent models, 1α(OH)D5 supplemented diet reduced the incidence and multiplicity of mammary tumors. Furthermore, 1α(OH)D5 supplied in the diet increased the latency period for N-methyl-N-nitrosourea (MNU)-induced mammary carcinogenesis in rats ( 12 ). Specifically, the effect of 1α(OH)D5 in dimethylbenz(a)anthracene (DMBA)-induced rat mammary carcinogenesis model was selective during the promotion phase of carcinogenesis ( 10 ). In addition, in a xenograft mouse model, 1α(OH)D5 inhibited the growth of VDR-positive BT-474 cancer breast cells ( 13 ).
Although previous studies have established the growth inhibitory action of 1α(OH)D5 on cancer tissue both in vivo and in vitro , no data on its effect on growth of normal or normal-like breast epithelial cells were available. Therefore, the present study aimed to compare the growth effects of 1α(OH)D5 on normal, transformed and cancer breast epithelial cells. Additionally, this study examines the effect of 1α(OH)D5 on the expression of various markers of cell proliferation and cell cycle regulation.
Materials and methods
Vitamin D 3 analog, 1α(OH)D5
1α(OH)D5 was synthesized according to the procedure described previously ( 9 ). The stock solution of 10 mM in ethanol was stored at −80°C. 1α(OH)D5 was diluted in ethanol to a concentration of 1 mM for working solution. The proportion of ethanol was <0.01% of the total cell culture media. The appropriate controls for each experiment consisted of treatment with the vehicle ethanol. All reagents were purchased from Sigma-Aldrich (St Louis, MO).
Mouse mammary gland organ culture
In order to determine the growth effects of 1α(OH)D5 on normal mammary glands, Balb/c mice were killed to obtain mammary glands according to the protocol described previously ( 9 ). Briefly, mammary glands from 4-week-old female virgin Balb/c mice were divided into six groups with 15 glands per group: control, 1α,25(OH) 2 D 3 (0.1 μM), and 1α(OH)D5-treated (1 μM) for alveolar growth; control, 1α,25(OH) 2 D 3 (0.1 μM), and 1α(OH)D5-treated (1 μM) for ductal growth. The glands were cultured in the presence of aldosterone (1 μg/ml) and hydrocortisone (1 μg/ml) for the growth of alveolar structures, whereas progesterone (1 μg/ml) and 17β-estradiol (0.001 μg/ml) were used for inducing growth of ductal structures. The glands were treated for 6 days and then stained and compared for the morphological differences between the controls and the 1α(OH)D5-treated glands, with 1α,25(OH) 2 D 3 as a positive control. In an earlier report, 1α,25(OH) 2 D 3 exhibited maximum growth inhibition of lesion formation at 0.1 μM; whereas, 1α(OH)D5 was required at 1 μM concentration to get the maximum efficacy. At higher concentrations 1α,25(OH) 2 D 3 was toxic and 1α(OH)D5 did not have any additional suppression of the lesion development ( 9 ). Therefore, for the present studies, 0.1 μM and 1 μM of 1α,25(OH) 2 D 3 and 1α(OH)D5 were used, respectively. The histopathological sections were compared for ductal proliferation of glands.
Breast epithelial and cancer cell cultures
Normal-like MCF-12F cells, which are derived from reduction mammoplasty, were used in the present study. These cells were transformed with carcinogens to obtain the cell lines MCF-12F MNU and MCF-12F DMBA as described in the following section. The breast cancer cells used for the present study included MCF-7 and BT-474 (steroid receptor positive) and MDA-MB-231 and MDA-MB-435 (steroid receptor negative) cells. All the cell lines express VDR in varying proportions.
Human breast epithelial cells MCF-12F were purchased from American Type Culture Collection (ATCC, Rockville, MD) and maintained in Dulbecco's modified essential media with Ham's F-12 nutrient mix (DMEM/F12) containing 5% Chelex-treated horse serum. The tissue culture medium also contained epidermal growth factor (EGF, 10 μg/500 ml), cholera toxin (50 μg/500 ml), insulin (5 mg/500 ml) and hydrocortisone (250 μg/500 ml) along with antibiotic and antimycotic reagents. The transformed MCF-12F cells were cultured in similar media with the exception of horse serum—instead, the heat-inactivated fetal bovine serum (FBS) was used. The human breast cancer cells BT-474, MCF-7, MDA-MB-231 and MDA-MB-435 were purchased from ATCC and maintained according to the ATCC directions. All breast cancer cells were maintained in Minimum Essential Medium with Earle's salts (MEME) fortified with a mixture of non-essential amino acids and 5% FBS. For MCF-7 cells, insulin (2 μg/ml), sodium pyruvate (0.01 mM) and sodium bicarbonate (0.15%) were also added. All experiments on these cells were performed in the regular culture conditions and all cell culture chemicals were purchased from Invitrogen (Carlsbad, CA).
Carcinogen-induced transformation of MCF-12F cells
The spontaneously immortalized breast epithelial cells MCF-12F are useful in understanding the effects of chemopreventive agents in normal tissue, but do not provide insight into the effects on preneoplastic tissues ( 14 ). In order to compare the growth effects of 1α(OH)D5 on transformed cells with that on normal-like MCF-12F cells, the MCF-12F cells were transformed using two different mammary specific carcinogens. Once the two transformed MCF-12F DMBA and MCF-12F MNU cell lines were established, their growth characteristics were compared with MCF-12F cells using phase contrast microscopy for morphological examination, Boyden Chamber assay for invasive potential and cell growth studies for the rate of proliferation.
Carcinogen treatment was used for the transformation of MCF-12F cells as described previously ( 15 ). The two mammary specific carcinogens, DMBA and MNU were used. The MCF-12F cells (passage 12) were grown to subconfluency in a cell culture dish and the cells were incubated with DMBA dissolved in DMSO (2 μg/ml) for 24 h followed by another 24 h incubation with fresh DMBA in the media. This resulted in extensive cell death. The surviving cells were washed with phosphate buffered saline (PBS) and allowed to grow in fresh media without DMBA until confluent. The cells were subcultured and then gradually serum starved and then brought back to 5% FBS. The remaining cells were allowed to grow in regular media and the cell line MCF-12F DMBA was established. For MNU-induced transformation, the carcinogen was dissolved in acidified saline (pH 5.3 with acetic acid) and used within 20 min of preparation. MCF-12F cells (passage 12) were exposed to MNU (2 μg/ml) twice daily for 2 days. The cell line MCF-12F MNU was similarly established.
Boyden chamber assay
Boyden Chamber Assay was used to determine the invasive potential of breast epithelial cells through a Matrigel ® coated membrane ( 16 ). The Boyden chambers (BioCoat Becton-Dickinson, BD Biosciences, Palo Alto, CA) consisted of a 12-well cell culture plate with Matrigel ® coated inserts that were made up of polycarbonate membrane (pore size 8 μm and surface diameter 6.5 mm). All MCF-12F cells were plated in the cell culture plate with Matrigel ® inserts and treated with 1α(OH)D5 or control. After 48 h of treatment, the incubation was terminated and the tops of the membranes were scraped to remove the plated cells. The membranes were then stained with Gills no.1 hematoxylin. The number of cells on the bottom of membranes was counted to determine the relative percentage of cells that invaded through the Matrigel ® inserts. Each experiment was conducted in triplicates and at least five fields were counted for each insert using 20× magnification. The results were reported as the percentage of control.
Cell growth studies
Cell growth studies were performed using cell count with Coulter Counter ® Cell and Particle Analyzer to determine the difference in the cell number between the treated and the control groups. In addition to the cell count, measurement of cell proliferation based upon the reduction of the tetrazolium salt 3,[4,5-dimethylthiazol-2-yl]-2,5-diphenyltetrazolium bromide (MTT, Sigma-Aldrich) was used to assess the cell viability ( 17 ). MTT assays were performed using 96-well culture plates; 16 wells per group were used and the data were reported as mean and SEM after adjustment for control.
Cell cycle analysis
To further understand the nature of growth inhibitory effects of 1α(OH)D5 on breast epithelial cells, cell cycle analysis was conducted using DNA content measurement via flow cytometry ( 18 ). Briefly, after trypsinization, the cell pellets were resuspended and fixed using ice-cold ethanol. The fixed cells were then resuspended in citrate buffer (containing 40 mM trisodium citrate and 250 mM sucrose) and incubated with propidium iodide stain and spermine tetrahydrochloride to stabilize the nuclei. The DNA content analysis was performed on a Beckman Coulter EPICS Elite Flow Cytometer (Beckman Coulter, Fullerton, CA) and cell cycle parameters based upon DNA content were calculated using the EXPO32 Flow Cytometry software (Beckman Coulter). The data were expressed as the percentage of cell population in G-1, S and G-2 phases of the cell cycle. Samples were analyzed in triplicates and data were expressed as mean and SEM.
Expression studies
To determine whether 1α(OH)D5 treatment affects the cell cycle-related protein expression, BT-474 cells were treated with 1α(OH)D5 or the control for various time points. Total soluble proteins and total RNA were extracted and subjected to western blot and RT–PCR analyses, respectively. For western blots, the primary antibodies were purchased from Neomarkers (Lab Vision, Fremont, CA). All expression studies were repeated at least twice and the data were reported as percentage increase or decrease relative to the respective controls after adjustment for the housekeeping gene β-actin. The protein and RT–PCR product bands were photographed using the Kodak 1D Image Analysis Software version 3.5 (Kodak Digital Science Imaging, Eastman Kodak Company, New Haven, CT) and analyzed to compare the model net intensity of each band.
Proteins were extracted from control and treated cells using a protein lysis buffer containing HEPES (pH 7.9, 20 mM), NaCl (400 mM), Nonidet P-40 (0.1%), Glycerol (10%), Na Vanadate (1 mM) and Na Fluoride (1 mM) along with a cocktail of protease inhibitors. The soluble proteins were stored at −20°C until separation by electrophoresis. The concentration of each sample was determined by using the Bio-Rad DC Protein Assay kit (Bio-Rad Laboratories, Hercules, CA) and 50 μg proteins were loaded in each well. Protein separation was performed using sodium dodecyl sulfate–polyacrylamide gel electrophoresis (SDS–PAGE) ( 19 ). The proteins were transferred to a nitrocellulose membrane (Fisher Scientific, Pittsburgh, PA). Towbin buffer with 20% methanol was used in an electro-blotting tank for the transfer of proteins from the gel onto the membrane. After the transfer was completed, the membrane was probed with primary antibody in 2% skim milk dissolved in tris-buffered saline with Tween-20 (TBST; 10 mM tris-HCl, 150 mM NaCl and 0.05% Tween-20) for 2 h at room temperature or overnight at 4°C. The membrane was washed and incubated with appropriate horseradish peroxidase-conjugated secondary antibody (Santa Cruz Biotechnology, Santa Cruz, CA) for 30–45 min followed by TBST rinses. Finally, the electro-chemiluminescent (ECL, Amersham Biosciences, Piscataway, NJ) reagent was used to visualize the proteins on the photographic film (Kodak X-Omat film, Fisher Scientific, Pittsburgh, PA).
For RT–PCR, total RNA was extracted using Clontech's Nucleospin RNA II kit (Clontech, BD Biosciences, Palo Alto, CA) according to the manufacturer's instructions. RT–PCR was performed with 0.5 μg of the total RNA from control and treated samples using the Superscript™ One-Step RT–PCR system with Platinum ® Taq (Invitrogen, Carlsbad, CA) according to the manufacturer's instructions. Gene-specific primers for p21 Waf-1 were 5′-TGAAGGCAGGGGGAAGGT-3′ and 5′-AGTATGTTACAGGAGCTGGA-3′ yielding a 762 bp fragment, while for p27 Kip-1 a 934 bp fragment was amplified using 5′-TAGAGCTCGGGCCGTGGCT-3′ and 5′-GTCCATTCCATGAAGTCAGCGATATG-3′ primers. The amplified product was kept refrigerated until run on an agarose (1%) gel containing ethidium bromide for UV visualization of DNA. In addition, RT–PCR was performed on RNA extracts from control and treated MCF-12F cell lines to determine the expression of prohibitin. The primers used for prohibitin amplification were 5′-ACCACGTAATGTGCCAGTCA-3′ and 5′-CCGCTTCTGTGAACTCCTTC-3′, yielding a 332 bp fragment.
Microarray analysis
Comparisons of the differential gene expression between the mRNA derived from control and treated MCF-12F and MCF-12F MNU cell extracts were performed by the Clontech, ( http://atlas.clontech.com/ ) using human 8K Atlas array. The RNA quality and integrity were evaluated by Clontech prior to the analyses. The samples were submitted without revealing the identity to the Clontech. In the first analysis, MCF-12F RNA extracts were compared with the MCF-12F MNU extracts. Whereas, the second analysis was a comparison of the control and 1α(OH)D5-treated MCF-12F MNU cell extracts. Each analysis was run in duplicates and the data were normalized using the global sum method with a coefficient of 1.35 (Clontech).
Data analysis
Cell growth data including cell count, MTT assay and cell cycle analysis were expressed as mean and SEM with P -values obtained via the student's t -test (two-way, Type I error α = 0.05) using Instat ® version 3.0 (GraphPad Software, San Diego, CA). All other data were expressed as the percentage of control. Microsoft ® Excel 2000 was used to graphically plot all data. Kodak 1D Image Analysis Software version 3.5 (Kodak Digital Science Imaging, Eastman Kodak Company, New Haven, CT) was used to determine the band density on western blot films for protein expression and on agarose gels for RT–PCR products. The band density data were standardized with the housekeeping gene β-actin. After being adjusted for appropriate controls, the data were plotted using XY scatter plot. The trend lines were generated using polynomial regression analysis (Prism ® version 2.01, GraphPad Software, San Diego, CA).
Results
Effects of 1α(OH)D5 on the growth and proliferation of normal mouse mammary glands and normal-like human breast epithelial (MCF-12F) cells.
In order to determine the effects of 1α(OH)D5 on the growth and morphology of normal mammary glands, normal mammary glands from female Balb-c mice were incubated with growth promoting hormones for 6 days in the presence or absence of 1α(OH)D5 (1 μM). There was no difference observed between the morphology of the control glands and the glands treated with 1α(OH)D5 ( Figure 1 ). Neither the alveolar nor the ductal growth was affected by the presence of 1 μM 1α(OH)D5 in the normal mammary gland culture.
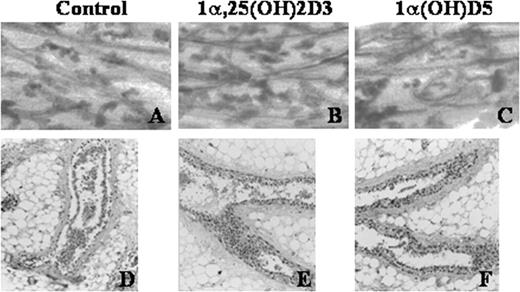
Mouse mammary glands from Balb/c mice were incubated with growth promoting hormones in serum-free medium for 6 days with or without 1α(OH)D5. ( A – C ), Whole mounts of the glands were stained with carmine and analyzed for alveolar growth. ( D – F ), Glands were fixed, paraffin embedded, and stained with hematoxylin and eosin to observe the ductal growth. ( A ) and ( D ), Control; ( B ) and ( E ) 1α,25(OH) 2 D 3 (0.1 μM); and ( C ) and ( F ) 1α(OH)D5 (1 μM).
Normal-like breast epithelial cells, MCF-12F, were treated with different doses of 1α(OH)D5 (0.1–5 μM) as well as with a non-toxic (0.1 μM) dose of 1α,25(OH) 2 D 3 . No significant growth inhibition was observed upon treatment with 1α(OH)D5 at doses of 0.1–1 μM ( Figure 2 ). However, at doses >5 μM, 1α(OH)D5 exhibited growth suppression of MCF-12F cells. This suggested that growth inhibition of normal breast epithelial cells requires higher 1α(OH)D5 dose than is necessary for the suppression of the DMBA-induced precancerous lesions (1 μM) in organ culture ( 9 ). Interestingly, there was a slight growth stimulatory (20–40% increase in cell number compared with control) effect during the first 3 days of treatment with 1α(OH)D5 and 1α,25(OH) 2 D 3 . These results suggest that 1α(OH)D5 and 1α,25(OH) 2 D 3 do not inhibit growth of normal-like MCF-12F cells and mammary glands in culture.
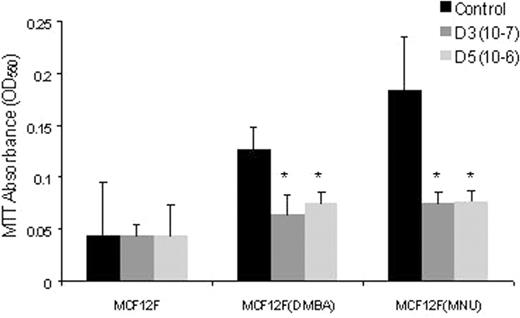
Effect of 1α(OH)D5 on the growth of MCF-12F, MCF-12F DMBA and MCF-12F MNU cells. The cells were tested for viability using MTT absorbance assay 3 days after 1α(OH)D5 (1 μM) treatment. *P -value <0.05. Mean (± SEM) were compared using two-tailed t -tests.
Transformation of MCF-12F cells
It has been previously established that the carcinogen-transformed mouse mammary glands respond to growth inhibitory action of 1α(OH)D5 ( 9 ). To determine whether 1α(OH)D5 would similarly inhibit the growth of carcinogen-transformed human breast epithelial cells, MCF-12F cells were transformed using the carcinogens DMBA and MNU. The resulting cell lines MCF-12F DMBA and MCF-12F MNU exhibited a 3-fold faster growth rate than the parent cells as determined by the cell count. The transformed cells showed rounded and raised morphology as compared with the more polygonal and flattened appearance of the parent MCF-12F cells under a phase contrast microscope (data not shown). The transformed cells lacked contact inhibition and grew in multiple layers. Unlike the normal cells, the transformed cells did not require presence of epidermal growth factor in media to proliferate. In short, the carcinogen-transformed cells showed growth characteristics different from that of the normal-like MCF-12F cell line.
In order to determine whether the transformed cells were truly different from the normal MCF-12F cells, the invasion properties of these cells were compared using the Boyden chamber assay. As shown in Figure 3 , the transformed (but not the parent) cells showed invasion through the Matrigel ® coated membrane in the Boyden chambers. MCF-12F DMBA showed less invasive potential compared with the MCF-12F MNU cells. The percentage of cells invading through the membrane was ∼14% for MCF-12F MNU and 12% for MCF-12F DMBA cells. Treatment with 1α(OH)D5 reduced (<2% cells invaded) the invasive potential of MCF-12F DMBA cells. On the other hand, it prevented the invasion of MCF-12F MNU cells through the membrane altogether ( Figure 3 ). Although, these results indicate transformation of the MCF-12F cells by the carcinogens, the transformed cells failed to form tumors in athymic mice (data not shown). Thus, we conclude that the transformed cells are probably precancerous but have not acquired the ability to induce tumors in nude mice.
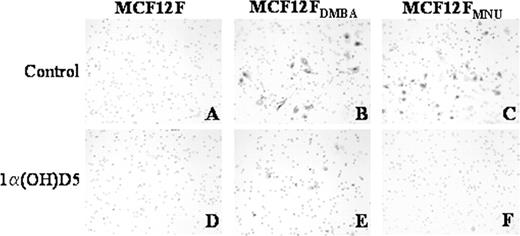
Comparison of the effect of 1α(OH)D5 (1 μM) on the invasive potential of MCF-12F, MCF-12F DMBA and MCF-12F MNU cells. Matrigel ® coated membrane in Boyden chambers were stained 48 h after 1α(OH)D5 treatment. ( A ) and ( D ), MCF-12F control and 1α(OH)D5; ( B ) and ( E ), MCF-12F DMBA control and 1α(OH)D5; ( C ) and ( F ), MCF-12F MNU control and 1α(OH)D5, respectively.
Effects of 1α(OH)D5 on the growth of normal and transformed MCF-12F cells
The normal-like MCF-12F cells did not show growth inhibition upon 1α(OH)D5 treatment at a dose of 1 μM. However, the growth of MCF-12F DMBA cells was inhibited significantly by 20% and MCF-12F MNU cells by 26% ( P < 0.05) upon 1α(OH)D5 treatment for 3 days as compared with the controls. Similarly, 1α,25(OH) 2 D 3 also inhibited the growth of transformed MCF-12F cells, while it had no growth inhibitory effect on the parent cell line at a dose of 0.01 μM. Since the cell count measures total cells adherent to the plate but does not take into account cells that are not viable, the growth inhibitory effects of 1α(OH)D5 were examined using the MTT assay ( Figure 2 ). The growth of MCF-12F DMBA cells was inhibited by 40%, while MCF-12F MNU cells by 60% ( P < 0.05) after 3 days of 1α(OH)D5 treatment. Both cell growth assays showed MCF-12F MNU cells to be more sensitive to treatment with 1α,25(OH) 2 D 3 and 1α(OH)D5 than the MCF-12F DMBA cells. Moreover, in both assays there was no growth inhibition observed in the normal-like MCF-12F cells.
Cell cycle analysis revealed no significant difference in any of the stages of the cell cycle between control and 1α(OH)D5-treated MCF-12F cells ( Table I ). On the other hand, 1α(OH)D5-treated MCF-12F DMBA cells showed 25% increase in the G-1 phase of the cell cycle as compared with the controls after 3 days of treatment. In addition, the S phase was decreased by 70% in the treated cells. Similarly, MCF-12F MNU cells showed an increase of 30% in G-1 phase upon treatment with 1α(OH)D5 and a 50% decrease in the S phase compared with controls. Taken together, these results suggest growth inhibitory action of 1α(OH)D5 on transformed MCF-12F, but not on normal-like MCF-12F cells.
Cell cycle analysis of normal and transformed MCF-12F cells
| Cell line | G-1 (%) | G-2 (%) | S (%) | G-1–G-2 |
|---|---|---|---|---|
| MCF-12F | ||||
| Control | 66.1 ± 2.1 | 24.6 ± 1.3 | 9.3 ± 1.2 | 2.7 |
| 1α(OH)D5 a | 65.1 ± 3.4 | 27.1 ± 2.0 | 7.8 ± 0.7 | 2.4 |
| MCF-12F DMBA | ||||
| Control | 56.2 ± 2.8 | 6.3 ± 0.9 | 37.5 ± 2.2 | 8.9 |
| 1α(OH)D5 a | 70.3 ± 2.5 * | 11.2 ± 1.6 | 10.5 ± 1.4 * | 6.3 |
| MCF-12F MNU | ||||
| Control | 57.1 ± 2.3 | 18.9 ± 1.1 | 24.0 ± 1.8 | 3.0 |
| 1α(OH)D5 a | 74.7 ± 1.9 * | 17.7 ± 2.3 | 11.6 ± 0.5 * | 4.2 |
Cells treated with 1α(OH)D5 for 3 days.
Significantly different from the control ( P < 0.05); mean (± SEM) were compared using two-tailed t -tests.
Since the transformed MCF-12F cells responded to 1α(OH)D5-mediated growth inhibition, differential gene expression analyses using Human Atlas 8K chip was obtained. Results showed that there were 369 genes differentially expressed between MCF-12F and MCF-12F MNU cells. Several cell cycle regulatory genes and genes related to extracellular matrix proteins were identified. Among the genes related to cell cycle regulation, TGFα, prohibitin and pituitary tumor transforming factor-1 were significantly upregulated; whereas, the Bcl2-like 1 gene and E2F-4 were downregulated. Treatment of MCF-12F MNU cells with 1α(OH)D5 (1 μM) resulted in the reversal of their expression ( Table II ). Prohibitin was selected as one of the potential target genes for further analysis. Not only does it interact with a variety of cell cycle regulatory proteins including E2F, pRb and p53 ( 20 ), prohibitin is a well conserved protein and the orthologs have been identified in plants, yeast and Drosophila. Results for prohibitin from microarray analyses were further confirmed by RT–PCR analysis. As shown in Figure 4 , MCF-12F MNU shows significant upregulation of prohibitin mRNA as compared with MCF-12F cells.
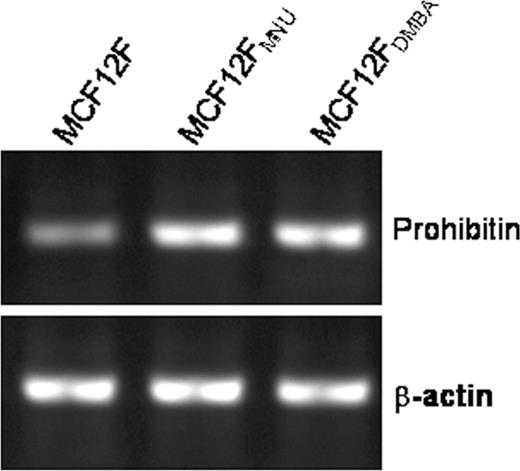
RT–PCR analysis of steady state levels of prohibitin mRNA in normal and transformed MCF-12F cells. Prohibitin expression was 2-fold higher in the transformed cells as compared with the parent MCF-12F cells.
Differential gene expression analyses using Atlas 8K array *
| Selected genes | Analysis 1 | Analysis 2 |
|---|---|---|
| MCF-12F MNU versus MCF-12F | MCF-12F MNU D5 versus MCF-12F MNU | |
| Prohibitin | 4.1 up | 2.4 down |
| Bcl2-like 1 | 2.8 down | 2.5 up |
| TCTP-1 | 17.8 down | 16.1 up |
| ODC Antizyme 1 | 2.1 down | 2.1 up |
| TIMP-1 | 3.1 down | 2.6 up |
| Glutathione Peroxidase | 2.7 down | 3.0 up |
| HSP27 | 2.7 up | 4.0 down |
| Rho GDP Dissociation inhibitor α ; | 6.5 down | 5.9 up |
| Systatin (Stefan B) | 3.4 down | 2.9 up |
The microarray analyses were commercially performed by Clontech, (Palo Alto, CA). Normalization of the data was carried out by using global sum method with a coefficient of 1.35. Any differential expression of <2-fold was considered as insignificant.
Effects of 1α(OH)D5 treatment on breast cancer cell growth
Since 1α(OH)D5 treatment elicited growth inhibition in transformed but not normal-like MCF-12F cells, commercially available breast cancer cell lines were used to further understand the growth inhibitory nature of 1α(OH)D5 action. Initially, cell growth was measured using the cell counter. It showed significant inhibition of BT-474 cell growth (50%, P < 0.05), while MCF-7 cells showed a modest inhibition (20%) after 72 h of 1α(OH)D5 treatment. This was further confirmed by the MTT assay. Results showed significant growth inhibition (50%, P < 0.05) in both estrogen-responsive BT-474 and MCF-7 cell lines after 3 days of treatment ( Figure 5 ). On the other hand, the estrogen-independent cell lines MDA-MB-231 and MDA-MB-435 did not show any growth inhibitory effects of 1α(OH)D5 treatment.
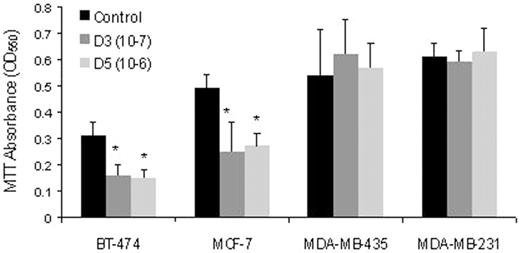
Effect of 1α(OH)D5 on the viability of various breast cancer cell lines after 3 days of treatment as determined by the MTT assay. Cells were incubated with 1 μM 1α(OH)D5 for 72 h in a 96-well plate; 16 wells per group were used. *P -value <0.05. Mean (±SEM) were compared using two-tailed t -tests.
Cell cycle analysis of the 1α(OH)D5-treated breast cancer cells showed results consistent with the cell growth studies ( Table III ). 1α(OH)D5-treated MDA-MB-231 and MDA-MB-435 cells did not show any significant change in the percentage of cells in different phases of cell cycle compared with the controls. Whereas, BT-474 cells showed 22% increase in cells in G-0/G-1 phase by Day 3 and 25% by Day 7 of treatment as compared with the control. Cells in the S phase, subsequently, was decreased by 71% on Day 3 and 62% on Day 7 of treatment as compared with their respective controls. Similarly, MCF-7 cells showed 22% increase in the percentage of cells in G-0/G-1 phase of the cell cycle and 45% decease in the S phase by Day 7, suggesting a gradual accumulation of the cells in G-1/G-0 phase. Thus, the treatment with 1α(OH)D5 resulted in an inhibitory action on the proliferation of hormone-responsive breast cancer cells, while no effect was observed on hormone-resistant breast cancer cells.
Cell cycle analysis of breast cancer cell lines
| Cell line | G-1 (%) | G-2 (%) | S (%) | G-1–G-2 |
|---|---|---|---|---|
| BT-474 | ||||
| Control | 65.3 ± 2.3 | 18.6 ± 1.1 | 16.1 ± 2.8 | 3.5 |
| 1α(OH)D5 a | 79.4 ± 2.1 * | 5.3 ± 0.6 * | 15.3 ± 2.3 | 15.0 |
| MCF-7 | ||||
| Control | 66.8 ± 2.3 | 11.4 ± 1.2 | 21.5 ± 0.8 | 5.9 |
| 1α(OH)D5 a | 78.1 ± 2.5 * | 8.4 ± 1.3 | 12.1 ± 0.3 * | 9.3 |
| MDA-MB-435 | ||||
| Control | 22.8 ± 1.4 | 45.9 ± 4.3 | 31.3 ± 1.8 | 0.5 |
| 1α(OH)D5 a | 21.1 ± 1.9 | 55.3 ± 3.6 | 23.6 ± 3.7 | 0.4 |
| MDA-MB-231 | ||||
| Control | 66.2 ± 3.1 | 10.1 ± 0.4 | 23.7 ± 3.2 | 6.6 |
| 1α(OH)D5 a | 65.5 ± 2.9 | 9.7 ± 0.9 | 24.9 ± 0.9 | 6.8 |
Cell lines treated with 1α(OH)D5 for 3 days.
Significantly different from the control ( P < 0.05); mean (±SEM) were compared using two-tailed t -tests.
Effects of 1α(OH)D5 treatment on expression of cell cycle-related proteins in breast cancer BT-474 cells
Studies with 1α(OH)D5 treatment of normal-like and breast cancer cells indicated a growth inhibitory action of 1α(OH)D5 on hormone-sensitive breast cancer cells as well as early stage transformed breast epithelial cells. Cell cycle analysis of responsive cell lines showed increased proportion of 1α(OH)D5-treated cells in the G-0/G-1 phase of the cell cycle indicating a possible effect of 1α(OH)D5 on genes that regulate the transition of cells from G-1 to S phase. Cyclins regulate the activity of their dependent kinases (CDK), while the inhibitors (CDKI), such as p21 Waf-1 and p27 Kip-1 , inhibit the activity of CDKs. In order to determine the effect of 1α(OH)D5 on the expression of these cell cycle regulatory proteins, RT–PCR and western blot analysis were conducted on control and treated BT-474 cells. BT-474 cells were chosen for expression studies owing to their established cancer status and their responsiveness to 1α(OH)D5 treatment.
The major checkpoints at G-1 to S transition in the cell cycle are CDKI, p21 Waf-1 and p27 Kip-1 . In order to determine whether 1α(OH)D5 treatment can result in modulation of the p21 Waf-1 transcription, control and 1α(OH)D5-treated BT-474 cells were sampled at intervals and total RNA was extracted and subjected to gene-specific RT–PCR. The results showed that in 24 h, p21 Waf-1 message was increased by 70% of the control ( Figure 6A and B ). Transcript levels of another CDKI p27 Kip-1 , were found to be increased by 60% in the 24 h following 1α(OH)D5 treatment in BT-474 cells ( Figure 7A and B ). This increase in p27 Kip-1 message was followed by a 2-fold increase in the expression of p27 Kip-1 protein as determined by the western blot analysis ( Figure 7C and D ). At the mRNA level, p21 Waf-1 levels were upregulated at the beginning of 8 h of 1α(OH)D5 treatment and reached a peak at 24 h. While the expression of p27 Kip-1 peaked at 24 h following 1α(OH)D5 treatment, the initial increases were observed at 16 h of treatment.
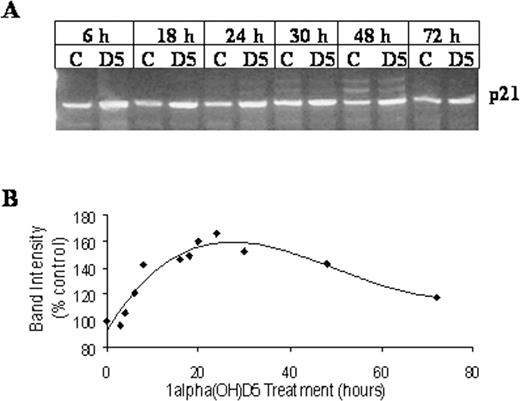
Effect of 1α(OH)D5 treatment on transcription of CDK inhibitor p21 Waf-1 in BT-474 cells. BT-474 cells were treated with 1 μM 1α(OH)D5 or control for various time points. Total RNA was extracted and subjected to RT–PCR. ( A ), RT–PCR showing levels of p21 Waf-1 mRNA from control and 1α(OH)D5-treated (1 μM) cells for each time point, respectively. ( B ), Change in levels of p21 Waf-1 transcript with 1α(OH)D5 treatment, adjusted for control and β-actin. The results are expressed as percent expression relative to appropriate controls. The graph was generated using polynomial regression.
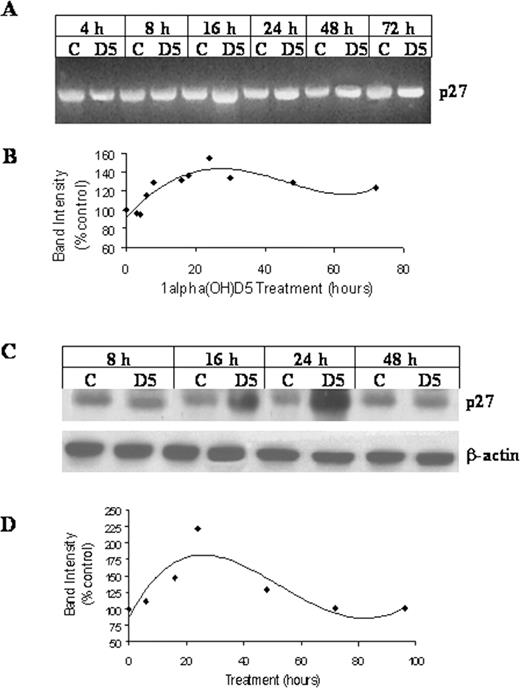
Effect of 1α(OH)D5 treatment on the levels of CDK inhibitor p27 Kip-1 in BT-474 cells. ( A ) and ( C ), RT–PCR and western blots showing levels of p27 Kip-1 from control and 1α(OH)D5 -treated cells (1 μM) for each time point, respectively. ( B ) and ( D ), Change in levels of p27 Kip-1 transcription and expression, respectively, adjusted for control and β-actin. The results are expressed as percent expression relative to appropriate controls. The graph was generated using polynomial regression.
Although the CDKIs p21 Waf-1 and p27 Kip-1 inhibit the activity of the CDKs, the cyclins enhance the activity of these kinases. The major CDKs and their corresponding cyclins for G-1 to S transition of cell cycle include cyclins A, D1 and E, with CDKs 2, 4 and 6. Expression of these cyclins and their dependent kinases was determined in BT-474 cells following 1α(OH)D5 treatment at different intervals using western blots. No significant changes were found in the expression of these G-1 associated cyclins and CDKs, with the exception of cyclin D1. Cyclin D1 expression started to decrease by 20% at 24 h of 1α(OH)D5 treatment, and by Day 3 it was reduced to 60% of the control ( Figure 8 ). Although 1α(OH)D5 treatment of BT-474 cells did not down regulate CDKs, it appears that their activity was modulated by 1α(OH)D5 treatment via upregulation of p21 Waf-1 and p27 Kip-1 .
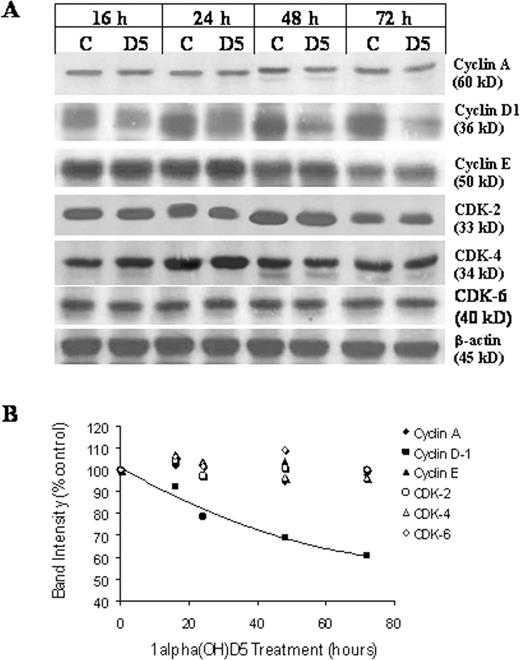
Western blots showing expression of cell cycle regulatory cyclins and CDKs in breast cancer BT-474 cells in response to 1 μM 1α(OH)D5 treatment ( A ). The results are expressed as percent control after adjusting for β-actin. The graph represents the band density data in an XY scatter plot ( B ).
Discussion
Previous studies have shown growth inhibitory effects of 1α(OH)D5 treatment both in vivo and in vitro ( 9 , 13 ). The in vivo data also indicated that 1α(OH)D5 was especially effective in reducing tumor growth when present during the promotion stage of the carcinogenesis ( 10 ). However, the effects of 1α(OH)D5 on the growth and morphology of normal mammary glands and cells were not known. Toxicity studies in animal models had shown low calcemic activity and relative safety of 1α(OH)D5 ( 13 ). To further understand whether 1α(OH)D5 would inhibit growth or alter morphology of normal breast epithelial cells, we treated cultured normal mouse mammary glands and normal-like human breast epithelial cells MCF-12F with 1α(OH)D5 at a dose that was found to be effective in preventing preneoplastic transformation of mouse mammary glands. The 1α(OH)D5-treated normal mouse mammary glands and MCF-12F cells had growth and morphology similar to the controls. 1α(OH)D5, at doses effective in suppressing cancer cell growth in vitro , did not suppress the growth of normal tissue or normal-like breast epithelial cells. Interestingly, at higher doses (≥5 μM) 1α(OH)D5 showed growth inhibitory effect in MCF-12F cells (data not shown). This suggests that a dose higher than the dose effective in human breast cancer cells would be required to inhibit growth of normal epithelial cells. This is consistent with data from other studies ( 8 ), where 1α,25(OH) 2 D 3 and its analogs, EB-1089 and CB-1093, in nanomolar concentration did not effect growth of VDR negative normal breast epithelial cells derived from VDR knockout (VDRKO) mouse. However, at micromolar concentration, signs of early apoptosis and growth arrest were observed. Some studies have also shown a slight growth stimulatory effect of 1α,25(OH) 2 D 3 and EB-1089 in human breast epithelial cells ( 21 ). We observed similar growth stimulatory effect of 1α(OH)D5 in MCF-12F cells in the first 3 days of treatment. However, this stimulatory growth effect on MCF-12F cells was diminished by Day 7 of treatment. In another study, lung cancer cells xenografted in VDRKO and wild-type mice ( 22 ) showed that lung cancer cell metastasis was reduced in VDRKO mice. VDRKO mice accumulate 1α,25(OH) 2 D 3 due to lack of VDR-mediated negative feedback regulation of 24-hydroxylase. The reduction in metastasis of lung cancer cell xenograft in VDRKO mice was attributed to the high levels of 1α,25(OH) 2 D 3 , which possibly affected pathways independent of VDR.
Transformation of breast cells occurs through a series of events leading to deregulation of signal transduction pathways, abnormal growth signals and aberrant expression of genes that ultimately transform the cells into invasive type. Use of chemical carcinogen is an effective method to transform normal cells in order to study and compare the effects of a potential chemopreventive agent on the growth of semi-transformed or transformed cells. In the present study, the carcinogen-induced transformation of MCF-12F using DMBA and MNU was performed with the same objective. As reported in the results, both MCF-12F DMBA and MCF-12F MNU cells showed growth characteristics different from the parent cell line. In addition to these differences, the transformed cells also showed growth inhibition with 1α(OH)D5 treatment at a dose of 1 μM. There was no growth inhibitory effect of 1α(OH)D5 on MCF-12F cell growth at that dose. These results are consistent with earlier reports indicating that 1α,25(OH) 2 D 3 and EB-1089 in nanomolar concentrations blocked mitogenic effects of fibroblast-conditioned medium on MCF-7 tumor cells but not on normal breast epithelial cells ( 23 ). One of the basic requirements for a chemopreventive agent is that it should not elicit adverse growth effects on normal tissues of the body at chemopreventive doses. Our results indicate that 1α(OH)D5 is a likely candidate in this respect. The significance of prohibitin in breast epithelial or cancer cells is not clear. It appears that prohibitin binds to VDR and enhances the responsiveness to vitamin D in VDR-positive breast cancer cells (unpublished).
Although 1α(OH)D5 induced growth inhibition in certain breast cancer cells, it did not affect all types of breast cancer cells. At a dose of 1 μM, 1α(OH)D5 showed significant growth inhibition of hormone-responsive BT-474 and MCF-7 cells. On the other hand, the estrogen-resistant cell lines MDA-MB-231 and MDA-MB-435 did not show any growth inhibitory effects of 1α(OH)D5 treatment. Hansen and colleagues ( 24 ) had shown that despite its inability to inhibit growth of MDA-MB-231 cells, 1α,25(OH) 2 D 3 reduced the invasive potential of MDA-MB-231 by 50% as determined by the Boyden Chamber assay. However, 1α(OH)D5 did not alter the invasive potential of MDA-MB-231 cells through the Matrigel ® coated membranes in Boyden chambers (unpublished data). Thus, the treatment with the optimal chemopreventive dose of 1α(OH)D5 resulted in an inhibitory action on proliferation of hormone-responsive breast cancer cells, while no effect was observed on hormone-resistant breast cancer cells. One explanation of the inability of 1α(OH)D5 to inhibit growth of hormone-resistant cell lines could be the levels of VDR present. BT-474 cells express high levels of VDR and MCF-7 express moderate levels, while MDA-MB-231 express low levels ( 25 ). VDR appears to be essential for the antiproliferative response of vitamin D 3 and its analogs in the mammary tissue. This is consistent with the previous study where estrogen receptor (ER)-negative but VDR-positive UISO-BCA-4 breast cancer cells responded to growth inhibition by 1α(OH)D5 ( 13 ). The understanding of the nature of growth inhibitory response of 1α(OH)D5 would serve to identify suitability for its clinical use in certain types and stages of breast cancer.
The growth inhibitory action of 1α(OH)D5 in the transformed and cancer breast cells was accompanied by accumulation of cells in G-0/G-1 phase of the cell cycle. The increase in the percentage of cells in G-1 phase is indicative of cell cycle arrest that might lead to either differentiation or cell death. Several researchers have shown that 1α,25(OH) 2 D 3 and some of its analogs induce G-1 arrest in responsive breast cancer cells ( 26 – 28 ). The 1α(OH)D5-mediated growth arrest is preceded by modulation of several checkpoints in the cell cycle. Therefore, various cell cycle regulatory factors that are involved in G-1/S phase transition were studied to determine the effects of 1α(OH)D5 on these factors. In BT-474 breast cancer cells, the expression of p21 Waf-1 and p27 Kip-1 was upregulated within 24 h following 1α(OH)D5 treatment. These two CDKIs inhibit cell cycle progression from G-0–G-1 to S phase by downregulating cyclins A, D and E, which in turn, leads to reduced CDK-2, -4 and -6 activity. In cross-sectional studies, loss of p21 Waf-1 and p27 Kip-1 in breast and other cancer tissue samples has been reported ( 27 ) and expression of these two CDKIs has been used as a biomarker for cancer progression. Consistent with our data, other reports have also shown that 1α,25(OH) 2 D 3 and EB-1089 upregulated p21 Waf-1 expression in several breast cancer cell lines including MCF-7, T-47D, ZR-75-1 and BT-20 ( 26 , 29 ). One of the main targets for action of p21 Waf-1 and p27 Kip-1 is the reduction of cyclin D1 expression and/or activity. Our results have similarly indicated that cyclin D1 expression started to decrease within 24 h of 1α(OH)D5 treatment in BT-474 cells. Other G-1/S phase cyclins and their respective CDK levels were not affected by 1α(OH)D5 treatment. Reports by several researchers, however, suggest that the activities of CDKs 2 and 4, regardless of their levels, were significantly decreased upon treatment with 1α,25(OH) 2 D 3 and EB-1089 in MCF-7, T-47D, ZR-75-1 and BT-20 breast cancer cells along with a decrease in cyclins A and D1 levels ( 26 , 28 ). Treatment of BT-474 cells with 1α(OH)D5 showed similar effects on expression of various cell cycle-related genes as reported of vitamin D 3 and some of its analogs. This modulation of gene expression by 1α(OH)D5 was followed by growth arrest of BT-474 cells. A recent report showed that in laryngeal carcinoma cells the antiproliferative activity of 1α,25(OH) 2 D 3 was due specifically to induction of CDKI p21 Waf-1 , although both p21 Waf-1 and p27 Kip-1 were upregulated by 1α,25(OH) 2 D 3 treatment ( 30 ).
In conclusion, the growth inhibitory effect of 1α(OH)D5 was achieved in breast cancer cells at a dose that was found to be ineffective in normal-like breast epithelial cells. This selective action could be a result of potential antiestrogenic action of 1α(OH)D5 combined with altered expression of various potential target genes ( 31 ). Taken together, these data indicate that, in human breast epithelial tissues, 1α(OH)D5 is selective for its effects on precancerous or cancer cells, but shows no effect on normal breast epithelial cell growth. Moreover, the growth inhibitory effect is elicited by upregulation of cell cycle checkpoints that arrest the cells in G-0/G-1 phase, thereby reducing cancer cell proliferation. Such selective growth inhibition of cancer cells is a useful property for a successful chemopreventive agent in clinical settings.
The authors thank Michael E.Hawthorne for technical assistance with organ culture studies and Dr Genoveva Murillo for helpful discussions. The funding for this work was provided by the Department of Defense (DAMD17-01-1-0272) and the National Cancer Institute (CA R01-82361).
Conflict of Interest Statement : None declared.
References
Sporn,M.B. and Suh,N. (
Ainsleigh,H.G. (
Garland,F.C., Garland,C.F., Gorham,E.D. and Young,J.F. (
Lipkin,M. and Newmark,H.L. (
Hisatake,J., O'Kelly,J., Uskokovic,M.R., Tomoyasu,S. and Koeffler,H.P. (
Welsh,J., VanWeelden,K., Flanagan,L., Byrne,I., Nolan,E. and Narvaez,C.J. (
Mehta,R.G., Moriarty,R.M., Mehta,R.R., Penmasta,R., Lazzaro,G., Constantinou,A. and Guo,L. (
Mehta,R.G. (
Napoli,J.L., Fivizzani,M.A., Schnoes,H.K. and DeLuca,H.F. (
Mehta,R.R., Bratescu,L., Graves,J.M., Green,A. and Mehta,R.G. (
Weaver,V.M., Howlett,A.R., Langton-Webster,B., Petersen,O.W. and Bissell,M.J. (
Lazzaro,G., Mehta,R.R., Shilkaitis,A., Das Gupta,T.K. and Mehta,R.G. (
Giannini,S., Cresci,B., Pala,L., Ciucci,A., Manuelli,C., Fujita-Yamaguchi,Y., Cappugi,P. and Rotella,C.M. (
Muelas-Serrano,S., Nogal-Ruiz,J.J. and Gomez-Barrio,A. (
Vindelov,L.L., Christensen,I.J. and Nissen,N.I. (
Towbin,H., Staehelin,T. and Gordon,J. (
Wang,S., Fusaro,G., Padmanabhan,J. and Chellappan,S.P. (
Gache,C., Berthois,Y., Cvitkovic,E., Martin,P.M. and Saez,S. (
Nakagawa,K., Kawaura,A., Kato,S., Takeda,E. and Okano,T. (
Sundaram,S., Chaudhry,M., Reardon,D., Gupta,M. and Gewirtz,D.A. (
Hansen,C.M., Frandsen,T.L., Brunner,N. and Binderup,L. (
Buras,R.R., Schumaker,L.M., Davoodi,F., Brenner,R.V., Shabahang,M., Nauta,R.J. and Evans,S.R. (
Welsh,J., Wietzke,J.A., Zinser,G.M., Byrne,B., Smith,K. and Narvaez,C.J. (
Tsihlias,J., Kapusta,L. and Slingerland,J. (
Wu,G., Fan,R.S., Li,W., Ko,T.C. and Brattain,M.G. (
James,S.Y., Mercer,E., Brady,M., Binderup,L. and Colston,K.W. (
Hager,G., Kornfehl,J., Knerer,B., Weigel,G. and Formanek,M. (
Author notes
1Department of Surgical Oncology and 2Department of Human Nutrition, University of Illinois at Chicago, Chicago, IL 60612 and 3IIT Research Institute, Chicago, IL 60616, USA
