


Abstract
Butyrate, formed by bacterial fermentation of plant foods, has been suggested to reduce colon cancer risks by suppressing the proliferation of tumor cells. In addition, butyrate has been shown to induce glutathione S -transferases (GSTs) in tumor cell lines, which may contribute to the detoxification of dietary carcinogens. We hypothesize that butyrate also affects biotransformation in non-transformed colon cells. Thus, we have investigated the gene expression of drug metabolism genes in primary human colon tissue, premalignant LT97 adenoma and HT29 tumor cells cultured in an appropriate medium±butyrate. A total of 96 drug metabolism genes (including 12 GSTs) spotted on cDNA macroarrays (Superarray®; n = 3) were hybridized with biotin-labeled cDNA probes. To validate the expression detected with Superarray®, samples of LT97 cells were also analyzed with high density microarrays (Affymetrix® U133A), which include biotransformation genes that overlap with the set of genes represented on the Superarray®. Relative expression levels were compared across colon samples and for each colon sample±butyrate. Compared with fresh tissue, 13 genes were downregulated in primary cells cultivated ex vivo , whereas 8 genes were upregulated. Several genes were less expressed in LT97 (40 genes) or in HT29 (41 and 17 genes, grown for 72 and 48 h, respectively) compared with primary colon tissue. Butyrate induced GSTP1 , GSTM2 , and GSTA4 in HT29 as previously confirmed by other methods (northern blot/qPCR). We detected an upregulation of GSTs ( GSTA2 , GSTT2 ) that are known to be involved in the defence against oxidative stress in primary cells upon incubation with butyrate. The changes in expression detected in LT97 by Superarray® and Affymetrix® were similar, confirming the validity of the results. We conclude that low GST expression levels were favourably altered by butyrate. An induction of the toxicological defence system possibly contributes to reported chemopreventive properties of butyrate, a product of dietary fibre fermentation in the gut.
Introduction
The lifetime colorectal cancer risk in the general population is reported to be ∼5%, with individual risk increasing significantly with age ( 1 ). Although a small proportion of colorectal tumors are caused by inherited genetic alterations ( 2 ), the greatest numbers of tumors are sporadic and probably the result of a life-long accumulation of genetic alterations in somatic tissues ( 3 , 4 ). These may be caused by carcinogenic compounds derived from foods that are putative risk factors for colorectal cancer ( 5 , 6 ). Carcinogenic compounds ingested with food may pass directly into the gut lumen or may reach the colon indirectly through the bile and/or the enterohepatic circulation after being metabolically activated and conjugated in the liver ( 7 – 9 ). The extent of dietary exposure, the ability to prevent DNA damage by inactivating dietary carcinogens and the capacity to repair the damage caused by dietary carcinogens all contribute to an individual's risk of developing cancer. A favourable balance of biotransformation enzymes, which include various phase I enzymes ( 10 ), phase III transport systems ( 11 , 12 ), as well as phase II enzymes, such as glutathione (GSH) S -transferases ( 13 ), UDP-glucuronosyl transferases ( 14 , 15 ), might protect tumor target cells from accumulating additional mutations. This mechanism of action by xenobiotics has been defined as ‘blocking agent activity’ as opposed to ‘suppressing agent activity’, which targets altered cells by e.g. inhibiting their growth or inducing apoptosis ( 16 ). Both mechanisms contribute to the chemopreventive action of compounds ( 17 – 19 ).
Levels of biotransformation enzymes have been associated with genetic polymorphisms ( 20 ), as well as with environmental factors ( 21 ). The induction of selected phase II enzymes that exhibit mainly detoxifying activities is an important target in dietary chemoprevention ( 22 , 23 ). A family of enzymes that plays an important role in detoxification is glutathione S -transferases (GSTs; EC 2.5.1.18), which catalyze the conjugation of many electrophilic compounds with reduced GSH. Based on their biochemical, immunological and structural properties, the GSTs are characterized as cytosolic, mitochondrial and microsomal enzymes. The cytosolic transferases are represented by classes Alpha, Mu, Pi, Sigma, Theta, Zeta and Omega. The mitochondrial transferase is called class Kappa GST. The microsomal transferases form a unique MAPEG (membrane-associated proteins in eicosanoid and GSH metabolism) grouping of transferases ( 13 , 24 ).
In this context, we have been exploring the potential of physiologically available butyrate to modulate the expression levels of GSTs ( 25 ; T.Kautenburger, G.Beyer-Sehlmeyer, G.Festag, N.Haag, S.Kuechler, A.Kuechler, A.Weise, B.Marian, W.H.M.Peters, T.Liehr, U.Claussen, and B.L.Pool-Zobel, submitted for publication) and to confer resistance to human colon cells towards the exposure to colon cancer risk factors ( 26 , 27 ). Butyrate is a major product of dietary fibre fermentation by the gut microflora and evidence is accumulating that it may also be formed from other ingredients of plant foods, such as polyphenols ( 28 ). In HT29 cells, butyrate was an efficient inducer of GSTs, particularly GSTP1-1, GSTM2-2 and GSTA4-4 ( 25 – 29 ), whereas in colon adenoma cells butyrate reduced the expression of GSTT1-1 protein, probably by destabilizing the GSTT1 mRNA (T.Kautenburger et al ., submitted for publication). Additional GST genes may contribute to GSH conjugation within colon cells resulting in cellular protection ( 30 ).
In this study we (i) investigated whether GSTs and other biotransformation genes were expressed differently in human colon cells and (ii) determined differences in gene expression owing to butyrate. For this purpose we utilized two types of DNA arrays, both novel developments of functional genomics ( 31 ) and assessed the expression levels of 12 GSTs in colon epithelial tissue, primary human colon cells ( 32 ), premalignant human LT97 adenoma cells ( 33 ) and highly transformed HT29 tumor cells ( 34 ). All studied stages were considered to be relevant targets to study the dietary-related colon carcinogenesis, and particularly, HT29 cells have been used in many studies as a model for colon cancer cells. We aimed to enhance the knowledge of biotransformation capacities and the transcriptional regulation by butyrate. This type of nutrigenomics approach will help in expanding our understanding of the mechanisms that mediate the effects of chemopreventive diets in reducing the risk of colorectal cancer ( 35 , 36 ).
Materials and methods
Cell lines and culture condition
The human colon adenoma cell line LT97 was a kind gift from Professor Brigitte Marian (Institute for Cancer Research, University of Vienna, Austria) who established it from colon microadenomas of a patient with familial adenomatous polyposis ( 33 ). LT97 was maintained in a culture medium (MCDB 302) containing 20% of L15 Leibovitz medium, 2% FCS (fetal calf serum), 0.2 nM triiodo- l -thyronine, 1 µg/ml hydrocortisone (302 basic medium) supplemented with 10 µg/ml insulin, 2 µg/ml transferrin, 5 nM sodium selenite and 30 ng/ml EGF (epidermal growth factor). HT29 cells were isolated from a colon adenocarcinoma of a female Caucasian ( 34 ) and originated from an adenoma colon tissue. It was obtained from the American Tissue Culture Collection (ATCC), Rockville, MD, USA. The HT29 cells were maintained in Dulbecco's Modified Eagle Medium (DMEM) supplemented with 10% FCS and 1% penicillin/streptomycin ( 26 ). LT97 and HT29 cells were grown in T25 flasks and cultivated in a humidified incubator (5% CO 2 ; 95% humidity, at 37°C). Under these conditions, doubling time for LT97 was 72–96 h; and for HT29 cells, 24 h. Passages 29–32 and 29–46, respectively were used for the experiments.
Primary human colon tissue
Cells and RNA were isolated from patients who had given their informed consent after being admitted to hospital for surgery of colorectal tumors, diverticulitis and colon polyps ( 25 ). Mean age (±SD) of the six donors of tissue for direct RNA isolation was 58.5 ± 11.1 years; three of the donors were male and three were female. Mean age (±SD) of the three donors from which colon cells were first isolated before incubation and RNA isolation was 65.7 ± 20.2 years; one of the donors was male and two were female. The Ethical Committee of the Friedrich-Schiller-University of Jena approved the study. Non-tumor colon tissue was stored in HBSS (Hank's balanced salt solution; 8.0 g/l NaCl, 0.4 g/l KCl, 0.06 g/l Na 2 HPO 4 × 2 H 2 O, 0.06 g/l K 2 HPO 4 , 1 g/l glucose, 0.35 g/l NaHCO 3 and 4.8 g/l HEPES, pH 7.2), transported on ice to the laboratory within 1 h and worked up immediately. The human colon epithelium was separated from the tissue by a perfusion-supported mechanical disaggregation ( 32 ). Epithelial stripes were either conserved for RNA isolation or they were further incubated in vitro and treated with butyrate (see below).
Treatment with butyrate
Effects of butyrate on the growth properties of HT29 and LT97 cells and on the expression of GSTP1 , GSTM2 , GSTA4 and GSTT1 have been assessed in detail perviously ( 25 ). Based on these studies, each of the cell types was incubated and treated with the maximum butyrate concentration without affecting the viability and growth rates as had been described previously for LT97 and HT29 cells (T.Kautenburger et al ., submitted for publication; 26 ), or as had been established during this study for primary colon tissues/cells. Therefore, the cell-specific, subtoxic and optimal conditions varied in terms of time between plating and treatment, duration of treatment and concentration of butyrate. HT29 cells were plated and after allowing attachment for 24 and 48 h, subjected to treatment with 4 mM butyrate or plain medium. LT97 cells were plated and after allowing attachment for 72 h, treated with 1 and 2 mM butyrate or plain medium. Both cell lines were harvested after a further 24 h treatment. Primary human colon tissue pieces were cultured in petri dishes (35 mm) and after allowing to settle for 15 min, subjected to treatment with 10 mM butyrate or plain medium. After 12 h treatment, the cells were isolated from the epithelial stripes by mincing and were incubated in 3 ml HBSS (60 min, 37°C) supplemented with 6 mg proteinase K (Sigma; Steinheim, Germany) and 3 mg collagenase P (Boehringer; Mannheim, Germany). The suspensions of primary human colon cells were diluted with HBSS, centrifuged and resuspended in PBS (phosphate-buffered saline; 8 g/l NaCl, 1.44 g/l Na 2 HPO 4 , 0.2 g/l KCl and 0.2 g/l KH 2 PO 4 , pH 7.3). Viability and cell yields were determined with trypan blue.
RNA isolation
Total RNA was isolated from primary human colon cells, LT97 adenoma cells and HT29 tumors cells (up to 6 × 10 6 cells) using RNeasy Mini Kit (Qiagen, Hilden, Germany), dissolved in 30–70 µl RNase free water and stored at −20°C. RNA was also isolated from surgical tissue samples, which had been placed into RNA Later solution (Qiagen, Hilden, Germany) immediately after excision. The integrity of the ribosomal RNA and DNA contamination was checked routinely using formaldehyde denaturing RNA gel electrophoresis (1.2%) before proceeding with the further macro and micro array analysis. Protein or phenol contamination and concentration of the total RNA was assessed by determining the ratio A 260:280 spectrophotometrically (Eppendorf BioPhotometer, Hamburg, Germany).
Macro and micro array analysis
Superarray ®. Hybridization was performed on 112 sites (3 blanks, 3 negative reference spots, 10 household genes, and 96 human genes related to drug metabolism) on cDNA gene macroarrays (GEArray Q Series Human Drug Metabolism Gene Array HS11, SuperArray® Bioscience Corporation; Frederick, MD). Genes were classified into functional categories, representing phase I enzymes (cytochrome p450 family, epoxide hydroxylases), phase II enzymes (acetyltransferases, GST, sulfotransferases, and UDP-glucuronosyl transferases and miscellaneous others) and phase III enzymes (metallothioneins and p -glycoproteins). A detailed gene list is available on the company's website ( http://www.superarray.com/ ) and in the accessory file to this manuscript. [The studies were done with c-DNA macroarrays, containing sequences of 96 genes related to drug metabolism, the data for the 12 spotted genes belonging to the family of the glutathione S -transferases are presented here in more detail, since confirmatory studies are available. Data for the other genes of drug metabolism are available from the accessory data file ( http://www2.uni-jena.de/biologie/ieu/et/Dateien/Butyrate_gene.pdf ).] Six arrays were used to determine the interindividual variation levels for RNA isolated from six different donors. Three arrays each were used for RNA isolated from three independently reproduced experiments consisting of medium controls and butyrate-treated samples of primary colon cells, LT97 cells and HT29 cells. HT29 cells were investigated both at 24 h after plating and at 48 h after plating to determine differences owing to culture conditions. Work-up of the array was performed according to the manufacturer's protocol. Single-stranded cDNA was synthesized from total RNA (1–3 µg) in vitro by using M-MLV reverse transcriptase (Promega, USA). By applying a single-step ampo linear polymerase reaction (LPR) labelling technique, the cDNA was labelled with dUTP-biotin. The cDNA macroarray was hybridized overnight at 60°C with the biotin-labelled cDNA. The hybridized membrane was subjected to chemiluminesence analysis for quantification of the conjugation signals with streptavidin-linked alkaline phosphatase and CDPstar. The resulting signals were captured by CCD camera equipment (Fujifilm LAS-1000, Diana, USA) and analyzed with AIDA array analysis (Raytest GmbH, Germany) program to comprehensively evaluate the differential gene expression of the various samples. Raw data were normalized between 0 and 100% expression, where the signals of the means of the negative controls (areas without spotted gene sequences or with genes not expressed in human cells) equalled 0 and the means of the signals of the positive controls (household genes) were fixed to equal 100%. Thus, the data shown here represent the mean expression levels relative to negative and positive reference genes. Some genes may reach signals over those of the household genes and thus reach values >100%. Negative values are obtained for genes revealing signals below those of the six negative reference spots. Additionally, to enable other comparisons, the data were also normalized according to two other criteria (data not shown). One was to set the lowest signal to equal 0% and the other was to set the means of signals of all genes to equal 100% (global normalization). The values of ‘fold change’, obtained for all three normalization procedures, were used to identify differentially expressed genes and butyrate-regulated genes, respectively. This comparison revealed that the first approach was the most sensitive and (based on all confirmatory data) also the most predictive one.
Affymetrix ®. Hybridizations were done on Affymetrix U133A gene expression arrays containing probe sets recognizing >14 000 well-characterized human genes. A detailed list of genes is available on the Affymetrix website ( http://www.affymetrix.com ). Labelled probes for hybridization were prepared from total RNA obtained as described above from LT97 cells. To remove residual contamination with genomic DNA, total RNA samples were treated with DNAse I at 37°C for 30 min followed by repurification through RNeasy columns (Qiagen, Hilden, Germany). Labelling reactions were done following the suggested protocol for the preparation of fragmented biotinylated complementary RNA (cRNA). In short, with all variable points, 5 µg of total RNA, DNase I treated, was used for cDNA synthesis using the T7-promoter primer (Affymetrix). After a second strand synthesis, biotinylated cRNA was obtained by transcription from the double-stranded cDNA with T7-RNA-polymerase (Enzo). Biotinylated cRNA was fragmented by treatment with Mg 2+ directly before hybridization. Hybridization and scanning were done on an Affymetrix array processing station and scanner. Primary data obtained scanning the signals of the micro arrays (Affymetrix U133A) were analyzed using the Affymetrix MicroArraySuite analysis package. The resulting signal intensities for each gene and the change of P -values were used for comparative evaluation.
Northern blot analysis of GSTP1 expression
Ten micrograms of LT97 and HT29 RNA were loaded on a 1.5% denaturing agarose gel, separated for 3–4 h at 80 V and blotted on a positively charged nylon membrane (Roche Diagnostics, Mannheim, Germany). Preparation of digoxygenin-labelled RNA probes for GSTP1 and GAPDH was performed as described previously ( 26 ). Hybridization occurred overnight at 72°C in standard high SDS hybridization buffer (containing 100 ng/ml of GAPDH and 67 ng/ml of GSTP1 RNA probe). The signals were detected by incubating the membrane with anti-DIG alkaline phosphatase antibody (Roche Diagnostics, Mannheim, Germany), followed by CDP-Star substrate incubation. Afterwards, the blot was exposed for 10 min on X-ray film (Hyperfilm ECL, Amersham Biosciences, Freiburg, Germany) and photographed (Fluor-S® MultiImager, Bio-Rad, München, Germany). Evaluation of the band intensities proceeded with the Quantity One® 4.1 Software (Bio-Rad, München, Germany).
Real-time RT–PCR analysis of GSTT2 expression
Expression of GSTT2 mRNA was assessed by the two-step SYBR Green I quantitative real-time RT–PCR by iCycler iQ system (Bio-Rad GmbH München, Germany). Briefly, 3 µg of total RNA from the butyrate-treated samples (LT97 and HT29 cells) were converted into first-strand cDNA using Superscript II (Invitrogen) according to the manufacturer's conditions. The PCR amplification reactions contained 2 µl of first-strand cDNA mixed with 12.5 µl of iQ™ SYBR® Green Supermix (Bio-Rad GmbH München, Germany) master mixture (2× mix containing SYBR Green I, iTaq DNA polymerase, reaction buffer, deoxynucleotide triphosphate mix, 10 mM MgCl 2 , 20 nM fluorescein and stabilizers), 10 pmol stock of each of the specific primers ( GSTT2 ), glyceraldehyde-3-phosphate dehydrogenase ( GAPDH ) in a final reaction volume of 25 µl. All reactions were performed in triplicate. The PCR profile consisted of an initial denaturation of 5 min at 95°C, 40 cycles of 30 s at 95°C denaturing, 40 s at 63°C annealing, 45 s at 72°C extension and followed by a final extension step of 10 min at 72°C. Cumulative fluorescence was measured at the end of the extension phase of each cycle. Product-specific amplification was confirmed by melting curve analysis and agarose gel electrophoresis analysis. Gene-specific primer sequences used for the quantification were as follows: GAPDH , forward, 5′-CCACCCATGGCAAATTCCATGGC-3′ and reverse, 5′-AGTGGACTCCACGACGTACTCAG-3′; GSTT2 forward, 5′-TGACACTGGCTGATCTCATGGCC-3′ and reverse, 5′-GCCTCCTGGCATAGCTCAGCAC-3′; PCR primer for target and reference gene cloning GSTT2 forward, 5′-GGTGGAACGCAACAGGACTGCC-3′ and reverse, 5′-GCCTGATAGGCCTCTGGTGAGG-3′; and GAPDH forward, 5′-CCACCCATGGCAAATTCCATGGC-3′ and reverse, 5′-TAGACGGCAGGTCAGGTCCACC-3′. Primer nucleotides confirmation of the total gene specificity was performed using the BLASTN search programme.
Relative quantification of unknown GSTT2 mRNA gene expression was determined by using a series dilution of cDNA plasmid containing the inserted GSTT2 , GAPDH and constructing a calibration curve. Wells with no template were used as negative control.
Statistical analysis
Superarray ®. Comparisons were made for the directly excised tissue and for colon cells after cultivation in medium, which was a reflection of the baseline expression levels. Comparisons were also made for each of the three colon cells incubated with medium and with butyrate, which was a reflection of the modulated gene expression. Responses of drug metabolism genes spotted on the Superarray® membranes and Affymetrix® array were directly compared by using identical RNA aliquots of LT97 cells incubated in medium and with butyrate. Another comparison was made from a technical point of view, namely to compare the gene expression levels of HT29 cells, which were worked up 48 and 72 h after plating. Genes were clustered into functional entities and subjected to an analysis on a group basis, using the GraphPad® Prism software Version 4.0 (GraphPad® Software Inc., San Diego, USA). Values obtained after normalization were taken for an analyses of variance (ANOVA) test and Bonferroni's post-test was then used to identify genes that were statistically different between the groups. ANOVA calculations taken to compare biopsies and individual cell types were non-repeated measures, whereas ANOVA calculations, based on repeated measures, were used to determine the effects of butyrate. Additionally, unpaired t -tests (±Welch's correction for unequal variances) were used, as appropriate, to determine the differences of multiple genes on a group basis. All data were evaluated to establish the two-sided significance levels of independently reproduced determinations.
Affymetrix ®. Before comparison of the signal intensities across all data sets, data were normalized using a global normalization approach supervised by the rank intensity distribution of the normalized signal intensities ( 37 ). Changes in gene expression were then calculated as fold changes with respect to the untreated reference ( 38 ). In cases, in which one gene is represented by different groups of probes, results were summarized when all probe sets gave the same results. In cases of discrepancy, probe set located at the 3′ end of the coding sequence were preferentially considered. In cases where no decision could be made, results for all probe sets were included in the presentation of results. The most likely explanation for these differences is that alternative processed and transcribed mRNA originated from the respective genes.
Real-time PCR . Final results were expressed as an n -fold difference in the GSTT2 gene expression relative to the internal reference GAPDH and the calibrator. Statistical significance between control and treated cells was calculated by unpaired t -test and one-way ANOVA.
Results
Cellular parameters
Primary cells, isolated from colon tissue incubated in vitro (12 h), had a viability of 79 ± 13 and 76 ± 18% in the control medium and in the medium containing 10 mM butyrate, respectively. Confluence of LT97 cells before isolating RNA was ∼70–80 and ∼80–90% for medium control and for the butyrate-treated samples, respectively. Confluence of HT29 cells after 48 h attachment was 70–80 and 80–90%, and after 24 h attachment it was 60–70 and 70–80%, for medium controls and butyrate-treated samples, respectively. Viability of recovered HT29 and LT97 cells was always >95% for all experimental conditions.
Baseline expression levels
The baseline expression levels of the target genes were determined in freshly excised colon tissues from six individual donors. The data for the GST group of genes obtained for each donor are shown in Figure 1 . (The accessory data file shows baseline values for all genes related to drug metabolism.) To enable a better discrimination of the expressed genes, the left panel shows GSTs with low signals and the GSTs with higher relative expression levels are grouped in the right panel of the figure. There was a considerable variation the of expression with total signal strength, which may vary depending on the probe characteristics. Altogether, the signal strength ranged from 482 (donor 3) to 972 (donor 5), which was a 2-fold difference for the sum of all GSTs.
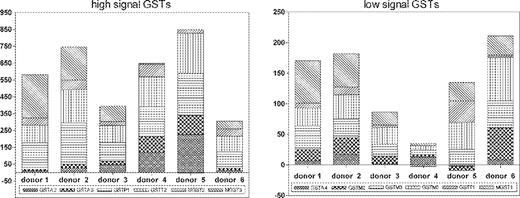
Individual levels of GST mRNA-expression in freshly excised primary colon tissues derived from six different donors. The 12 GSTs were divided into two groups, namely one with low expression levels and in another one with high expression levels. The mean values and individual variations for the individual GSTs are shown in Table I .
The mean expression levels ( n = 6 donors) of each individual gene were the basis for assaying differential expression across the human colon samples. For this comparative analysis, we took into account various parameters, namely, the absolute expression levels, the subtractive degree of change between groups, the fold change between groups and the reproducibility of the measurement. The cut-off values for the expression levels were chosen to be 10 [which was equal to the average variation (SEM) in the control genes from the colon tissue samples; n = 6]. The fold change to indicate upregulation was set at ≥2.0, which was previously found to be significant ( P < 0.05, n = 3) for butyrate-mediated changes of GST activity, GSTP1 mRNA and GSTP1-1 expression in HT29 cells ( 25 ). The fold change to indicate downregulation was set at ≤0.5, since this was previously found to be significant ( P < 0.001, n = 3) for the butyrate-mediated inhibition of GSTT1-1 protein expression in LT97 cells (T.Kautenburger, et al ., submitted for publication). These numbers were therefore not arbitrary, since they had been shown to reflect significant changes for GST mRNA, GST protein and GST enzyme activity.
Table I shows the relative baseline expression levels for all differentially expressed genes (including GSTs), which were spotted on the membrane (accessory data file). Most genes yielded signals of >10. There were no differences of GSTP1 and GSTT1 expression in primary tissues, compared with the colon cells. The other GSTs were differently expressed, albeit with different patterns. With respect to the evaluation criteria described above, a subset of GSTs were less expressed in LT97 and in HT29 (72 h) than in colon tissues. However, in primary cells and in HT29 cells (48 h after plating), there were several examples of genes expressed more in the cells than in biopsies ( Table I ).
Baseline expression levels of drug metabolizing enzymes in human colon cells compared with tissues
| Functional gene family | Number of expressed genes | Differentially expressed genes | Primary tissue * | Primary cells | LT97 adenoma cells | HT29 tumour cells | HT29 tumour cells | |||||||||||||||||
|---|---|---|---|---|---|---|---|---|---|---|---|---|---|---|---|---|---|---|---|---|---|---|---|---|
| 0 h a | 12 h a | 72 h a | 72 h a | 48 h a | ||||||||||||||||||||
| Means | SEM | Down | Up | Down | Up | Down | Up | Down | Up | |||||||||||||||
| Phase I | ||||||||||||||||||||||||
| p450 Family | 14/25 | CYP2B | 60.3 | 21.8 | CYP2B | CYP2B | CYP2B | CYP3A4 | ||||||||||||||||
| CYP2F1 | 33.7 | 7.8 | CYP2F1 | CYP2F1 | ||||||||||||||||||||
| CYP3A4 | 36.3 | 17.5 | CYP3A4 | CYP3A4 | ||||||||||||||||||||
| CYP4F3 | 154.5 | 32.7 | CYP4F3 | |||||||||||||||||||||
| Phase II | ||||||||||||||||||||||||
| Acetyltransferases | 10/10 | ACAT1 | 89.8 | 16.1 | CRAT | ACAT2 | ACAT1 | ACAT1 | CHAT | DLAT | ||||||||||||||
| ACAT2 | 331.5 | 63.3 | LOC51126 | ACAT2 | ACAT2 | NAT1 | HAT1 | |||||||||||||||||
| CHAT | 134.8 | 44.2 | CHAT | CHAT | HBOA | |||||||||||||||||||
| CRAT | 41.9 | 12.1 | CRAT | CRAT | LOC51126 | |||||||||||||||||||
| DLAT | 27.8 | 7.4 | DLAT | DLAT | ||||||||||||||||||||
| HAT1 | 17.6 | 6.6 | NAT1 | NAT1 | ||||||||||||||||||||
| HBOA | 3.2 | 4.7 | LOC51126 | LOC51126 | ||||||||||||||||||||
| MORF | 17.2 | 5.1 | ||||||||||||||||||||||
| NAT1 | 82.4 | 16.6 | ||||||||||||||||||||||
| LOC51126 | 48.2 | 12.9 | ||||||||||||||||||||||
| Glutathione S -transferases | 12/12 | GSTA2 | 73.7 | 34.4 | GSTA2 | GSTM2 | GSTA2 | GSTA2 | GSTA2 | GSTA4 | ||||||||||||||
| GSTA3 | 45.8 | 18.8 | GSTA3 | GSTM3 | GSTA3 | GSTA3 | GSTA3 | MGST1 | ||||||||||||||||
| GSTA4 | 7.4 | 2.9 | MGST1 | GSTM5 | GSTM3 | GSTM3 | GSTM3 | |||||||||||||||||
| GSTM2 | 17.9 | 8.4 | GSTM5 | GSTM5 | GSTM5 | |||||||||||||||||||
| GSTM3 | 27.5 | 5.5 | GSTT2 | GSTT2 | ||||||||||||||||||||
| GSTM5 | 36.7 | 8.6 | MGST2 | MGST2 | ||||||||||||||||||||
| GSTT2 | 152.2 | 25.1 | MGST3 | MGST3 | ||||||||||||||||||||
| MGST1 | 35.1 | 9.7 | ||||||||||||||||||||||
| MGST2 | 43.7 | 8.2 | ||||||||||||||||||||||
| MGST3 | 99.3 | 43.3 | ||||||||||||||||||||||
| Sulfotransferases | 15/21 | CHST5 | 37.8 | 18.1 | CHST5 | TPST1 | CHST6 | CHST6 | SULT1B1 | CHST5 | ||||||||||||||
| CHST7 | 72.1 | 45.8 | CHST7 | HNK-1ST | HNK-1ST | CHST7 | ||||||||||||||||||
| HNK-1ST | 56.4 | 7.9 | SULT1B1 | SULT1A1 | SULT1A1 | |||||||||||||||||||
| SULT1A1 | 31.8 | 11.9 | SULT1A2 | SULT1A2 | ||||||||||||||||||||
| SULT1A2 | 27.5 | 9.5 | SULT1B1 | SULT1B1 | ||||||||||||||||||||
| SULT1B1 | 52.4 | 20.4 | TPST1 | TPST1 | ||||||||||||||||||||
| TPST1 | 40.2 | 4.8 | ||||||||||||||||||||||
| Miscellaneous | 12/13 | UGT1A1 | 151.5 | 54.0 | UGT2A1 | NNMT | UGT1A1 | UGT1A1 | TPMT | UGT2A1 | UGT2B | |||||||||||||
| UGT2A1 | 28.0 | 10.0 | UGT2B4 | UGT2A1 | UGT2A1 | UGT2B10 | TPMT | |||||||||||||||||
| UGT2B | 59.1 | 9.7 | TPMT | UGT2B | UGT2B | UGT2B4 | EPHX1 | |||||||||||||||||
| UGT2B10 | 105.5 | 15.8 | UGT2B10 | UGT2B10 | NNMT | |||||||||||||||||||
| UGT2B4 | 38.8 | 13.7 | UGT2B4 | UGT2B4 | ||||||||||||||||||||
| COMT | 32.4 | 8.6 | HNMT | COMT | ||||||||||||||||||||
| HNMT | 169.9 | 20.9 | NNMT | HNMT | ||||||||||||||||||||
| NNMT | 87.8 | 18.3 | NNMT | |||||||||||||||||||||
| TPMT | 33.6 | 25.7 | ||||||||||||||||||||||
| Phase III | ||||||||||||||||||||||||
| Metallothioneins | 8/8 | MT1A | 125.5 | 33.1 | MT1G | MT1A | MT1A | MT1A | ||||||||||||||||
| MT1G | 257.1 | 23.2 | MT1G | MT1G | MT1G | |||||||||||||||||||
| MT1H | 196.7 | 32.6 | MT1H | MT1H | MT1H | |||||||||||||||||||
| MT1L | 267.5 | 34.1 | MT1L | MT1L | MT1L | |||||||||||||||||||
| MT2A | 87.9 | 23.6 | MT2A | MT2A | MTIX | |||||||||||||||||||
| MT3 | 21.2 | 4.3 | MTIX | MT3 | ||||||||||||||||||||
| MTIX | 386.0 | 42.5 | MTIX | |||||||||||||||||||||
| p-Glycoproteins | 3/7 | ABCC2 | 127.1 | 70.4 | ABCC2 | ABCC2 | ABCC2 | ABCC3 | ||||||||||||||||
| ABCC3 | 45.7 | 13.0 | ABCG2 | ABCG2 | ABCG2 | |||||||||||||||||||
| ABCG2 | 131.0 | 39.6 | ||||||||||||||||||||||
| Housekeeping genes | 10/10 | GAPD | 311.2 | 30.3 | PPIA | RPL13A | PPIA | RPL13A | RPL13A | |||||||||||||||
| GAPD | 275.3 | 17.7 | PPIA | RPL13A | PPIA | RPL13A | RPL13A | |||||||||||||||||
| PPIA | 89.5 | 7.6 | PPIA | ACTB | PPIA | ACTB | ACTB | |||||||||||||||||
| PPIA | 88.4 | 11.0 | PPIA | ACTB | ACTB | ACTB | ||||||||||||||||||
| PPIA | 97.7 | 6.8 | ||||||||||||||||||||||
| PPIA | 107.0 | 4.9 | ||||||||||||||||||||||
| RPL13A | −0.3 | 5.1 | ||||||||||||||||||||||
| RPL13A | 0.9 | 4.4 | ||||||||||||||||||||||
| ACTB | 15.3 | 7.1 | ||||||||||||||||||||||
| ACTB | 14.9 | 7.6 | ||||||||||||||||||||||
Primary colon cells isolated from surgical material, LT97 human colon adenoma cells and HT29 cells were plated and grown in medium for 12 h, 72 h, and/or 48 h prior to work-up. Only those genes for which the baseline expression levels reached a signal of ≥10 at least in one cell type are show in the table. Regulation is based on expression levels in primary tissue. Downregulation is defined as a ratio ≥2 (tissue/cells), and a subtractive difference >20. Upregulation is defined as a ratio ≤0.5 (tissue/cells). Data were calculated using the relative signals obtained after normalization from samples of six different donors (biopsies) from three independently reproduced experiments (colon cells).
Means ± SEM, n = 6. The baseline data for this table are in Table I of the accessory data file.
Total culture period.
The evaluation of the data on group basis revealed that the expression levels of GSTs from LT97 were significantly ( P = 0.0317, two-tailed paired t -test) different from HT29 (grown for 48 h after plating). Details comparing the expression levels of all genes are available from the accessory data sheets (accessory data file).
Effects of butyrate
According to the exclusion criteria, butyrate was an efficient inducer of GSTs, clearly resulting in an upregulation of GSTA2 and GSTT2 in primary cells, of GSTM3 , GSTT2 and MGST3 in LT97 cells and of GSTP1 , GSTA4 , GSTM2 , GSTM5 and MGST3 in HT29 cells [ Table II (accessory data file)]. With only normalization procedure 1, upregulation of GSTT2 in LT97 cells (2-fold at 2 mM butyrate) was significant ( P < 0.05 two-way ANOVA, Bonferroni's post-test), as was the GSTP1 upregulation (2.2-fold) in HT29 cells incubated for 72 h ( P <0.001). On a group basis, 1 and 2 mM butyrate treatment induced GSTs in LT97 ( P = 0.0104 and P = 0.0332, respectively; two-way ANOVA). MGST1 was efficiently (0.5-fold) downregulated in HT29 cells. It was one of the only few examples of a clear cut downregulation by butyrate, when taking into acount all the genes on the array. Details of all butyrate-mediated effects on GSTs are shown in Table II (accessory data file).
Overview on the modulation of expression of drug metabolizing enzymes by butyrate in primary colon cells isolated from surgical material in LT97 human colon adenoma cells and in HT29 cells
| Functional gene family | Total number of genes | Primary | LT97 | HT29 | ||||||||
|---|---|---|---|---|---|---|---|---|---|---|---|---|
| 12 h a | 72 h a | 72 h a | 48 h a | |||||||||
| 10 mM | 1 mM | 2 mM | 4 mM | |||||||||
| Phase I | ||||||||||||
| p450 Family | 25 | CYP2F1 | CYP4F3 *** | CYP4F3 *** | POR | POR | ||||||
| CYP3A4 | ||||||||||||
| CYP4F3 ** | ||||||||||||
| CYP7A1 | ||||||||||||
| Phase II | ||||||||||||
| Acetyltransferases | 10 | ACAT1 | ACAT1 | ACAT1 | CRAT | |||||||
| CHAT | CRAT | CRAT | ||||||||||
| DLAT | DLAT | |||||||||||
| NAT1 | NAT1 | |||||||||||
| LOC51126 | LOC51126 | |||||||||||
| Glutathione S -transferases | 12 | GSTA2 | GSTM3 | GSTM3 | GSTP1 *** | GSTA4 | ||||||
| GSTT2 | GSTT2 | GSTT2 * | MGST1 | GSTM2 | ||||||||
| MGST3 | MGST3 | GSTM5 | ||||||||||
| MGST1 | ||||||||||||
| MGST3 | ||||||||||||
| Sulfotransferases | 21 | HNK-1ST | CHST5 | TPST1 *** | ||||||||
| CHST7 | ||||||||||||
| TPST1 | ||||||||||||
| Miscellaneous | 13 | UGT1A1 * | UGT1A1 | TPMT ** | COMT | |||||||
| TPMT ** | UGT2B | |||||||||||
| TPMT *** | ||||||||||||
| Phase III | ||||||||||||
| Metallothioneins | 8 | MT1E | MT1A | MT1A | MT1A | MT1A | ||||||
| MT1L | MT1E | MT1E | MT1E | MT1E | ||||||||
| MT3 | MT1G | MT1G | MT1G | MT1G | ||||||||
| MT1H | MT1H | MT1H | MT1L | |||||||||
| MT1L | MT1L | MT1L | MT3 | |||||||||
| MT2A | MT2A | MT2A | MTIX | |||||||||
| MTIX | MTIX | MTIX | ||||||||||
| p-Glycoproteins | 7 | ABCC2 | ABCB1 | ABCB1 | ||||||||
| ABCC3 | ABCG2 | |||||||||||
| ABCG2 | ||||||||||||
Treatment was for 12 h immediately after explantation (primary cells) or for the last 24 h of the whole cultivation period (LT97 and HT29 cells). Only those genes are shown for which the baseline expression levels reached a signal of ≥10. Bold letters: butyrate-mediated change was ≥2-fold with subtractive differences >20s. Normal letters: butyrate-mediated change was at least 1.5-fold and/or with subtractive differences at least 15. MGST1 was the only gene which was downregulated with a butyrate-mediated change of 0.5-fold. Data were calculated using the mean relative signals obtained after normalization from three independently reproduced experiments. Individual genes were significantly different from medium controls ( *P < 0.05; **P < 0.01; ***P < 0.001; repeated measures ANOVA with Bonferroni's post-test to compare replicate means by row). The baseline data for this table are in Table II of the accessory data file.
Total culture period.
These experiments were independently reproduced three times, thus reducing the necessity of performing the obligatory confirmational experiments usually required for microarray analysis. However, we had some data (e.g. for GSTP1, GSTM2 and GSTA4 in HT29) available from previous work, as indicated in the legend of Table II and the expression levels of GSTP1 in LT97 (no induction in the macro array) and in HT29 (induction in the macro array) were additionally confirmed by northern blot using aliquots of the same RNA. Figure 2 shows that the northern blot results are fully confirmatory of the microarray results. We also subjected an aliquot of the RNA isolated from LT97 (medium control, 1 or 2 mM butyrate) to expression analysis using Affymetrix®. Table III summarizes data for genes which were induced by butyrate using Superarray® ( n = 3) and which were also spotted on Affymetrix® ( n = 1). ( Table III of the accessory data file shows additional comparisons for genes with signals >10 which were not induced according to Superarray analysis, but which were spotted on the Affymatrix array.) Of these 14 genes, all but one ( GSTT2 ) gave results in the same direction. Therefore, GSTT2 expression was additionally confirmed with real-time RT–PCR.
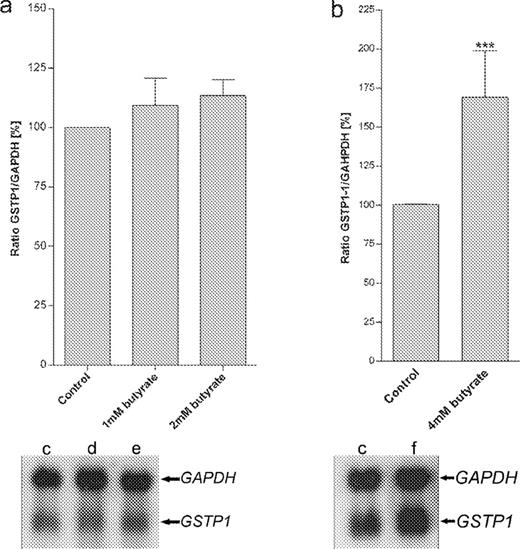
Northern blots showing the expression of GSTP1 mRNA in human adenoma LT97 ( a ) and HT29 colon cancer cells ( b ). LT97 and HT29 cells were treated with 1, 2 or 4 mM butyrate. Lane c = control cells, d = 1 mM, e = 2 mM butyrate and lane f = 4 mM butyrate. Values are expressed as mean ±SEM, n = 3, ***P < 0.001 (a: one-way ANOVA, b: unpaired t -test).
Modulation of gene expression in LT97 adenoma cells by butyrate
| Gene | Superarray | Affymetrix | ||||||||||||
|---|---|---|---|---|---|---|---|---|---|---|---|---|---|---|
| Fold change | Fold change | |||||||||||||
| 1 mM | 2 mM | 1 mM | 2 mM | |||||||||||
| Phase I | ||||||||||||||
| p-450 family | CYP3A7 | 1.7 | 2.2 | CYP3A7 | 0.7 | 0.7 | 211843_x_at | |||||||
| CYP4F3 | 1.7 | 2.4 | CYP4F3 | 3.7 | 6.5 | 206514_s_at | ||||||||
| Phase II | ||||||||||||||
| Acetyltransferases | ACAT1 | 4.0 | 3.5 | ACAT1 | 1.7 | 1.9 | 205412_at | |||||||
| CRAT | 2.4 | 2.6 | CRAT | 2.2 | 1.9 | 209522_s_at, 205843_x_at | ||||||||
| DLAT | 3.9 | 4.9 | DLAT | 1.1 | 1.1 | 213149_at, 212568_s_at | ||||||||
| HAT1 | 2.4 | 2.7 | HAT1 | 0.6 | 1.0 | 203138_at | ||||||||
| LOC51126 | 3.4 | 4.4 | LOC51126 | 1.4 | 1.5 | 203025_at | ||||||||
| NAT1 | 3.6 | 4.5 | NAT1 | 2.1 | 3.6 | 214440_at | ||||||||
| Glutathione S -transferases | GSTA4 | 6.1 | 2.7 | GSTA4 | 2.2 | 1.7 | 202967_at | |||||||
| GSTM2 | 3.2 | 3.5 | GSTM2 | 0.6 | 0.7 | 204418_x_at | ||||||||
| GSTM3 | 5.8 | 7.3 | GSTM3 | 3.9 | 4.3 | 202554_s_at | ||||||||
| MGST3 | 2.0 | 2.7 | MGST3 | 1.1 | 1.1 | 201403_s_at | ||||||||
| GSTT2 | 1.5 | 2.0 | GSTT2 | 0.9 | 1.8 | 205439_at | ||||||||
| Sulfotransferases | CHST5 | 1.4 | 2.0 | CHST5 | 1.2 | 0.8 | 64900_at | |||||||
| TPST1 | 2.7 | 3.9 | TPST1 | 1.6 | 1.9 | 204140_at | ||||||||
| CHST7 | 1.2 | 1.6 | CHST7 | 6.7 | 10.4 | 206756_at | ||||||||
| Miscellaneous | EPHX1 | 2.9 | 2.9 | EPHX1 | 2.6 | 1.5 | 202017_at | |||||||
| LTA4H | 3.2 | 3.7 | LTA4H | 1.9 | 2.3 | 208771_s_at | ||||||||
| UGT1A1 | 2.5 | 1.8 | ||||||||||||
| COMT | 2.3 | 2.5 | COMT | 0.3 | 0.4 | 208818_s_at, 208817_at | ||||||||
| HNMT | 2.1 | 2.0 | HNMT | 0.4 | 0.2 | 204112_s_at, 211732_x_at | ||||||||
| TPMT | 1.6 | 2.2 | TPMT | 1.7 | 1.4 | 203671_at, 203672_x_at | ||||||||
| Metallothioneins | MT1A | 3.8 | 2.9 | |||||||||||
| MT2A | 6.8 | 4.9 | MT2A | 4.8 | 5.7 | 212185_x_at, 212859_x_at | ||||||||
| MT1L | 5.0 | 4.4 | ||||||||||||
| MT1G | 2.7 | 2.3 | MT1G | 1.9 | 4.5 | 204745_x_at, 210472_at | ||||||||
| MT1H | 2.6 | 2.2 | MT1H | 4.9 | 6.1 | 206461_x_at | ||||||||
| MT3 | 2.6 | 4.2 | MT3 | 2.9 | 4.5 | 205970_at | ||||||||
| MTIX | 4.1 | 3.8 | MT1X | 6.3 | 8.8 | 204326_x_at, 208581_x_at | ||||||||
| Phase III | ||||||||||||||
| p-Glycoproteins | ABCB1 | 169.7 | 205.4 | ABCB1 | 2.4 | 1.5 | 209994_s_at, 209993_s_at | |||||||
| ABCC3 | 0.7 | 0.4 | ABCC3 | 0.1 | 0.0 | 208161_s_at, 209641_s_at | ||||||||
| ABCG2 | −19.7 | −14.6 | ABCG2 | 2.2 | 2.0 | 209735_at | ||||||||
Comparison of two array methods for those genes which were changed (≥2 fold in comparison to the respective medium control). For the Superarray® membranes, all genes (including those with expression levels <10) were regarded in this evaluation. Bold lettering means that the values are ≥2- or ≤0.5-fold change (butyrate-treated sample/medium control), which is defined as induction or inhibition, respectively. Fold change—mean value of probe sets named in Affymetrix® array (Superarray® n = 3; Affymetrix® n = 1).
Analysis of the effect of butyrate on the colon adenoma cell line LT97 with Affymetrix® arrays also shows a significant regulation of a larger number of other genes (∼500) connected with various other cellular processes. These data however, do not interfere with the discussed effect on the detoxifying genes and will be presented in another manuscript under preparation.
Confirmatory studies of array GSTT2 gene expression by real-time RT–PCR
The modulation of the GSTT2 gene was confirmed by an independent measure of mRNA levels. Relative mRNA levels using cDNA macroarray were reasonably consistent with relative mRNA levels determined using real-time RT–PCR, which is more sensitive than northern blot analysis. We found that the relative GSTT2 expression level was 2.73, 2.52-fold and 2.08-fold in the cells treated with 1 or 2 mM (LT97) and 4 mM (HT29) butyrate, respectively ( Figure 3a and b ). The increased expression of the GSTT2 gene was statistically significant (one-way ANOVA and unpaired t -test).
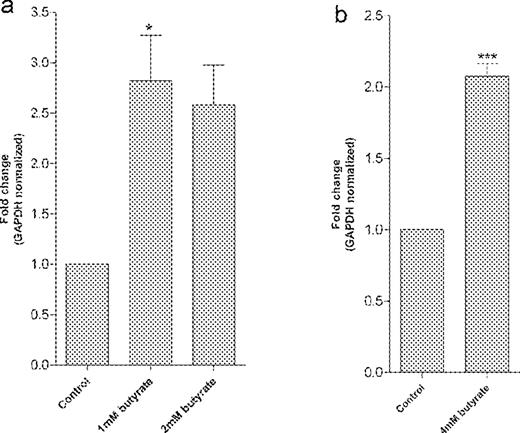
Quantitative analysis of GSTT2 mRNA transcript by real-time RT–PCR in LT97 cells ( a ) and HT29 cells ( b ) treated with 1, 2 and 4 mM butyrate, respectively. The relative gene expression analysis in HT29 cells showed 2.08-fold ( ***P < 0.001) and in LT97 cells 2.73 ( *P < 0.05), 2.52-fold ( *P < 0.05) (a: one-way ANOVA, b: unpaired t -test) increase compared with control cells.
Discussion
Colon cell systems
In vitro studies provide important tools to enhance our understanding of hazardous effects by chemicals and to predict the potential consequences of exposure to humans ( 39 ). There is also an increasing need to investigate chemicals for mechanisms of beneficial effects on health using in vitro methods ( 40 ). Colorectal cells and cell lines are highly useful in studying the genotoxic potentials of cancer risk factors ( 32 , 41 – 43 ), properties of chemoprotective components ( 27 , 44 – 46 ), as well as their interactions ( 26 , 38 , 47 ). The majority of such in vitro studies have utilized tumor cell lines. Whilst this may be feasible for studies on chemotherapeutic potentials, primary or premalignant cells are needed for studies on chemoprevention. However, it has been hardly possible to study early changes affecting the normal colonic epithelial cells owing to the lack of manageable culture methods for those cells ( 33 ). We have recently demonstrated the validity of using intact primary colonic epithelial cells (for 30 min–1 h) as models to assess the genotoxicity of risk factors ( 32 , 41 , 48 ). We have now extended our methodology to first cultivate the intact tissue in vitro and then to isolate cells, which was profoundly successful for retaining cell viability. Thus, we were able to treat primary tissue with butyrate for up to 12 h and then isolate viable cells in sufficient quantity and quality for expression analysis.
We had previously also reported novel findings on how a newly established cell line (LT97), consisting of epithelial cells representing an early premalignant phenotype and genotype, could be used as an experimental model to investigate the impact of risk factors ( 42 ). The LT97 cells have typical genetic traits of adenoma, such as loss of both APC tumor suppressor gene alleles and a mutated Ki-Ras- allele, but normal TP53 ( 33 ). This cell line was investigated along with primary and HT29 tumor cells, since there was a need to understand how cell models from these three different stages (non-malignant primary cells, premalignant adenoma cells and malignant tumor cells) would respond to the gut-lumen specific environmental factors.
GSTs in colon tissue
Tissue specimens were included for reference purposes, since this type of material is commonly used to understand gene expression in the human colon and reflects more the expression levels of the in vivo situation than cells in culture ( 49 ). Here, we have focused our attention on the expression of GSTs (accessory data file), since phase II metabolism is decisive for cell and tissue-specific susceptibility. The activities of both toxic and antitoxic agents are probably highly dependent on the expression of such biotransformation enzymes by which they can be detoxified and which, in turn, they may modulate ( 50 , 51 ). Information on gene expression levels is only available sporadically and data usually pertain to only selected individual genes. We have therefore used expression genomics to enhance our understanding on GSTs [and other drug metabolism systems (accessory data file)] in colon tissue and cells. These advanced methods are very powerful in that they can generate expression data for a large number of genes simultaneously across multiple samples. Here, we have been able to show the GST gene expression levels in tissue directly excised from the colon of six different individuals. The variation on transcriptional level was in a similar order of magnitude as we had previously observed for GST protein expression in colon samples obtained from 15 donors ( 25 ). In these previous studies, some samples contained 2- to 4-fold higher GST protein levels than others and in some of the samples, not even the most common colonic GST form, namely GSTP1-1 was available in abundant amounts. The results of this study (mRNA from 12 GST isoenzymes, 6 donors) also show a 2-fold difference between the person with the lowest and highest values of GST expression. On the basis of our present knowledge, we may conclude that a considerable number of subjects could be at higher risk on account of low GST expression levels.
GSTs in cell models compared with tissues
We have now, for the first time, been able to study the expression levels in cells isolated from the tissues (primary cells) incubated in vitro for a period up to 12 h. This was the longest duration of in vitro culture yielding sufficient viable cells that had succeeded in our hands so far. Several genes were differently expressed in the primary cells, compared with tissues. Three of the 12 investigated GSTs ( GSTA2,GSTA3, and MGST1 ) were expressed less, whereas three GSTs ( GSTM2, GSTM3 and GSTM5 ) were expressed more in the cells than in the tissue, reflecting changes probably owing to the cultivation in vitro . In comparison, LT97 and HT29 cells cultivated for 72 h before work-up revealed more striking differences to the tissue samples. Of the 12 GSTs, 7 and 7 respectively, were expressed less in the cells than in the tissue. The differences, however, were not cell line specific, since in HT29 cells cultivated for only 48 h, four genes were expressed less and two additional genes were expressed more. These results again clearly show that the in vitro cultivation conditions had marked influence on gene expression, and thus these need to be carefully controlled during experiments using cells in vitro .
GST upregulation as a mechanism of chemoprevention
The described comparative analyses (tissue versus colon cells) were needed as a basis to set up the experimental conditions of further studies. These studies had the aim to define specific GST expression patterns in human colon cells of various origins, to determine whether these could be modulated by butyrate, and to assess whether the modulation would be likely to confer protection against diet-associated risk factors. Thus, we have now found that butyrate is an efficient inducer of several GSTs in cells from all three stages of malignancy. Treatments with the maximal tolerated doses of butyrate resulted in an upregulation of GSTP1, GSTM2 , GSTA4, MGST3 and others in HT29 cells, of GSTM2, GSTM3 , GSTT2 and GSTA4 in LT97 cells and of GSTA2 and GSTT2 in primary cells, with a marked downregulation of MGST1 in HT29 cells. According to the available databases, the products of these genes inactivate endogenous α, β-unsaturated aldehydes, quinones, epoxides and hydroperoxides formed as secondary metabolites during oxidative stress and protect from food contaminants, such as polycyclic aromatic hydrocarbons ( 24 ). For instance the gene product GSTA4-4 was previously reported to have a high affinity for the substrate 4-hydroxynonenal (HNE) ( 52 , 53 ), which is a cytotoxic and mutagenic lipid peroxidation product associated with oxidative stress (54). GSTA2-2 may be of similar importance as GSTA4-4, but with different substrate specificity, resulting in the detoxification of other products, such as cumene hydroperoxide, dibenzo[ a , l ]pyrene diol epoxide, 7-chloro-4-nitrobenz-2-oxa-1,3-diazole ( 24 ). GSTP1-1 may inactivate benzo[ a ]pyrene-9,12-diolepoxide, the reactive intermediate of benzo[ a ]pyrene ( 55 ), which is of dietary relevance, since it may be found in cooked foods ( 56 ). Other preferential substrates for GSTP1-1 are acrolein, base propenals, chlorambucil, crotonyloxymethyl-2-cyclohexenone (COMC-6), ethacrinic acid (EA) and thiotepa ( 24 ). GSTM2-2 is known to efficiently detoxicate O -quinones (e.g. aminochrome), the oxidation products of catecholamines, which may be involved in the development of the Parkinson's disease ( 57 ). Other GSTM2-2 substrates are COMC-6, DCNB, dopa O -quinone and prostaglandins ( 24 ). The human class GSTTs display activity against a broad range of compounds, including methyl halides and sulfate esters. The activity of recombinant GSTT2-2 with a range of secondary lipid peroxidation products, as well as its reported glutathione peroxidase activity with organic hydroperoxides, suggests that it may play a significant role in protection against the products of lipid peroxidation ( 58 ), and its substrates cumene hydroperoxide and menaphthyl sulfate ( 24 ). Finally, the MGST3 gene encodes an enzyme, which catalyzes the conjugation of leukotriene A4 and reduced GSH to produce leukotriene C4. This enzyme also demonstrates GSH-dependent peroxidase activity towards lipid hydroperoxides ( 59 ) and conjugates CDNB and ( S )-5-hydroperoxy-8,11,14- cis -6- trans -eicosatetraenoic acid ( 24 ). MGST1 encodes a protein that catalyzes the conjugation of GSH to electrophiles and the reduction of lipid hydroperoxides ( 60 ). Particular substrates are CDNB, cumene hydroperoxide, hexachlorobuta-1,3-diene ( 24 ). MGST1 was inhibited in HT29 cells, and thus the only example of a clear cut downregulation by butyrate when regarding all genes on the array. The consequences of the downregulation of this GST are not predictable and need to be studied in more detail.
Altogether, a number of the butyrate target genes can be associated with potential chemoprotection, since they should have the ability to ward off risk factors associated with oxidative stress and genotoxic risks ( 61 ). Their life-long upregulation in primary cells by dietary butyrate may therefore contribute to the prevention of carcinogenesis, which may be mediated by genotoxic products of oxidative stress ( 62 , 63 ). The ingestion of dietary fibres providing sufficient luminal butyrate concentrations may accordingly be considered to substantially contribute to an effective strategy of dietary cancer chemoprevention.
Confirmatory data
Altogether the evaluation of our expression analysis data was based on n = 3 independent experiments (cell culture experiments) or on the data obtained by n = 6 individual donors, strengthening the validity of the measurement. We compared different normalization procedures and stick to the one basing the 100% value on the means of all housekeeping genes. The reported responses found with GSTs using this normalization have largely been confirmed independently with other methods. For example, we have previously found that GSTP1-1, GSTM2-2, GSTA1/2 proteins and GSTM2 mRNA were induced in HT29 cells treated with 2–4 mM butyrate ( 25 ), as were GSTA4 mRNA and GSTA4-4 protein ( 29 ). In LT97 cells, GSTP1-1 protein was not induced by butyrate pretreatment (T.Kautenburger et al ., submitted for publication), the genes found to be modulated in this study ( GSTM3, GSTT2, MGST3 ) had not been investigated since antibodies were not available. Other confirmatory data were generated here, such as GSTP1 induction in HT29 and non-induction in LT97 using northern blot analysis.
Interestingly, the independent evaluation of RNA aliquots using two different array methods gave often similar results, which is to our knowledge, the first direct comparison of this type. An exception was GSTT2 which was induced according to Superarray®, but not to Affymetrix®. We therefore additionally investigated GSTT2 expression using another aliquot of the RNA by real-time qRT–PCR. The results confirmed the responses observed for GSTT2 with Superarray® but not with Affymetrix®. The inability to detect the induction of GSTT2 on Affymetrix® array is most possibly owing to the characteristics of the GSTT2 probe set. The signal given by GSTT2 is so weak that it is assumed by the analysis software as absent both in control and treated cells. However, the signal intensity increased 1.8 times in cells treated with 2 mM butyrate versus control cells.
Potential mechanisms of GST induction in human cells
One important mechanism which is critical for regulation of some, but not all phase II genes (including some GSTs or NADPH-dependent quinone reductase) involves the antioxidant/electrophile-responsive element (ARE/ERE) located within the 5′ upstream (consensus sequences 5′-GTGACNNNGC-3′) regulatory region of the corresponding mouse, rat and human genes ( 64 , 65 ). A major transcription factor which can act on ARE is Nrf2 (nuclear factor E2-related factor 2) ( 66 , 67 ). As a key regulator of Nrf2 activity, which links Nrf2-mediated ARE activation to cellular exposure to oxidants and chemoprotective agents, the BTB- and Kelch-domain containing protein Keap1 (Kelch-like ECH-associated protein 1) has been identified. Keap1 anchors the transcription factor Nrf2 in the cytoplasm and targets it for ubiquitination and proteasome degradation, thereby repressing its ability to induce phase II genes ( 68 ). Inducers of ARE-mediated gene expression disrupt the Keap1–Nrf2 complex, leading to an increase in Nrf2 levels, and allowing Nrf2 to translocate into the nucleus ( 69 ). Some of the GST-encoding genes contain ARE motif and can be induced in an ARE-mediated manner ( 24 ). ARE sequences in the promoter of GSTA2 are required for basal expression and for its induction by phenolic antioxidants ( 70 ). These compounds activate GST-encoding genes, however, also through the AP-1 family of transcription factors, which include Jun, Fos, Maf, ATF and Fra proteins ( 71 ). AP-1-binding sites have been identified in the promotor regions of the GSTA1 , GSTA4 and GSTP1 genes ( 72 , 73 ). In addition, C/EBPβ (CCAAT/enhancer binding protein β), which is a member of the C/EBP bZip class of transcription factors, may serve as a more common transcriptional factor for the induction of phase II enzymes and cancer chemoprevention.
The mechanisms by which butyrate probably mediates gene expression in human colon tumor cells are by activation of the mitogen-activated protein kinase (MAPK) signalling transduction pathway ( 26 ), and by modifying the acetylation of histones at the N-terminal lysine rich tails ( 74 , 75 ). Two classes of enzymes can affect the acetylation of histones, namely histone acetyltransferases (HATs) and histone deacetylases (HDACs). The classes of compounds that are identified as HDAC inhibitors now include: short–chain fatty acids, such as butyrate and several analogues ( 76 ). HDAC inhibitors from several different structural classes exhibit clinical activity against a variety of human malignancies, and have also attracted interest as potential chemopreventive agents. Butyrate inhibits HDAC activity and cell growth at millimolar concentrations. Our own studies have shown that treatment of human colon cells HT29 leads to the marked accumulation of acetylated histone 4 (H4), which could be related to enhanced levels of GST-encoding gene expression in these cells ( 77 ). More elaborate studies by Mariadason et al . ( 78 ) conclude a tight correspondence between the kinetics of altered histone acetylation and kinetics of altered expression for genes in specific clusters and that changes in HDAC activity underlie the changes in expression for these genes. Whether or not promoter areas of GSTs are actually targeted by this mechanism is not known and will be an important subject of research in the near future.
Double-edged sword/GST induction in tumor cells
It remains to be elucidated, whether the typical expression patterns can afford chemoresistance of the cells to appropriate substrates, some of which may be colon cancer risk factors. It must also be clarified for each of the target genes in more detail by which mechanisms their butyrate-mediated induction proceeds on molecular level, e.g. by inhibiting the deacetylation of histones ( 79 ) and/or through MAPK pathways leading to the transcriptional activation of antioxidative response element ( 19 ).
In this context, we must also again consider the concept of a double-edged sword. On one hand, an induction of GSTs in primary cells seems straightforward and favourable since this should result in an enhanced detoxification of risk factors. Connected to this is a reduced probability of cancer initiation in the underlying stem cells. In tumor and in adenoma cells, on the other hand, GST induction could counteract cancer chemotherapy by causing resistance to therapeutic agents, thereby enhancing the survival of transformed cells ( 26 ). However, this adverse situation, may not be probable in vivo , since the luminal millimolar concentrations of butyrate could be much too high (exceeding 2–4 mM) to result in GST induction. Instead physiological gut luminal butyrate concentrations would impair tumor cell or adenoma cell growth and thus decrease availability of such cells for GST induction. The physiologically available butyrate amounts may also be efficient in inducing apoptosis in tumor cells and thus additionally remove them from the tissue. Another reflection is that, not only butyrate, but also propionate is produced during gut fermentation, and this short chain fatty acid adds on to the growth inhibitory properties of gut luminal products ( 80 , 81 ). Finally, according to all available information, the concentrations found in the gut lumen are much higher (10–20 mM) than the concentrations used here ( 82 , 83 ), albeit in vivo colon tissue is probably more protected from the gut luminal components by barrier functions of the mucosa ( 84 ) than they are in vitro in cell culture. However, it may still be speculated that emerging premalignant and malignant cells will be removed owing to the toxic and growth inhibitory properties of SCFA before GST induction can occur.
Physiological butyrate concentrations may indeed retard tumor progression and lead to a reduced tumor incidence, as has been suggested by the results of a number of animal studies. Dietary fibres, which are fermented to yield high amounts of butyrate, have been associated with a higher efficacy of protecting from AOM-induced colon tumors in animals ( 85 – 88 ). In particular, an in vivo study by Perrin demonstrated that those fibres, which promoted a stable butyrate-producing colonic ecosystem decreased the rate of aberrant crypt foci in rats, thus adding on to the line of evidence that a stable butyrate producing colonic ecosystem related to dietary plant foods reduces risks of developing colon cancer ( 87 ).
Conclusions
A considerable number of subjects could be at higher risk on account of low GST expression levels in their colonocytes. The hypothesis is that butyrate may mediate in colonocytes an enhanced expression of GSTs and other systems, which protect from products of oxidative stress. We have now been able to add evidence to support this possible mechanism using new systems of in vitro toxicology, namely, primary human colon cells. The favourable modulation of toxicological defence systems in these cells is expected to contribute to protection during early stages of carcinogenesis by resulting in an enhanced cellular protection from cancer risk factors. Butyrate also has the potential to inhibit growth of emerging premalignant and malignant cells, which could conceivably retard tumor progression. When translated to the in vivo situation, it must be first of all be taken into account that results on gene expression regulation in some conditions in vitro may misrepresent the status of regulation of the same genes in vivo . However, the results are also promising in that they could also mean that a life-long supply with butyrogenic dietary plant foods may contribute substantially to dietary colon cancer chemoprevention. This is a feasible hypothesis, which will be needed to be proved in human clinical trials.
We thank Prof. Marian, Institute of Cancer Research, University of Vienna, Austria for the generous gift of LT97 adenoma cells, to all donors of biopsies and tissue samples for giving their informed consent and supporting the work. We are grateful to Dr Volker Mai for valuable discussion and editorial comments. We were supported by the German Research Council, Deutsche Forschungsgemeinschaft, Germany (DFG PO 284/8-1) for work on primary cells, Bundesministerium für Forschung und Technologie, Germany (BMBF FKZ.01EA0103) for work on LT97 adenoma cells, ORAFTI, Tienen, Belgium (PRECANTOO) for work on butyrate and HT29 cells.
Conflict of Interest Statement : None declared.
References
Pisani,P., Parkin,D.M., Bray,F. and Ferlay,J. (
Lynch,H.T. and de la Chapelle,A. (
Fearon,E.R. and Vogelstein,B. (
Fodde,R., Smits,R. and Clevers,H. (
Wakabayashi,K., Nagao,M., Esumi,H. and Sugimura,T. (
World Cancer Research Fund and American Institute for Cancer Research. (
Eisenbrand,G. and Tang,W. (
Turesky,R.J., Lang,N.P., Butler,M.A., Teitel,C.H. and Kadlubar,F.F. (
Malfatti,M.A. and Felton,J.S. (
Langouet,S., Coles,B., Morel,F., Becquemont,L., Beaune,P., Guengerich,F.P., Ketterer,B. and Guillouzo,A. (
Ishikawa,T. (
Davies,R.J., Sandle,G.I. and Thompson,S.M. (
Hayes,J.D. and Pulford,D.J. (
Brockton,N.T. (
Strassburg,C.P., Vogel,A., Kneip,S., Tukey,R.H. and Manns,M.P. (
Wattenberg,L.W. (
Johnson,I.T., Williamson,G. and Musk,S.R.R. (
Suhr,Y.J. (
Houlston,R.S. and Tomlinson,I.P.M. (
Hoensch,H.P. and Hartmann,F. (
Kensler,T.W. and Helzlsouer,K.J. (
Roebuck,B.D., Curphey,T.J., Li,Y., Baumgartner,K.J., Bodreddigari,S., Yan,J., Gange,S.J., Kensler,T.W. and Sutter,T.R. (
Hayes,J.D., Flanagan,J.U. and Jowsey,I.R. (
Ebert,M.N., Klinder,A., Schäferhenrich,A., Peters,W.H.M., Sendt,W., Scheele,J. and Pool-Zobel,B.L. (
Ebert,M.N., Beyer-Sehlmeyer,G., Liegibel,U.M., Kautenburger,T., Becker,T.W. and Pool-Zobel,B.L. (
Abrahamse,S.L., Pool-Zobel,B.L. and Rechkemmer,G. (
Blaut,M., Schoefer,L. and Braune,A. (
Knoll,N., Ruhe,C., Glei,M., Gallagher,E.P., Sauer,J., Veeriah,R. and Pool-Zobel,B.L. (
Peters,W.H.M., Roelofs,H.M.J., Nagengast,F.M. and van Tongeren,J.H.M. (
Butte,A. (
Schäferhenrich,A., Sendt,W., Scheele,J., Kuechler,A., Liehr,T., Claussen,U., Rapp,A., Greulich,K.O. and Pool-Zobel,B.L. (
Richter,M., Jurek,D., Wrba,F., Kaserer,K., Wurzer,G., Karner-Hanusch,J. and Marian,B. (
Fogh,J. and Trempe,X. (
Lupton,J.R. (
Daniel,H. (
Kroll,T.C. and Wolfl,S. (
Hardwick,J.C., Van Santen,M., Van Den Brink,G.R., Van Deventer,S.J. and Peppelenbosch,M.P. (
Eisenbrand,G., Pool-Zobel,B.L., Baker,V. et al . (
Verhagen,H., Aruoma,O.I., van Delft,J.H.M., Dragsted,L.O., Ferguson,L.R., Knasmüller,S., Pool-Zobel,B.L., Poulson,H.E., Williamson,G. and Yannai,S. (
Pool-Zobel,B.L. and Leucht,U. (
Schäferhenrich,A., Beyer-Sehlmeyer,G., Festag,G. et al . (
Glei,M., Klinder,A., Latunde-Dada,G.O., Becker,T.W., Hermann,U., Voigt,K. and Pool-Zobel,B.L. (
Glei,M., Matuschek,M., Steiner,C., Böhm,V., Persin,C. and Pool-Zobel,B.L. (
Agullo,G., Gamet-Payrastre,L., Fernandez,Y., Anciaux,N., Demigné,C. and Rémésy,C. (
Ciacco,P.J., Shen,H., Jaiswal,A.K., Lyttle,M.H. and Tew,K.D. (
Steele,V.E., Kelloff,G.F., Balentine,D., Boone,C.W., Mehta,R., Bagheri,D., Sigma,C.C., Zhu,S. and Sharma,S. (
Pool-Zobel,B.L., Abrahamse,S.L., Collins,A.R., Kark,W., Gugler,R., Oberreuther,D., Siegel,E.G., Treptow-van Lishaut,S. and Rechkemmer,G. (
Glebov,O.K., Rodriguez,L.M., Nakahara,K. et al . (
Arturrson,P. and Borchardt,R. (
Ito,K., Iwatsubo,T., Kanamitsu,S., Nakajima,Y. and Sugiyama,Y. (
Hubatsch,I., Ridderström,M. and Mannervik,B. (
Bruns,C.M., Hubatsch,I., Ridderström,M., Mannervik,B. and Tainer,J.A. (
Esterbauer,H., Eckl,P. and Ortner,A. (
Hu,X., Herzog,C., Zimniak,P. and Singh,S.V. (
Baez,S., Segura-Aguilar,J., Widersten,M., Johansson,A.S. and Mannervik,B. (
Tan,K.L. and Board,P.G. (
Schroder,O., Sjostrom,M., Qiu,H., Stein,J., Jakobsson,P.J. and Haeggstrom,J.Z. (
Jakobsson,P.J., Morgenstern,R., Mancini,J., Ford-Hutchinson,A. and Persson,B. (
Hayes,J.D. and Strange,R.C. (
Toyokuni,S., Okamoto,K., Yudoi,J. and Hiai,H. (
Waleh,N.S., Calaoagan,J., Murphy,B.J., Knapp,A.M., Sutherland,R.M. and Laderoute,K.R. (
Rushmore,T.H., Morton,M.R. and Pickett,C.B. (
Chui,D.H., Tang,W. and Orkin,S.H. (
Itoh,K., Chiba,T., Takahashi,S. et al . (
Zhang,D.D. and Hannink,M. (
Wakabayashi,N., Dinkova-Kostova,A.T., Holtzclaw,W.D., Kang,M.I., Kobayashi,A., Yamamoto,M., Kensler,T.W. and Talalay,P. (
Chen,C., Yu,R., Owuor,E.D. and Kong,A.N. (
Pinkus,R., Weinert,L.M. and Daniel,V. (
Desmots,F., Rauch,C., Henry,C., Guillouzo,A. and Morel,F. (
Whalen,R. and Boyer,T. (
Boffa,L.C., Lupton,J.R., Mariani,M.R., Ceppi,M., Newmark,H.L., Scalmati,A. and Lipkin,M. (
Marks,P.A., Rifkind,R.A., Richon,V.M., Breslow,R., Miller,T. and Kelly,W. (
Marks,P.A., Richon,V.M. and Rifkind,R.A. (
Kiefer,J., Beyer-Sehlmeyer,G. and Pool-Zobel,B.L. (
Mariadason,J.M., Corner,G.A. and Augenlicht,L.H. (
Marks,P.A., Rifkind,R.A., Richon,V.M., Breslow,R., Miller,T. and Kelly,W. (
Beyer-Sehlmeyer,G., Glei,M., Hartmann,F., Hughes,R., Persin,C., Böhm,V., Rowland,I.R., Schubert,R., Jahreis,G. and Pool-Zobel,B.L. (
Klinder,A., Gietl,E., Hughes,R. et al . (
Cummings,J., Pomare,E.W., Branch,W.J., Naylor,C.P.E. and Macfarlane,G.T. (
Caderni,G., Femia,A.P., Giannini,A., Favuzza,A., Luceri,C., Salvadori,M. and Dolara,P. (
Compher,C.W., Frankel,W.L., Tazelaar,J., Lawson,J.A., McKinney,S., Segall,S., Kinosian,B.P., Williams,N.N. and Rombeau,J.L. (
McIntyre,A., Gibson,P.R. and Young,G.P. (
Perrin,P., Pierre,F., Patry,Y., Champ,M., Berreur,M., Pradal,G., Bornet,P., Meflah,K. and Menenteau,J. (
Author notes
Department of Nutritional Toxicology, Institute for Nutrition, Friedrich-Schiller-University, Dornburger Strasse 25, D-07743 Jena, Germany, 1Department of General and Visceral Surgery, Clinic for Surgery and 2Department of Molecular Medicine, Clinic for Internal Medicine II, Friedrich-Schiller-University, Erlanger Allee 101, D-07743 Jena, Germany
