


Abstract
Iron and lipids combine to create oxidative stress, and oxidative stress has a role in the development of cancer. The objective was to determine the risk of cancer among persons who had both elevated iron and lipids. The authors conducted an analysis of the cohort available in the Framingham Offspring Study. Adults aged 30 or more years at baseline had serum iron and high density lipoprotein cholesterol (HDL-C), low density lipoprotein cholesterol, and very low density lipoprotein cholesterol (VLDL-C) assessed in 1979–1982 and were followed for development of cancer until 1996–1997 (n = 3,278). Cox regression models were computed while controlling for age, gender, smoking status, and body mass index. In adjusted models, both elevated iron (hazard ratio (HR) = 1.66, 95% confidence interval (CI): 1.11, 2.46; 29 cases) and VLDL-C (HR = 1.54, 95% CI: 1.04, 2.28; 93 cases) had significant independent risks for development of cancer. When elevated iron was combined with elevated VLDL-C, the adjusted relative risk of cancer increased (HR = 2.68, 95% CI: 1.49, 4.83; 18 cases). Elevated iron and low HDL-C also had a significant adjusted relative risk of cancer (HR = 2.82, 95% CI: 1.50, 5.28; 14 cases). The results suggest that elevated serum iron levels coupled with either high VLDL-C or low HDL-C appear to interact to increase cancer risk in this cohort.
Free radicals and oxidants are continuously generated within mammalian cells but are normally neutralized by the body's antioxidant metabolism. Oxidative stress can damage lipids, proteins, and DNA. Recent evidence has suggested that oxidative stress plays a role in the pathogenesis of cancer (1–3). For example, significantly higher plasma levels of lipid peroxidation products have been detected in patients with early and advanced cancers compared with healthy volunteers (4).
Trace metals play an important catalytic role with lipids in the formation of reactive oxygen species and oxidative stress. Trace metals have been shown to catalyze the oxidation of both low density lipoprotein (LDL) (5, 6) and very low density lipoprotein (VLDL) (7, 8). In contrast, high density lipoprotein (HDL) has demonstrated the ability to protect LDL from trace metal-induced oxidation (9–12). Iron, in particular, is a key component in catalyzing the production of reactive radicals and creating lipid peroxidation and oxidative stress (13–16).
As independent risks, neither elevated body iron stores nor elevated lipids have exhibited particularly strong relations with the development of cancer in humans. For example, several studies have shown that transferrin saturation had no significant association with cancer until transferrin saturation levels were at least 60 percent (17, 18). The data on the relation between lipids and cancer are mixed. One study suggested that low HDL is associated with increased risk for cancer mortality (19). Other studies have suggested a weak relation between low serum total cholesterol and cancer risk, although some data suggest that an inverse relation between serum cholesterol and cancer may simply be an artifact of persons with preexisting, subclinical disease at baseline who were classified as cancer free (20–22).
Although there are data showing the important role of iron and lipids in the creation of oxidative stress and the corresponding role of oxidative stress in the development of cancer, it is unclear from a population perspective whether persons with high levels of iron and lipids are at increased risk for developing cancer. Because of the role of iron in catalyzing reactions with lipoproteins that produce lipid peroxidation, it is important to examine the effect of iron and lipids in combination, rather than their singular independent relations, in the development of cancer. Thus, the purpose of this study was to examine in a cohort the risk of cancer among persons with the combination of elevated iron and lipids.
MATERIALS AND METHODS
Sample
Adults (≥30 years of age at the second examination) in the Framingham Offspring Study's cohort were analyzed (n = 3,278). The cohort was established in 1971–1975 with follow-ups in 1979–1982, 1984–1987, 1987–1990, 1991–1995, and 1996–1997. Although the cohort was established in 1971 with a baseline evaluation, levels of serum iron were not measured in that evaluation. Therefore, the second cycle of data collection (1979–1982) was used as the baseline for this study. Thus, the cohort extends for 14 years. At the time of enrollment in 1971–1975, the study included 899 offspring of parents who had participated in the Framingham Heart Study and who had coronary heart disease; 2,656 offspring of spouse pairs, both of whom had participated in the Framingham Heart Study (parents who did or did not develop coronary heart disease); and 1,580 spouses of the offspring included in the study (23). Of 4,747 persons aged 22 or more years at examination 1 (or aged 30 or more years at examination 2), 213 died and 942 were lost to follow-up before the second examination. A total of 314 persons present at the second examination were excluded from our study because of missing data, not having fasted, or having developed cancer prior to examination 2 or during the first 3 years after the second examination.
Independent variables
Serum iron.
Information on serum iron, a well-established marker of body iron stores that may be useful as a measure of predisposition to iron overload, is available from the Framingham Offspring Study. Serum iron was measured by a reference laboratory, currently named Quest Diagnostics (Teterboro, New Jersey), as part of a chemistry profile. Serum iron was the only iron marker available. According to norms for iron levels in the general population, a serum iron level of 150 μg/dl is considered high (24). Serum iron was stratified as either less than 150 μg/dl or 150 or more μg/dl.
Lipids.
There are no established levels of risk for lipids with regard to the development of cancer. Consequently, lipids were stratified by tertiles to explore the interaction between lipids and iron across a range of lipid levels. Everyone included in the cohort had fasted for 12 or more hours before his or her blood was drawn. Plasma total cholesterol and cholesterol fractions were measured using the Abell-Kendall technique (25).
High density lipoprotein cholesterol.
High density lipoprotein cholesterol (HDL-C) was determined after precipitation of LDLs and VLDLs with heparin–manganese chloride according to the Lipid Research Clinics Program protocol (26). HDL-C was stratified by tertiles (<41 mg/dl, 41–<53 mg/dl, and ≥53 mg/dl).
Low density lipoprotein cholesterol.
Low density lipoprotein cholesterol (LDL-C) was calculated by subtracting HDL-C from the bottom fraction cholesterol (measured after reconstitution of the bottom fraction) (26, 27). LDL-C was stratified by tertiles: (<116 mg/dl, 116–<145 mg/dl, and ≥145 mg/dl).
Very low density lipoprotein cholesterol.
Very low density lipoprotein cholesterol (VLDL-C) was determined by subtracting the bottom fraction cholesterol from total cholesterol (26). VLDL-C was stratified by tertiles (<16 mg/dl, 16–<27 mg/dl, and ≥27 mg/dl).
Dependent variable or outcome—cancer events
The basis of a cancer diagnosis was 1) microscopically confirmed, 2) clinically diagnosed, or 3) indicated on death certificate only. The diagnosis date of a tumor or cancer was taken from pathology reports if available. The diagnosis date was from other records if the pathology report was unavailable or if the diagnosis was before biopsy. Nonmelanoma skin cancer was not classified as a cancer event.
Control variables
The independent relation of elevated iron and cholesterol on cancer events was examined by controlling for potential confounders. Demographic control variables that were available in the Framingham Offspring Study included age and gender. Age was used as a continuous variable. Body mass index and current smoking at baseline were included as additional controls, because of their association with cancer risk. Body mass index was calculated from measured height and weight information, with values of 30 kg/m2 or above defining obesity.
As with any cohort study, there is always the potential for confounding. One main source of confounding can be due to undetected cancer at baseline. To address this issue, we excluded (left censored) persons who developed cancer during the first 3 years after the second examination (our baseline), as well as persons who developed cancer before the second examination.
Data analysis
The population was classified into six groups on the bases of low and high serum iron and tertiles of each lipid. For survival analyses, we used a SAS statistical package (SAS Institute, Inc., Cary, North Carolina). Unadjusted survival analyses were computed for each of the biomarkers in separate analyses, as well as together as main effects. Further, the six group variables combining iron and lipids were computed in analyses. A Kaplan-Meier curve was created to graphically show the unadjusted relation between cancer events and low and high serum iron and low and high VLDL-C levels. Cox proportional hazards models were created with time to development of cancer for serum iron and VLDL-C independently controlling for age, gender, smoking status, and body mass index. Adjusted Cox proportional hazards models were also computed for iron–LDL-C and iron–HDL-C combinations. Preclinical cancer may create a bias by affecting levels of lipids. Thus, in these models, cancer-free survival time was a continuous variable measured in 1-day increments up to 5,114 days (14 years) from the baseline after left censoring the outcome of cancer events for the first 3 years of the cohort. The Schoenfeld test of residuals was computed to confirm the proportionality of hazards assumption within the models (28). Person-years of follow-up were calculated by subtracting the first 1,096 days (3 years) from the cancer-free survival time of each person and then summed for all persons in each group. If a person's cancer-free survival time was less than 1,096 days, his or her person-years of follow-up were set to zero. Cancer incidence per 1,000 person-years of follow-up was calculated by dividing the number of cancer cases by the total number of person-years and multiplying by 1,000.
RESULTS
Table 1 shows the baseline characteristics of the persons in the cohort. All participants were 30 or more years of age, and the incidence of cancer in the cohort was 6.0 per 1,000 person-years of follow-up. There was a high percentage of smokers in the cohort, 38.8 percent; however, this is comparable with the national estimate of adult smoking prevalence in 1974 of 37.1 percent (29). Pearson's correlations among serum iron, lipids, age, and body mass index are shown in table 2. The largest correlation coefficient obtained was for HDL-C and VLDL-C (r = −0.40).
Characteristics of adults aged 30 or more years in the cohort of 3,278 persons, Framingham Offspring Study, 1971–1999
Cancer incidence per 1,000 person-years | 6.0 |
| Age group (%) | |
| 30–39 years | 31.2 |
| 40–49 years | 33.6 |
| 50–59 years | 28.8 |
| 60–67 years | 5.6 |
| >67 years | 0.7 |
| Sex (%) | |
| Male | 48.7 |
| Female | 51.3 |
| Smoking now (%) | |
| Yes | 38.8 |
| No | 61.2 |
| Body mass index (%) | |
| <30 kg/m2 | 84.9 |
| ≥30 kg/m2 | 15.1 |
| Serum iron (μg/dl) (mean (SD*)) | 109 (35) |
| LDL-C* (mg/dl) (mean (SD)) | 132 (35) |
| HDL-C* (mg/dl) (mean (SD)) | 48 (14) |
| VLDL-C* (mg/dl) (mean (SD)) | 24 (17) |
| Age (years) (mean (SD)) | 45 (9) |
| Body mass index (kg/m2) (mean (SD)) | 26 (4) |
SD, standard deviation; LDL-C, low density lipoprotein cholesterol; HDL-C, high density lipoprotein cholesterol; VLDL-C, very low density lipoprotein cholesterol.
Correlations among iron, lipids, age, and body mass index, Framingham Offspring Study, 1971–1999
Pearson's correlation coefficients (r) | |||||||||||
|---|---|---|---|---|---|---|---|---|---|---|---|
| Serum iron (μg/dl) | LDL-C* (mg/dl) | HDL-C* (mg/dl) | VLDL-C* (mg/dl) | Age (years) | Body mass index (kg/m2) | ||||||
| Serum iron | 1.00 | −0.01 (0.48)† | 0.02 (0.16) | 0.12 (<0.01) | −0.05 (<0.01) | −0.04 (0.01) | |||||
| LDL-C | 1.00 | −0.17 (<0.01) | 0.12 (<0.01) | 0.28 (<0.01) | 0.16 (<0.01) | ||||||
| HDL-C | 1.00 | −0.40 (<0.01) | −0.01 (0.65) | −0.34 (<0.01) | |||||||
| VLDL-C | 1.00 | 0.18 (<0.01) | 0.28 (<0.01) | ||||||||
| Age | 1.00 | 0.14 (<0.01) | |||||||||
| Body mass index | 1.00 | ||||||||||
LDL-C, low density lipoprotein cholesterol; HDL-C, high density lipoprotein cholesterol; VLDL-C, very low density lipoprotein cholesterol.
Numbers in parentheses, significance (p value).
Table 3 indicates that the independent relation of serum iron and risk of cancer was not significant in an unadjusted model. In an adjusted model, elevated serum iron had a significant hazard ratio for development of cancer. VLDL-C had a significant independent relation in both unadjusted and adjusted models. When serum iron and LDL-C were included as separate main effects in an adjusted model, serum iron was significant, but LDL-C was not (not shown). Similarly, serum iron was significant and HDL-C was not when these two variables were entered as separate main effects in an adjusted model. In contrast, both serum iron (hazard ratio (HR) = 1.61, 95 percent confidence interval (CI): 1.08, 2.41) and VLDL-C (HR = 1.50, 95 percent CI: 1.01, 2.23) were significant when both were included as separate variables in an adjusted model.
Unadjusted and adjusted Cox regression using serum iron and lipid markers individually to predict time to the occurrence of cancer, Framingham Offspring Study, 1971–1999†
Unadjusted Cox regression | Adjusted Cox regression | No. of cases | No. of person-years | No. of persons | |||||
|---|---|---|---|---|---|---|---|---|---|
| HR‡ | 95% CI‡ | HR | 95% CI | ||||||
| Serum iron (μg/dl) | |||||||||
| <150 | 1.00 | 1.00 | 174 | 30,292 | 2,922 | ||||
| ≥150 | 1.41 | 0.95, 2.09 | 1.66* | 1.11, 2.46* | 29 | 3,585 | 356 | ||
| LDL-C‡ (mg/dl) | |||||||||
| <116 | 1.00 | 1.00 | 52 | 11,205 | 1,075 | ||||
| 116–<145 | 1.37 | 0.96, 1.96 | 0.96 | 0.67, 1.38 | 73 | 11,462 | 1,111 | ||
| ≥145 | 1.50* | 1.06, 2.13* | 0.84 | 0.58, 1.20 | 78 | 11,208 | 1,092 | ||
| HDL-C‡ (mg/dl) | |||||||||
| ≥53 | 1.00 | 1.00 | 57 | 11,499 | 1,097 | ||||
| 41–<53 | 1.24 | 0.88, 1.75 | 1.22 | 0.85, 1.74 | 74 | 12,063 | 1,168 | ||
| <41 | 1.41 | 0.99, 2.00 | 1.18 | 0.80, 1.73 | 72 | 10,314 | 1,013 | ||
| VLDL-C‡ (mg/dl) | |||||||||
| <16 | 1.00 | 1.00 | 38 | 11,245 | 1,058 | ||||
| 16–<27 | 1.84* | 1.24, 2.72* | 1.36 | 0.92, 2.03 | 72 | 11,613 | 1,129 | ||
| ≥27 | 2.50* | 1.71, 3.65* | 1.54 | 1.04, 2.28 | 93 | 11,018 | 1,091 | ||
Significant at p < 0.05.
Adjusted for sex, age, body mass index, and smoking status.
HR, hazard ratio; CI, confidence interval; LDL-C, low density lipoprotein cholesterol; HDL-C, high density lipoprotein cholesterol; VLDL-C, very low density lipoprotein cholesterol.
The combination of high serum iron and high VLDL-C was, in unadjusted relations, predictive of cancer events. The Kaplan-Meier curve representing this relation is presented in figure 1. The results presented in table 4 are adjusted for age, sex, smoking status, and body mass index, and they indicate that only when elevated iron is present is there a significant relation between lipids and the development of cancer. Elevated VLDL-C and low HDL-C show specific risks for cancer in combination with high iron levels. The interaction of LDL-C and iron was opposite to what would have been hypothesized. Although low LDL-C and high iron yield a relation, it seems to be an artifact of HDL-C. When analyses were restricted to those with HDL-C greater than or equal to 41 mg/dl, the group with serum iron of 150 μg/dl or more and LDL-C of less than 116 mg/dl was no longer significant (HR = 1.53, 95 percent CI: 0.64, 3.70; p = 0.34), whereas the group with serum iron of 150 μg/dl or more and VLDL-C of 27 mg/dl or more was still significant (HR = 2.51, 95 percent CI: 1.13, 5.56; p = 0.02).
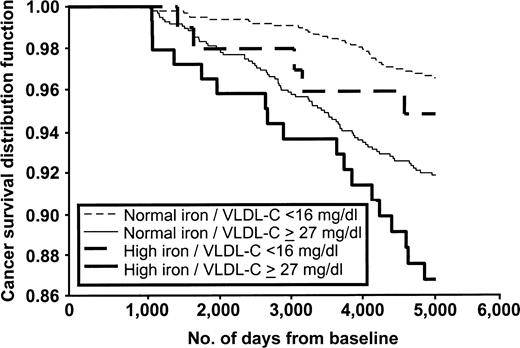
Kaplan-Meier survival distribution functions for combinations of serum iron and very low density lipoprotein cholesterol (VLDL-C), Framingham Offspring Study, 1971–1999.
Adjusted Cox regression using serum iron and lipid markers to predict time to the occurrence of cancer, Framingham Offspring Study, 1971–1999†
HR‡ | 95% CI‡ | No. of cases | No. of person-years | No. of persons | |
|---|---|---|---|---|---|
| Serum iron (μg/dl)/LDL-C‡ (mg/dl) | |||||
| <150/<116 | 1.00 | 41 | 9,952 | 950 | |
| <150/116–<145 | 1.06 | 0.71, 1.57 | 65 | 10,215 | 989 |
| <150/≥145 | 0.90 | 0.61, 1.34 | 68 | 10,125 | 983 |
| ≥150/<116 | 2.28* | 1.17, 4.45* | 11 | 1,254 | 125 |
| ≥150/116–<145 | 1.39 | 0.65, 2.97 | 8 | 1,247 | 122 |
| ≥150/≥145 | 1.37 | 0.68, 2.75 | 10 | 1,084 | 109 |
| Serum iron (μg/dl)/HDL-C‡ (mg/dl) | |||||
| <150/≥53 | 1.00 | 52 | 10,185 | 972 | |
| <150/41–<53 | 1.18 | 0.81, 1.73 | 64 | 10,733 | 1,036 |
| <150/<41 | 1.05 | 0.69, 1.58 | 58 | 9,373 | 914 |
| ≥150/≥53 | 0.98 | 0.39, 2.46 | 5 | 1,314 | 125 |
| ≥150/41–<53 | 1.64 | 0.82, 3.28 | 10 | 1,330 | 132 |
| ≥150/<41 | 2.82* | 1.50, 5.28* | 14 | 941 | 99 |
| Serum iron (μg/dl)/VLDL-C‡ (mg/dl) | |||||
| <150/<16 | 1.00 | 33 | 10,231 | 960 | |
| <150/16–<27 | 1.43 | 0.94, 2.18 | 66 | 10,444 | 1,016 |
| <150/≥27 | 1.49 | 0.98, 2.28 | 75 | 9,617 | 946 |
| ≥150/<16 | 1.84 | 0.72, 4.73 | 5 | 1,014 | 98 |
| ≥150/16–<27 | 1.66 | 0.69, 3.99 | 6 | 1,169 | 113 |
| ≥150/≥27 | 2.68* | 1.49, 4.83* | 18 | 1,401 | 145 |
Significant at p < 0.05.
Adjusted for sex, age, body mass index, and smoking status.
HR, hazard ratio; CI, confidence interval; LDL-C, low density lipoprotein cholesterol; HDL-C, high density lipoprotein cholesterol; VLDL-C, very low density lipoprotein cholesterol.
Table 5 lists the types of cancer observed in the three groups defined by serum iron level, HDL-C, and VLDL-C. The hypothesized low-risk comparison group includes those with serum iron of less than 150 μg/dl and either HDL-C of 53 mg/dl or more or VLDL-C of less than 16 mg/dl. The at-risk group defined in table 4 includes those with serum iron of 150 μg/dl or more and either HDL-C of less than 41 mg/dl or VLDL-C of 27 mg/dl or more. The at-risk group has an overall cancer incidence of 13.0 per 1,000 person-years of follow-up. Trachea, bronchus, and lung cancer are more common in the at-risk group (36 percent of all cancers) than in the comparison group (8 percent of all cancers).
Types of cancer in control, intermediate, and at-risk groups defined using serum iron, high density lipoprotein cholesterol, and very low density lipoprotein cholesterol, Framingham Offspring Study, 1971–1999
Serum iron (<150 μg/dl) and HDL-C* (≥53 mg/dl) or serum iron (<150 μg/dl) and VLDL-C* (<16 mg/dl) | Intermediate categories | Serum iron (≥150 μg/dl) and HDL-C (<41 mg/dl) or serum iron (≥150 μg/dl) and VLDL-C (≥27 mg/dl) | |
|---|---|---|---|
| No. of cases | 65 | 116 | 22 |
| No. of person-years | 15,080 | 17,107 | 1,689 |
| No. of persons | 1,432 | 1,671 | 175 |
| Cancer incidence per 1,000 person-years | 4.3 | 6.8 | 13.0 |
| Types of cancer (%) | |||
| Colon, rectum, rectosigmoid junction, anal canal and anus, not otherwise specified | 14 (9)† | 10 (12) | 18 (4) |
| Trachea, bronchus, and lung | 8 (5) | 19 (22) | 36 (8) |
| Female breast (excludes skin of breast) | 31 (20) | 15 (17) | 5 (1) |
| Prostate gland | 6 (4) | 20 (23) | 18 (4) |
| Other primary sites | 42 (27)‡ | 36 (42)§ | 23 (5)¶ |
HDL-C, high density lipoprotein cholesterol; VLDL-C, very low density lipoprotein cholesterol.
Numbers in parentheses, number by type of cancer.
Liver and intrahepatic bile ducts (n = 1), gallbladder and extrahepatic bile ducts (n = 1), pancreas (n = 2), larynx (n = 1), hematopoietic and reticuloendothelial systems (n = 3), corpus uteri or endometrium (n = 3), ovary, fallopian tube, and broad ligament (n = 2), urinary bladder (n = 3), kidney and other urinary organs (n = 2), eye and lacrimal gland (n = 2), thyroid gland (n = 1), lymph nodes (n = 1), unknown primary site (n = 1), and melanotic skin cancers only (n = 4).
Nasopharynx (n = 1), hypopharynx (n = 1), stomach (n = 5), pancreas (n = 4), hematopoietic and reticuloendothelial systems (n = 5), corpus uteri or endometrium (n = 2), ovary, fallopian tube, and broad ligament (n = 1), other and unspecified female genital organs (n = 1), urinary bladder (n = 6), kidney and other urinary organs (n = 4), brain (n = 3), lymph nodes (n = 2), unknown primary site (n = 1), and melanotic skin cancers only (n = 6).
Larynx (n = 1), cervix uteri (n = 1), kidney and other urinary organs (n = 1), and melanotic skin cancers only (n = 2).
DISCUSSION
This study demonstrated in a cohort that persons with elevations of both serum iron and VLDL-C were at an increased risk for the development of cancer. Moreover, elevations of serum iron and low HDL-C also carried an increased risk for cancer. Although the risk of cancer was increased by having either high iron or high VLDL-C levels, the adjusted relative risk of cancer was substantially increased when both factors were elevated. This finding demonstrates on a population level an interaction between iron and lipids in the development of cancer and suggests some support for the concept of iron-induced oxidative stress and carcinogenesis (30).
VLDL-C has been suggested as a substrate for free radical reactions (31, 32). In fact, VLDL-C has been found to be oxidized at twice the rate of LDL-C, suggesting that the oxidation of VLDL-C may play a larger role than oxidized LDL-C in the development of heart disease (32). Moreover, higher concentrations of plasma HDL-C seem to inhibit lipid peroxidation (11, 12). Thus, the combination of these lipid markers with iron and the concomitant risk for developing cancer seem to support the hypothesis of oxidative stress and cancer. Our finding of an interaction between LDL-C and iron with the development of cancer in a direction opposite to that of our hypothesis and that of VLDL-C may be just a chance event. Moreover, once HDL-C was accounted for in the relation between LDL-C and iron with cancer, the relation was more in line with our hypothesis. Although LDL-C has previously been proposed as a prime factor in lipid peroxidation in conjunction with iron stores, particularly as it relates to atherosclerosis and cardiovascular disease, the present data suggest that it may not be as important a factor in cancer development (33, 34). The present data suggest that the protective effect of HDL may play a larger role.
The results of this study may also help to explain the conflicting results of previous studies regarding iron levels and cancer risk. Previous studies have suggested a weak positive association between iron levels and the risk of cancer with significant independent risk appearing only at very high levels (17, 18, 35, 36). Similarly, in observational studies on the association of the use of statin medications and the risk of cancer, some have found that statin use is associated with a decreased risk of cancer while others have shown no significant association (37, 38). These previous studies may have found small and inconsistent results mainly because they were focusing on an undifferentiated population with only one of the two factors (iron, lipids) being considered. Lipid peroxidation is a common product of iron-induced oxidation and may be expected to occur at the highest rate when both cofactors are readily available.
Limitations of the study include the use of a one-time baseline laboratory value to assess iron and cholesterol. However, elevated iron levels are likely to remain elevated unless there are major dietary changes, since the propensity to overabsorb iron has a substantial genetic component (39). Although we were limited to only one marker of iron and other iron markers (e.g., transferrin saturation, ferritin) may have different benefits, using nonspecific predictors of oxidative stress may only serve to minimize the effect size observed in this study. A second limitation of this study is that, although it is a longitudinal cohort design and can demonstrate interactions between variables, it cannot assess causality. Third, the use of statin drugs was not accounted for in this study. Statin drugs were not available in practice for treatment at the time of the baseline examination. Although statin use may have caused some persons in the high VLDL–high iron group to become members of the low VLDL–high iron group, this would only bias the effect toward the null, thereby providing even more confidence in the veracity of the effect. Fourth, although this cohort had more than 3,200 persons at baseline, the number of persons who developed cancer during the study, particularly in the investigated groups, was relatively small. Consequently, even though significant relations were found, with these relatively small cell sizes some caution in interpretation may be warranted.
The strengths of this study include the large sample size and the long length of follow-up. Furthermore, the use of control variables should have decreased the potential for confounding, and the rigorous methodology used by the Framingham Offspring Study increases the study's validity.
In summary, elevated serum iron levels coupled with either high VLDL-C or low HDL-C appear to interact to increase cancer risk in this cohort. These findings support the hypothesis that iron-mediated oxidation of cholesterol increases oxidative stress, which can lead to cancer formation. If this finding can be replicated in other studies, this would suggest the need for interventional studies to reduce iron and/or lipid levels in persons with dual elevations in these substances as a strategy to decrease cancer risk.
Supported in part by grants from the National Institute on Aging (1 P30 AG21677), the Health Resources and Services Administration (8 D54 HP 00023-04 and 1 D14 HP 00161-01), and the Delaware Division of Public Health.
References
Halliwell B. Effect of diet on cancer development: is oxidative DNA damage a biomarker?
Mates JM, Sanchez-Jimenez FM. Role of reactive oxygen species in apoptosis: implications for cancer therapy.
Poulsen HE, Prieme H, Loft S. Role of oxidative DNA damage in cancer initiation and promotion.
Hristozov D, Gadjeva V, Vlaykova T, et al. Evaluation of oxidative stress in patients with cancer.
Smith C, Mitchinson MJ, Aruoma OI, et al. Stimulation of lipid peroxidation and hydroxyl-radical generation by contents of human atherosclerotic lesions.
Heinecke JW, Rosen H, Chait A. Iron and copper promote modification of low density lipoprotein by human arterial smooth muscle cells in culture.
Ferretti G, Bacchetti T, Bicchiega V, et al. Effect of human Apo AIV against lipid peroxidation of very low density lipoproteins.
Hirofumi A, Kashiwagi S, Nagasaka Y, et al. Oxidative modification of apolipoprotein E in human very-low-density lipoprotein and its inhibition by glycosaminoglycans.
Mackness MI, Arrol S, Abbott C, et al. Protection of low-density lipoprotein against oxidative modification by high-denisty lipoprotein associated paraoxonase.
Mackness MI, Arrol S, Durrington PN. Paraoxonase prevents accumulation of lipoperoxides in low-denisty lipoprotein.
Mackness MI, Durrington PN. HDL, its enzymes and its potential to influence lipid perxoidation.
Parthasarathy S, Barnett J, Fong LG. High-density lipoprotein inhibits the oxidative modification of low-density lipoprotein.
Glei M, Latunde-Dada GO, Klinder A, et al. Iron-overload induces oxidative DNA damage in the human colon carcinoma cell line HT29 clone 19A.
Halliwell B, Gutteridge JM. Role of free radicals and catalytic metal ions in human disease: an overview.
Fischer JG, Glauert HP, Yin T, et al. Moderate iron overload enhances lipid peroxidation in livers of rats, but does not affect NF-κB activation induced by the peroxisome proliferator, Wy-14,643.
Johnson S. The possible crucial role of iron accumulation combined with low tryptophan, zinc and manganese in carcinogenesis.
Knekt P, Reunanen A, Takkunen H, et al. Body iron stores and risk of cancer.
Stevens RG, Graubard BI, Micozzi MS, et al. Moderate elevation of body iron level and increased risk of cancer occurrence and death.
Rywik SL, Manolio TA, Pajak A, et al. Association of lipids and lipoprotein level with total mortality and mortality caused by cardiovascular and cancer diseases (Poland and United States collaborative study on cardiovascular epidemiology).
Baptiste MS, Nasca PC, Doyle JT, et al. Cholesterol and cancer in a population of male civil services workers.
Sharp SJ, Pocock SJ. Time trends in serum cholesterol before cancer death.
Eicholzer M, Stahelin HB, Gutzwiller F, et al. Association of low plasma cholesterol with mortality for cancer at various sites in men: 17-y follow-up of the prospective Basel study.
Kannel WB, Feinleib M, McNamara PM, et al. An investigation of coronary heart disease in families. The Framingham Offspring Study.
Adamson JW. Iron deficiency and other hypoproliferative anemias. In: Kasper DL, Braunwald E, Fauci AS, et al, eds. Harrison's principles of internal medicine. 16th ed. Part 5, sect 2, chap 90. New York, NY: The McGraw-Hill Companies, Inc,
Abell LL, Levy BB, Brodie BB, et al. A simplified method for the estimation of total cholesterol in serum and demonstration of its specificity.
Lipid Research Clinics Program. Manual of laboratory operations. Vol 1. Lipid and lipoprotein analysis. Washington, DC: US Government Printing Office,
Anderson KM, Wilson PW, Garrison RJ, et al. Longitudinal and secular trends in lipoprotein cholesterol measurements in a general population sample. The Framingham Offspring Study.
National Center for Chronic Disease Prevention and Health Promotion. Smoking prevalence among U.S. adults, fact sheet, July
Toyokuni S. Oxidative stress and cancer: the role of redox regulation.
Hodis HN, Mack WJ. Triglyceride-rich lipoproteins and progression of atherosclerosis.
Mohr D, Stocker R. Radical-mediated oxidation of isolated human very-low-density lipoprotein.
Wells BJ, Mainous AG 3rd, King DE, et al. The combined effect of transferrin saturation and low density lipoprotein on mortality.
Berliner JA, Navab M, Fogelman AM, et al. Atherosclerosis: basic mechanisms. Oxidation, inflammation, and genetics.
Stevens RG, Jones DY, Micozzi MS, et al. Body iron stores and the risk of cancer.
Wu T, Sempos CT, Freudenheim JL, et al. Serum iron, copper and zinc concentrations and risk of cancer mortality in US adults.
Graaf MR, Beiderbeck AB, Egberts AC, et al. The risk of cancer in users of statins.
Kaye JA, Jick H. Statin use and cancer risk in the General Practice Research Database.

