

Abstract
Background/Aim: Radiotherapy (RT) induces late changes in all cardiac structures. Most studies of early changes focus on individual parameters. Patients and Methods: Data from eighty early-stage breast cancer patients at baseline, post-RT and three-year follow-up visit were assessed prospectively. Changes in ten cardiac parameters were collected including electrocardiogram (ECG), echocardiography, and biomarkers. A percentage of abnormal changes was calculated. Results: The mean heart radiation dose (Dmean) was independently associated with the increased incidence of changes post-RT (β=0.403, p<0.001) and at the three-year follow-up (β=0.353, p=0.001). Each 1-Gray increase in Dmean increased the cardiac changes by 3.7% (95%CI=1.9-5.6%) after RT and 3.1% (95%CI=1.3, 4.9%) at the three-year follow-up. Conclusion: A higher cardiac radiation dose was independently associated with a higher incidence of changes in cardiac parameters. Multiparameter changes imply that the early phase after RT is already characterized by several overlapping cardiac changes.
- Breast cancer
- radiotherapy
- cardiac biomarkers
- ECG
- echocardiography
Radiotherapy (RT) is an essential part of cancer therapy for approximately half of patients (1, 2). Adverse effects on healthy tissue are the major limiting factor, and they are actively reduced by advances in treatment planning and protective shielding (2). Despite the use of protective measures, cardiac exposure is unavoidable in chest RT due to RT field proximity and radiation scattering. As radiation can affect all layers of cardiac tissue, overlap of multiple pathologies is common (3-6). Taking this into account, one would expect to find multiple cardiac changes even in the early phase after RT.
We have previously reported changes in cardiac biomarkers, electrocardiogram (ECG), and echocardiography after breast cancer RT (7-15). Even though the changes are evident after RT, an independent dose-dependent association has rarely been reported. The aims of this study were to examine whether a multiparameter approach combining these findings would have closer association with radiation dose, and to create a more holistic understanding of the heart following early-stage breast cancer RT. Furthermore, our aims were to clarify which of these parameters had the closest association with RT cardiac doses and to further clarify the development of these changes during the first three years after RT.
Patients and Methods
Patient selection. Patient recruitment for this single-center three-year prospective observational study started in June 2011 and the three-year follow-up ended in June 2016. Eighty patients were recruited: twenty patients with right-sided breast cancer and sixty patients with left-sided breast cancer. Patients were treated with adjuvant RT only, as there was no need for chemotherapy due to their tumor characteristics. The inclusion and exclusion criteria have been published previously. Briefly, eligible female patients between 18 and 80 years old with early-stage breast cancer were recruited unless they had other malignancies, severe lung disease or significant heart disease (11). The study complied with the Helsinki Declaration, and the local ethics committee approved the protocol. All participants signed an informed consent form before enrollment.
Cardiac variables. A total of 10 biochemical, ECG and echocardiographic parameters were included in this multiparameter analysis. More detailed information on the measurements can be found in our previous publications (7-15). All parameters were handled as binomial, that is, either they displayed or not a change after RT (Early) or at three-year follow-up (Late). The included parameters and the criteria to be defined as changed are shown in Table I.
Cardiac variables used for the analysis in this study.
Threshold definition. The threshold for global longitudinal strain (GLS) change was chosen based on a clinically significant relative decline by 15%, and a global e under one 1/s as this threshold has been published as being clinically significant (16, 17). For troponin T (Tn) we used a 30% increase from baseline to post-RT control, as this was used in our previous publication and there was only one patient with a Tn increase above the threshold level in the early phase (8). However, a value above the reference level was chosen as the threshold in the follow-up thereafter, and elevated pro-B-natriuretic peptide (proBNP) above the clinical reference level was used in both the Early and Late phases. Furthermore, a clear and distinct change in an ECG feature was chosen to represent a change after RT, namely a novel T-wave inversion after baseline ECG (13). For tricuspid annular plane systolic excursion (TAPSE), such a change was a more than 4 mm decrease from baseline (9). However, for parameters such as integrated backscatter (IBS), cyclic variation of integrated backscatter (CVIBS), and ST2, there are no commonly used thresholds, and a worsening from baseline was used instead. Likewise, a minimum of worsening by one diastolic grade was used to define a change in diastology.
Combination of parameters. For each individual, a percentage of abnormal changes was calculated in the ten parameters early after RT (Earlycombination) and at the three-year follow-up (Latecombination). As some of the parameters clearly peaked in the early phase, while others peaked in the late phase, a Bestcombination was developed using the best combination of the early and late peaking parameters. Bestcombination included ECG and IBS in the early phase and Tn, proBNP, global e, CVIBS, and ST2 in the late phase. GLS15, TAPSE and diastolic grade were left out of Bestcombination as they did not seem to contribute to the overall results in either phase.
Statistics. The data are presented as the means with standard deviations (SD) for variables with normal distributions, as medians with quartiles for nonnormally distributed variables and as numbers with percentages for categorical variables. The chi-square test or Fisher’s test was used for categorical associations of the cardiac variables with a mean heart dose (Dmean) >2 Gy and maximal heart dose (Dmax) >40 Gy. Receiver operator curve (ROC) analysis was used to test categorical cardiac parameters with Dmean and Dmax. In the ROC curves, the true positives are plotted against the false positives for different cutoff points of the Early, Late and Best combinations using the cutoff value of 2 Gy for Dmean and the cutoff value of 40 Gy for Dmax. An independent T test was used to test the differences in Dmean and Dmax for those parameters with significant area under the curves (AUC). A multivariable analysis was performed using stepwise linear regression analysis. The included covariates were the Dmean, age at inclusion, no other concurrent disease, smoking status, hypertension, and use of aromatase inhibitor. All p-values are two-sided and a p-value <0.05 was considered indicative of statistical significance. The analysis was performed with IBM SPSS Statistics Version 25.
Results
The general characteristics of the study population are shown in Table II. All patients completed the three-year follow-up. There were seven hospitalizations due to cardiac causes: three patients were hospitalized due to atrial fibrillation, one patient underwent catheter ablation of atrioventricular nodal reentrant tachycardia, one patient received a pacemaker due to second-degree Mobitz 2 AV nodal block, and two patients were hospitalized due to worsening of pre-existing coronary artery disease and aortic stenosis. There was no cancer recurrence or death during the follow-up period.
Baseline characteristics.
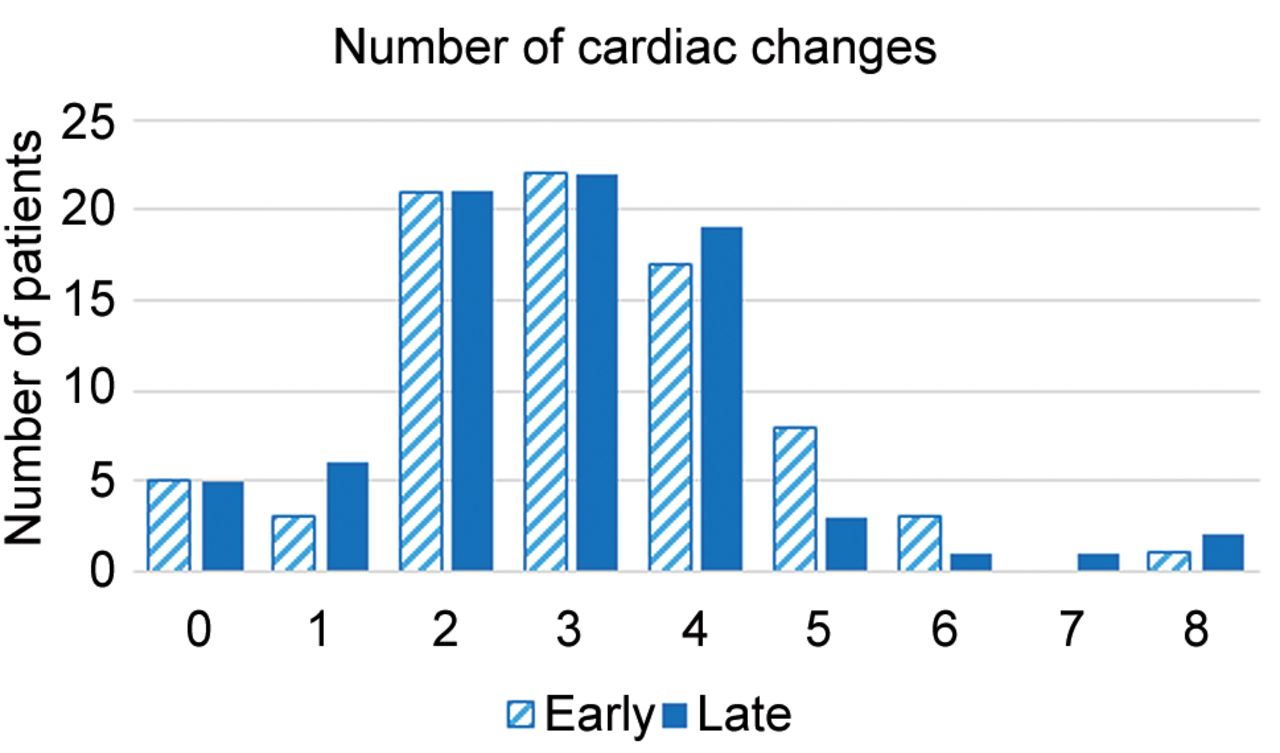
Changes in individual markers. The number of abnormal findings among the cardiac parameters for each patient is displayed in Figure 1. Missing values accounted for 5.9% and 3.8% of all parameters after RT and at the three-year follow-up, respectively. Missing values were most commonly observed for ST2 analysis accounting for 16% of the total data points, while there were no missing values among Tn, proBNP or diastolic grade values.

Number of cardiac changes at the Early and Late follow-ups. The distributions of early (dashed) and late (blue) changes are shown on the y-axis. The height of the columns indicates the number of patients with the respective number of changes.
The median [Q1, Q3] percentage of cardiac changes per patient was 30% [20, 40] at the post-RT control and 30% [20, 40] at the three-year follow-up. The distribution of the changes is illustrated in Figure 2. The results of chi-square analysis for each cardiac parameter and Dmean with a 2 Gy treshold is shown in Table III, and those for Dmax with a 40 Gy threshold are shown in Table IV. In addition, the ROC results for each individual cardiac parameter and Dmean and Dmax are shown in Table V. Considering the significant associations, there were differences between the parameters. IBS seemed to peak early, and global e and ST2 peaked late, while CVIBS, Tn, ECG, and proBNP were equally present in both early and late phase. In contrast, TAPSE, GLS15 and diastolic grade did not show significant associations at any follow-up visit.

Cardiac changes according to a 2 Gy mean heart dose (Dmean) illustrated as an Alluvian diagram. The top row represents changes after radiotherapy (Early), middle row shows changes at three-year follow-up (Late), and bottom row displays the best combination of changes (Best). The first column on the left represents Dmean: red color illustrates Dmean >2 Gy and blue color Dmean <2 Gy.
Chi-square analysis of the associations between individual cardiac parameters and Dmean with a 2 Gy threshold.
Chi-square analysis of the associations between individual cardiac parameters and Dmax with a 40 Gy threshold.
Area under the curve values for cardiac parameters in the early and late phases versus mean and max heart radiation doses.
CVIBS. The Dmean values of patients with and without CVIBS worsening were 2.4 [1.1, 3.9] Gy and 1.5 [0.6, 1.8] Gy (p=0.014) at the Early follow-up, and 2.2 [1.3, 3.9] Gy and 1.5 [0.6, 2.5] Gy (p=0.019) at the Late follow-up, respectively. Likewise, the Dmax values of patients with and without CVIBS worsening were 46.2 [14.6, 48.5] Gy and 43.4 [5.0, 46.3] Gy (p=0.216) at the Early follow-up and 46.4 [19.1, 48.5] and 41.3 [4.6, 46.0] (p=0.087) at the Late follow-up, respectively.
IBS. The Dmean values of patients with and without IBS worsening at the Early follow-up were 2.4 [1.4, 3.8] Gy and 1.4 [0.6, 2.3] Gy (p=0.022), respectively. The Dmax values of patients with and without IBS worsening at the Early follow-up were 46.4 [8.1, 48.4] Gy and 43.0 [4.8, 46.8] Gy (p=0.224), respectively.
ST2. The Dmean values of patients with and without an ST2 increase at the Late follow-up were 2.2 [1.4, 4.0] Gy and 1.8 [0.7, 3.2] Gy (p=0.162), respectively. The Dmax values of patients with and without an ST2 increase at the Late follow-up were 46.5 [29.4, 48.4] Gy and 44.2 [5.1, 46.6] Gy (p=0.087), respectively.
ECG. The Dmean values for those with and without a T-inversion at the Early follow-up were 3.5 Gy [2.2, 4.9] Gy, and 1.6 [0.6, 3.2] Gy (p<0.001), respectively. Likewise, the Dmax values for patients with and without T-wave inversion after RT were 47.3 [45.9, 49.0] Gy and 43.2 [5.0, 47.3] Gy (p<0.001), respectively. At the Late follow-up, the Dmean values of patients with and without a persistent T-wave inversion were 4.4 [3.4, 5.6] Gy and 2.0 [0.8, 3.5] Gy (p=0.005), respectively, while the Dmax values of patients with and without a persistent T-wave inversion were 48.2 [45.8, 51.3] Gy and 45.9 [7.9, 47.6] Gy (p=0.280), respectively.
Global e. The Dmean values of patients with and without a depressed global e were 4.4 [3.4, 5.6] Gy versus 2.0 [0.8, 3.5] Gy (p=0.018) at the Late follow-up, respectively. Likewise, the Dmax values of patients with and without a depressed Global e were 48.2 [45.8, 51.3] Gy and 45.9 [7.9, 47.6] Gy (p=0.014), respectively.
Tn. The Dmean values of those with and without a Tn change at the Early follow-up were 3.5 [2.1, 4.3] Gy and 1.9 [0.7, 3.5] Gy (p=0.025), respectively. Likewise, the Dmax values of patients with and without a Tn change at the Early follow-up were 47.2 [45.8, 49.2] Gy and 45.0 [6.1, 47.4] Gy (p=0.012), respectively. At the Late follow-up, the Dmean values of patients with and without a Tn change were 4.4 [3.4, 5.6] Gy and 2.0 [0.8, 3.5] Gy (p=0.002), respectively. The Dmax values at the Late follow-up of patients with and without a Tn change were 48.2 [45.8, 51.3] Gy and 45.9 [7.9, 47.6] Gy (p=0.038), respectively.
ProBNP. The Dmean values of those with and without abnormal proBNP at the Early follow-up were 4.2 [2.3, 5.0] Gy and 2.0 [0.8, 3.6] Gy (p=0.112), respectively. Likewise, the Dmax values of patients with and without abnormal proBNP after RT were 46.8 [45.8, 54.6] Gy and 45.9 [7.8, 48.1] Gy (p=0.002), respectively. At the Late follow-up, the Dmean values of patients with and without an abnormal proBNP value were 3.9 [2.8, 5.8] Gy and 2.0 [0.8, 3.6] Gy (p=0.018), respectively. The Dmax values of patients with and without an abnormal proBNP value were 46.7 [36.8, 52.3] Gy and 45.9 [7.7, 48.1] Gy (p=0.284), respectively.
Analysis of combined changes. The median [Q1, Q3] change in Earlycombination was 30.0% [20, 40], Latecombination 30.0% [20.0, 40.0], and Bestcombination 28.6% [14.3, 42.9]. The number of patients with no changes was 5 (6.3%), 5 (6.3%) and 7 (8.8%) for Earlycombination, Latecombination and Bestcombination, respectively. A change in at least half of the parameters was observed in 15 patients (18.8%) at the post-RT follow-up (Earlycombination), in eight patients (10%) at the three-year follow-up (Latecombination), and in 13 patients (16.3%) using the Bestcombination.
Figure 3 displays the ROC curves for Dmean with a 2 Gy threshold and Dmax with a 40 Gy threshold: the AUC values of Earlycombination were 0.749 [95%CI=0.731-0.917] (p<0.001) and 0.726 [95%CI=0.618-0.834] (p=0.001), respectively. Likewise, the AUC values of Dmean with a 2 Gy threshold and Dmax with a 40 Gy threshold for Latecombination were 0.711 [95%CI=0.579-0.824] (p=0.001) and 0.645 [95%CI=0.523-0.768] (p=0.038), respectively. Finally, the AUC values of Dmean with a 2 Gy threshold and Dmax with a 40 Gy threshold for Bestcombination were 0.824 [95%CI=0.731-0.917] (p<0.001) and 0.744 [95%CI=0.633-0.855] (p=0.001), respectively.
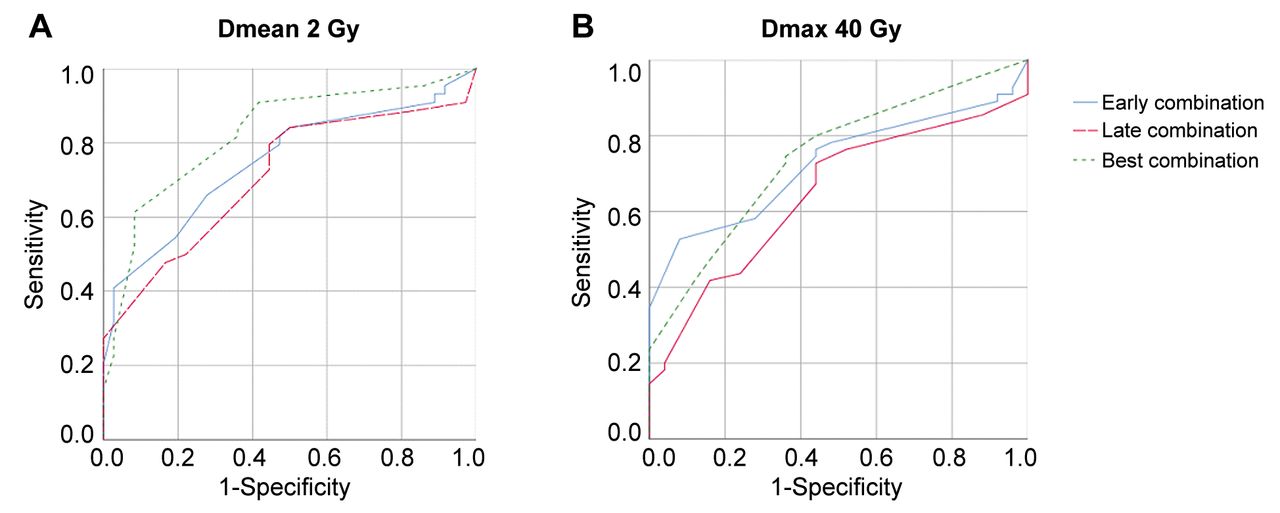
Receiver operator curve for mean heart dose over 2 Gy (A) and maximum heart dose over 40 Gy (B). (A) The best combination (dashed blue line) has the largest area under the curve 0.807 (p<0.001), while early combination (solid blue line) and late combination (dashed red line) have 0.760 (p<0.001) and 0.703 (p=0.002), respectively. (B) The best, early and late combinations have an area under the curve of 0.744 (p=0.001), 0.726 (p=0.001), and 0.645 (p=0.038), respectively.
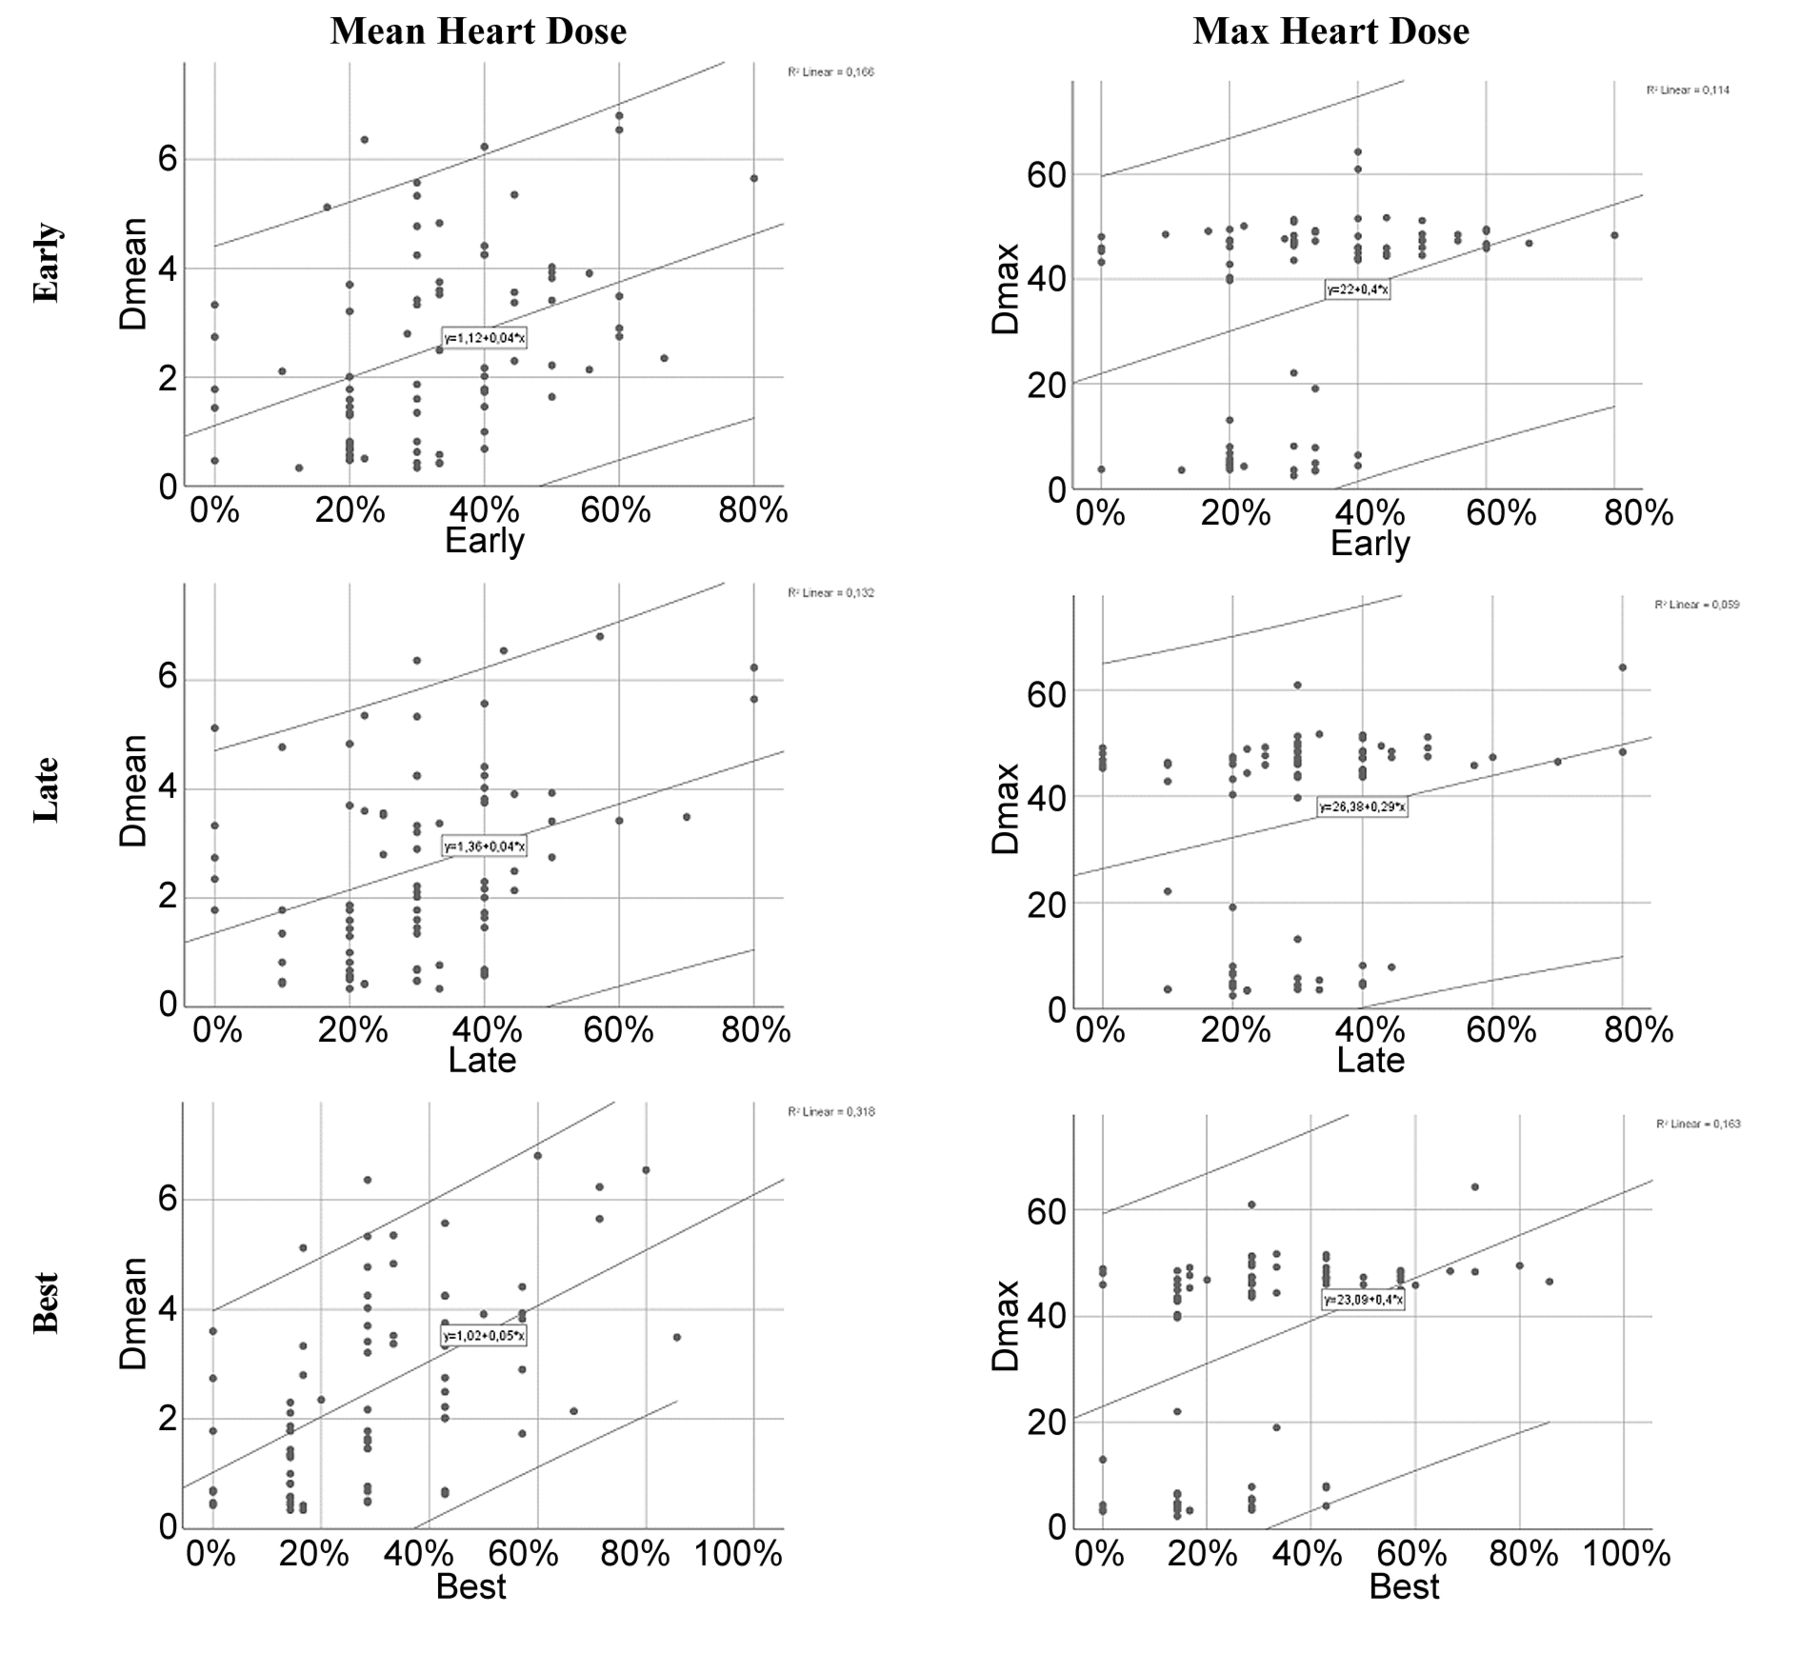
A scatter dot illustration of the associations of combination changes with Dmean and Dmax is shown in Figure 4 and a scatter dot illustration of the associations between combination changes and age is displayed in Figure 5. Multivariable analysis including Dmean, age at inclusion, no other concurrent disease, smoking status, hypertension, and use of aromatase inhibitors was performed. Independent associations of Dmean and age with all combinations were found. Dmean was independently associated with Earlycombination (β=0.403, p<0.001), Latecombination (β=0.353, p=0.001) and Bestcombination (β=0.558, p<0.001). Each 1-Gray increase in Dmean increased Earlycombination by 3.7% [95%CI=1.9, 5.6], Latecombination by 3.1% [95%CI=1.3-4.9] and Bestcombination by 5.9% [95%CI=4.0, 7.9].

Scatter dot plots: heart radiation doses and cardiac changes. The top row represents Earlycombination, the middle row Latecombination, and the bottom row Bestcombination. The mean heart dose is illustrated in the left column and the maximum heart dose is illustrated in the right column.

Scatter dot plots: age at the time of radiation therapy and cardiac changes. The top image is for Earlycombination, the middle image is for Latecombination, and the bottom image is for Bestcombination.
Higher age at the time of RT was also independently associated with all combinations: Earlycombination (β=0.294, p=0.004), Latecombination (β=0.230, p=0.029) and Bestcombination (β=0.216, p=0.020). Each 1-year increase in age at the time of RT increased the incidence of changes by 0.7% [95%CI=0.3-1.3] in Earlycombination, by 0.6% [95%CI=0.1-1.1] in Latecombination and by 0.6% [95%CI=0.1-1.2] in Bestcombination.
Discussion
This study shows that the early phase after chest RT is characterized by multiple simultaneous cardiac changes and that the combination of changes was independently associated with cardiac radiation doses. This is in line with the late clinical manifestation of multiple overlapping cardiac changes (6, 16).
Radiotherapy-induced adverse cardiac effects. RT initiates tissue changes via direct cellular damage and activation of radical oxygen species (18). The early phase occurs from minutes to days after radiation and is characterized by inflammatory tissue changes (19-21). The inflammatory phase triggers a complex cascade, which is not fully understood. The cascade includes endothelial damage, capillary thrombosis and perivascular fibrosis, and it leads to vascular changes and diffuse fibrosis in the long term (16, 18-20, 22). The early inflammatory phase is usually silent in the heart due to lower heart exposure with modern heart-sparing programs. Clinically overt manifestations usually appear with several years of latency and are caused by the slow accumulation of fibrotic and sclerotic cardiac changes. The clinical manifestations may include stenotic lesions in the small and large arteries, valvular lesions, myocardial fibrotic changes with the development of heart failure with preserved ejection fraction (HFpEF), constriction, arrythmia, and conduction problems (2, 6, 16). These manifestations often overlap and patients are prone to present with more than one cardiac manifestation (3, 16). Chest RT increases late mortality by 2 to 6-fold, and in some patient groups, late cardiac mortality exceeds cancer mortality (16, 23).
Multiparameter changes in this study. RT induces cardiac changes, which are initiated at the time of RT and develop slowly thereafter. As the late changes are multiple, overlapping late manifestations, one would suppose that the early manifestations would present the same pancardiac character. The aim of this study was to assess whether such manifestation with multiple changes would occur in the early phase. By combining ten variables shown to change after RT in our previous publications, a clear and independent association with RT dose was found. A higher Dmean and Dmax induced a higher frequency of cardiac changes in a dose-dependent manner. Using the best combination of parameters, each 1-Gy increase in Dmean induced a 5.9% (95%CI=4.0-7.9%) increase in changes in cardiac parameters. Although the relationship between the early subclinical changes and late clinically significant manifestations is a matter of debate, it is interesting that the magnitude of changes induced by each 1-Gy increase in Dmean is similar to late RT-induced clinical damage. Sardano et al. showed that each 1-Gy increase in Dmean increased the risk of late RT-induced heart disease by 4% (24). Likewise, in a study by Darby et al., each 1-Gy increase in Dmean increased the risk of ischemic coronary artery disease by 7.4% (25).
The clear dose-dependency revealed by a multiparameter approach in this study implies that a combination of parameters might indicate better overall cardiac exposure than individual parameters. It may be that individual susceptibility makes one patient more prone to present certain changes and another patient more likely to present other changes. A multiparameter approach overcomes such individual variation and might therefore be a more robust indicator of RT-induced cardiac effects.
Early radiotherapy-induced changes. Both Earlycombination and Latecombination were associated with Dmean and Dmax. However, there were differences in individual parameters that peaked in the early phase and at the three-year follow-ups, probably reflecting differences in the RT-induced tissue changes. As the early phase after RT is characterized by inflammatory tissue changes, such inflammatory changes might at least partially explain early-peaking cardiac changes such as T-wave inversion on ECG and increasing tissue density measured by IBS in this study. The exact mechanism of T-wave inversions is not well understood. In previous studies, an increase and subsequent decrease in myocardial IBS values have been observed in situations with tissue inflammatory changes such as allograft rejection, transient kidney dysfunction and changes seen in postmenopausal therapy (26-28). Therefore, tissue inflammatory changes may have caused an initial increase in IBS values.
Late radiotherapy-induced changes. There was no clear peak in the number of patients with changes in the individual parameters at the three-year follow-up, but rather a modest increase in changes in cardiac biomarkers and echocardiography measurements. A gradual increase in the frequency of cardiac changes complies with the slow development of RT-induced fibrotic changes. Parameters associated with radiation dose at the three-year follow-up might serve as surrogate markers of the slowly evolving fibrotic process, especially late peak global e. Similar changes after RT were discovered in a study by Sirtrahan et al. (29). Such diastolic changes might lead to impaired left ventricular filling and to HFpEF. In fact, Saiki et al. have reported increased risk of HFpEF as early as 5.8 years after RT (30).
Other considerations. Data from others and our previous publications show that GLS, TAPSE, and diastolic grade are worsened by chest RT (9, 11, 14, 15, 29, 31-33). However, in this study, these parameters performed worse than others with regard to the association with heart radiation doses. This might be due to the dichotomization of the parameter with a subsequent reduction in information. Furthermore, important regional data are not apparent managing data in this way.
Seven of our patients were hospitalized for cardiac reasons during the follow-up period. As the follow-up was only three years and given the variety of cardiac reasons for hospitalization, a causal link between RT and hospitalizations was considered unlikely.
Clinical implications. There are several clinical implications of our study. First, the results of this study imply that RT-induced cardiac changes initially resemble pancardiac nature, and use of a multiparameter approach might be a better way to reveal individual impacts. Second, this study clarifies which tools are most appropriate to detect early and late cardiac changes. This could help clinicians and scientists choose the most appropriate tool for screening in cases where a multiparameter approach is not practical. Third, our study might provide us with a better understanding of the changes in these cardiac parameters that present after RT. As tissue samples have shown early changes to be characterized by inflammatory changes and late changes to present accumulation of diffuse fibrosis and sclerotic changes, it may be concluded that early T-wave inversions and changes in IBS are associated with inflammatory tissue changes whereas global e might present an accumulation of myocardial fibrosis.
Overall, a multiparameter approach used to study radiotherapy-induced myocardial changes showed a close relationship with cardiac radiation doses and revealed a multichange nature of cardiac parameters even in the early phases after radiotherapy.
Limitations. The most important limitation of our study is the short follow-up time. As clinically significant cardiac adverse effects appear with several years of latency, it is unclear whether a multiparameter approach is a more valid way to predict late adverse events than an approach that considers changes in individual parameters. A longer follow-up of this patient population is ongoing to clarify this important aspect. Furthermore, the study population was rather small, but this was a result of balancing meticulous study protocols with a larger population size. In addition, for each cardiac parameter, a cutoff point was chosen. For several parameters a clear clinical cutoff was used, but for many parameters in research use only, there were no such cutoff values. For this reason, cutoff values were defined according to best judgement, but cutoff values other than those chosen here might have performed better or worse. Finally, with longer follow-up times, many patients may experience cardiac events unrelated to RT that influence cardiac parameters. Our analysis did not include such factors. However, in such cases a multiparameter approach might overcome such confounding factors better than single-parameter analysis.
Conclusion
A multiparameter approach to reveal early RT-induced cardiac changes is feasible and resembles pancardiac from early on. Cardiac radiation doses were independently associated with cardiac changes, with each 1-Gy of Dmean increasing cardiac changes by 3.7% post-RT and 3.1% at the three-year follow-up.
Acknowledgements
This study was supported by nonprofit trusts: Paavo and Eila Salonen Legacy, Aarne Koskelo Legacy, Georg and Ella Ehrnroot Trust and Competitive State Reseach Financing of the Expert Responsibility area of Tampere University Hospital. The Authors would also like to thank the research nurses Virpi Palomäki, Hanna-Leena Näppilä, Kati Helleharju and Katri Mikkonen for their expert assistance during the study.
Footnotes
Authors’ Contributions
All the Authors have contributed significantly to the concept design of this manuscript, and the work leading to the final manuscript. All Authors have reviewed the article and agreed with its content.
Conflicts of Interest
None of the Authors have any conflicts of interest to declare.
- Received January 21, 2022.
- Revision received March 6, 2022.
- Accepted March 18, 2022.
- Copyright © 2022 International Institute of Anticancer Research (Dr. George J. Delinasios), All rights reserved.
This article is an open access article distributed under the terms and conditions of the Creative Commons Attribution (CC BY-NC-ND) 4.0 international license (https://creativecommons.org/licenses/by-nc-nd/4.0).