

Abstract
Background/Aim: Interleukin 6 (IL6) is increased in patients with progressive prostate cancer and induces its transdifferentiation to neuroendocrine prostate cancer. Neuroendocrine prostate cancer has become one of the greatest challenges in treating castration-resistant disease and is linked to poor prognosis. It is necessary to understand better the cellular events associated with IL6-mediated neuroendocrine differentiation to prevent it and identify potential new therapeutic targets. Materials and Methods: In the present study, an IL6-inducible neuroendocrine differentiation model established specifically for this purpose was applied using LNCaP cells. Proteomics and western blot analyses were used to identify proteins involved in neuroendocrine differentiation. Subsequently, the role of gelsolin (GSN) in the neuroendocrine differentiation model was characterized (knock-down analyses, microscopic co-localization analyses, apoptosis assay) and GSN expression levels in patient material were investigated. Results: This study revealed that GSN is a crucial factor in the neuroendocrine differentiation process. Conclusion: It was shown that siRNA-mediated knock-down of GSN can inhibit neuroendocrine differentiation, making it a valid target for preventing IL6-mediated neuroendocrine differentiation.
- Prostate cancer
- neuroendocrine transdifferentiation
- gelsolin
- voltage-dependent anion channel-1
Neuroendocrine prostate cancer (NEPC) has become one of the greatest challenges in the treatment of castration-resistant prostate cancer (CRPC) and is a marker of poor prognosis (1, 2). NEPC is morphologically represented by small cell neuroendocrine-like cells. It displays increased expression of neuroendocrine markers such as synaptophysin (SYP), tubulin, beta 3 class III (TUBB3), tumour protein D52 isoform 1 (TPD52), and low levels of androgen receptor (AR) and AR target-gene expression (3, 4). In primary PC, 2% of cells represent NEPC, whereas the incidence of NEPC is up to 30% after androgen-deprivation therapy (1). Androgen-deprivation therapy has been reported to increase the cAMP level and subsequently activate the cAMP response element-binding protein pathway (5). cAMP response element-binding protein can induce neuroendocrine transdifferentiation (NETD) via several downstream factors, such as G-protein-coupled receptor kinase 3 (5). In addition to cAMP, other factors such as neuromediators (e.g. calcitonin and serotonin) and pro-inflammatory cytokines [e.g. interleukin (IL)1β and IL6] can induce NETD (6, 7).
IL6 is elevated in the serum of patients with CRPC and plays an essential role in PC progression and therapy resistance by modulating tumour growth, apoptosis, and differentiation (8, 9). Moreover, IL6 induces NETD in PC cells via the activation of distinctive signaIling pathways. In LNCaP cells, Zhu and colleagues demonstrated that repressor element-1 silencing transcription factor functions as a significant switch of IL6-induced NETD (10). Spiotto et al. revealed a potential role of IL6 activation of signal transducers and activators of transcription 3 (STAT3) in NETD of PC cell lines (11). Another in vitro study demonstrated that IL6-induced NETD in CRPC cells is triggered by adipocyte differentiation-related protein (7). Several studies have tried to explain IL6-induced NETD; however, the underlying mechanism has not been clarified yet.
Nevertheless, the role of IL6 in NETD and tumour progression makes it an attractive therapeutic target. However, trials targeting IL6, e.g. using the anti-IL6 chimeric monoclonal antibody (siltuximab), showed no benefit due to the pleiotropism of IL6, resulting in unpredictable responses (12). Therefore an improved understanding of the cellular events associated with IL6-mediated NETD is necessary to identify potential targets in NEPC or prevent NETD.
In the present study, proteomic mass spectrometric analysis was performed to identify new possible therapeutic targets in NEPC after IL6-induced NETD. The actin-binding protein gelsolin (GSN) has been classified as being significantly up-regulated after IL6-induced NETD. In vitro experiments revealed the involvement of GSN in the regulation of cell motility and the mitochondrial apoptotic pathways. Moreover, in vivo knock-out experiments showed that GSN-null mice developed various motility and actin defects (13). In PC, GSN was shown to serve as a coactivator for the AR (14). Here, its role in NEPC was assessed. In addition, since GSN is involved in the release of mitochondrial cytochrome c and induction of apoptosis by regulating the oligomerisation of voltage-dependent anion-selective channel 1 (VDAC1), its role in apoptosis through this interaction was investigated.
Materials and Methods
Cell culture. LNCaP cells (CLS Cell Lines Service, Eppelheim, Germany) were cultured in RPMI 1640 with 20% foetal bovine serum (FBS) and 1% penicillin/streptomycin at 37˚C in 5% CO2. NETD was induced by incubation of LNCaP cells in the presence of 10% FBS and 50 ng/ml IL6 (ImmunoTools, Heidelberg, Germany) for 7 days.
siRNA transfection. For siRNA transfection, 50 nM siRNA against GSN (siGSN) or non-targeting control siRNA (siCTRL) (both from Santa Cruz Biotechnology, Dallas, TX, USA) were used. According to the manufacturer’s protocol, transfection was carried out in 6-well plates using jetPRIME reagent (Polyplus transfection, Illkirch, France). To ensure efficient siRNA transfection even after 7 days of incubation, transfected cells were split into two wells after 4 days and transfected again on the fifth day.
Protein and total RNA isolation by TriFast-Reagent. According to the manufacturer’s instructions, protein and total RNA were extracted with TriFast-Reagent (PEQLAB Biotechnologie, Erlangen, Germany). Protein pellets were vacuum-dried and subsequently dissolved in sample buffer (8 M urea, 2 M thiourea, 4% CHAPS, 65 mM dithiothreitol, 40 mM Tris). Protein was quantified by the Bradford method, total RNA was quantified using a NanoDrop 2000 (Thermo Fischer Scientific, Carlsbad, MA, USA).
2D Gel electrophoresis. Protein samples were applied to ReadyStrip I.P.G. strips (pH 3-10, 24 cm; Bio-Rad, Munich, Germany). 600 μg protein was filled to a volume of 450 μl with rehydration buffer (8 M urea, 2 M thiourea, 2% CHAPS, 15 mM dithiothreitol and 1× Bio-Lyte ampholytes pH 3-10, Bio-Rad), rehydrated overnight, and isoelectric focusing was carried out at 20˚C on a PROTEAN i12 IEF Cell (Bio-Rad) for a total of 60,000 Vh. IPG strips were soaked in equilibration buffer 1 [6 M urea, 2% SDS, 375 mM Tris-HCl (pH 8.8), 20% glycerol and 1% dithiothreitol] and subsequently in equilibration buffer 2 (2.5% iodoacetamide). Strips were placed on sodium dodecyl sulfate-polyacrylamide gel electrophoresis gels, and protein separation was performed using PROTEAN Plus Dodeca Cell (Bio-Rad, Munich, Germany) at constant voltage (80 V) and temperature (20˚C). After 2D separation, the gels were fixed (40% methanol, 15% acetic acid, 4 h) and stained (Roti-Blue, Carl Roth, Karlsruhe, Germany) overnight. After a washing step (20% methanol), gels were digitised and quantification was performed using Delta2D Software 4.7.2 (DECODON, Greifswald, Germany). All gel images were matched and a synthetic fusion gel was prepared, which was used to perform the final spot detection.
Western blotting. For western blot analysis, 20 μg protein was separated by sodium dodecyl sulfate-polyacrylamide gel electrophoresis (10% polyacrylamide gel) and transferred onto a nitrocellulose membrane (Merck Millipore, Darmstadt, Germany). Membrane-bound protein was stained (Ponceau S; Carl Roth), and the stained membrane was digitalised using a ViewPIX1100 scanner (Biostep, Burkhardtsdorf, Germany). After blocking (Roti-Block, 1 h; Carl Roth), membranes were washed with tris-buffered saline/0.1% Tween-20 (TBST) and incubated with the following primary antibodies (TBST +5% bovine serum albumin) at 4˚C overnight: α-tubulin (1:50,000; Abcam, Cambridge, UK), β-3-tubulin (1:3,000; Thermo Fisher Scientific; Waltham, MA, USA), cleaved caspase 3 (CASP3; rabbit, 1:1,000; Cell Signaling Technology, Beverly, MA, USA), GSN (1:5,000; Santa Cruz Biotechnology), IL6R (1:1,000, Proteintech, Chicago, IL, USA), TPD52 isoform1 (1:1,000; produced at the Department of Medical Biochemistry and Molecular Biology, University Medicine Greifswald, Greifswald, Germany), phospho (p)-STAT3 (1:6,000; Abcam, Cambridge, MA, USA), STAT3 (1:6,000; Abcam), SYP (1:2500; Thermo Fisher Scientific) TPD52 (1:2,0000; Sigma-Aldrich, St. Louis, MO, USA), VDAC1 (1:2,000; Proteintech), anti-rabbit-HRP (1:15,000, Cell Signaling Technology), anti-rabbit Alexa 488 (1:300; Life Technologies, Carlsbad, CA, USA), anti-rabbit-Cy3 (1:500; Dianova, Hamburg, Germany), and anti-mouse-horseradish peroxidase (HRP, 1:15,000; Cell Signaling Technology). Subsequently, membranes were probed with species-specific HRP-conjugated secondary antibodies (1:15,000; Cell Signaling Technology) for 30 min at room temperature. For protein detection, membranes were incubated with SuperSignal West Dura Substrate (Thermo Fisher Scientific) and signals captured on a X-ray film (C.E.A., Heidelberg, Germany). For quantification, films were digitised on a ViewPIX1100 scanner (Biostep, Burkhardtsdorf, Germany), and protein signals were quantified using the ImageJ quantification software (National Institutes of Health, Bethesda, MD, USA). All protein signals were normalised to total protein obtained by Ponceau S staining.
Apoptosis assay. According to the manufacturer’s protocol, cells were stained with AlexaFluor 647 annexin V and Zombie (BioLegend, SanDiego, CA, USA) to assess apoptosis. Cells were analysed on a BD LSRII with Cell-Quest software (BD Bioscience, Heidelberg, Germany).
Cell viability assay. The Cell Proliferation Reagent WST-1 assay (Roche Applied Science, Mannheim, Germany) was performed according to the manufacturer’s protocol to assess cell viability.
Quantitative reverse transcription polymerase chain reaction (qRT-PCR). cDNA synthesis was carried out with 1.5 μg of RNA, oligo(dT) primer, and the M-MLV Reverse Transcriptase Kit with RNasin (Promega, Walldorf, Germany). The PCR step was carried out with SensiMix SYBR reagent (Bioline, Luckenwalde, Germany) on a Bio-Rad CFX96 system with RT-PCR Manager software 2.0 (Bio-Rad). The following primers were used for detection of marker mRNA for neuroendocrine-like phenotype: Calcitonin gene-related peptide (CALCA, forward: AAG AGA GCC TGT GAC ACT GC, CALCA reverse: GAG TCA TTC AGC TGC TCA GG), and gastrin-releasing peptide (GRP, forward: GGA CCG TGC TGA CCA AGA TG; reverse: GGT TGA GGT GGC TGG CTG GTG GTT). All samples were normalised to ribosomal protein p0 (RPLP0, forward: CAA TGG CAG CAT CTA CAA CC; reverse: ACT CTT CCT TGG CTT CAA CC).
Fluorescence microscopy. Immunofluorescence staining of PC cells was performed after 7 days in the presence and absence of 50 ng/ml IL6 (15). Samples were incubated with anti-GSN (Santa Cruz Biotechnology), anti-VDAC1 antibody (Proteintech), and rhodamine-labelled phalloidin (Invitrogen, Carlsbad, CA, USA) and visualized with goat anti-rabbit-Alexa488 (Life Technologies) and goat anti-rabbit-Cy3-coupled antibodies (Dianova) according to the manufacturer’s protocol. For nuclear staining, cells were fixed with 4% paraformaldehyde and then incubated with 300 nM 4’,6-diamidino-2-phenylindole. Microscopy analysis was performed with a Leica TCS SP5 system (Leica Microsystems, Germany, Wetzlar) and an EVOS XL core light microscope (AMG, Bothell, WA, USA).
Co-localisation analysis. To detemine the co-localisation of proteins, the ImageJ plugin JACoP was used (https://imagej.nih.gov/ij/plugins/track/jacop2.html). Analysis included Pearson’s coefficient (cytofluorogram), Van Steensel’s cross-correlation function (CCF; pixel shift δ=±100), Li’s intensity correlation analysis (ICA; −0.5=no correlation, 0.5=co-localisation) and Costes’ mask. Channel-specific calibration was revised from saved images, including the refractive index and wavelength.
Matrix-assisted laser desorption/ionization-mass spectrometry/mass spectrometry (MALDI-MS/MS). Protein spots were digested with trypsin and spotted (Ettan Spot Handling Workstation, Amersham Biosciences, Uppsala, Sweden). The MALDI-MS measurement of spotted peptides was carried out on a 4800 MALDI-ToF/ToF Analyzer (Applied Biosystems, Foster City, MA, USA; mass range 800-4,000 Da, with a focus mass of 2,000 Da). An additional MALDI-MS/MS analysis was performed for the five most intense peaks of the MS spectrum. This was followed by a combined database search of MS and MS/MS measurements (GPS Explorer 3.6; Applied Biosystems) and data alignment with the 2019 release of the SwissProt Human Taxonomy database (https://www.uniprot.org/proteomes/UP000005640).
Electrospray ionisation (ESI)-MS/MS. Proteins with low MALDI-MS/MS signals were evaluated again by ESI-MS/MS. In-gel digested proteins were dried and protein samples were dissolved in 10 μl of 0.1% acetic acid/2% acetonitrile and analyzed using an LTQ-Orbitrap Velos (Thermo Fisher Scientific) with nanoACQUITY Ultra Performance LC (Waters Corporation, Milford, MA, USA). Separation in a nanoAcquity Symmetry C18 precolumn and a nanoAcquity BEH130 C18 column was performed with a linear gradient containing buffer A (2% acetonitrile in water with 0.1% acetic acid and 2% dimethyl sulfoxide) and buffer B (5% dimethyl sulfoxide in acetonitrile with 0.1% acetic acid) (B: 0 min 5%, 3 min 5%, 23 min 35% ,28 min 60%, 30 min 100%, 32 min 100%, 39 min 0%). Survey full-scan MS spectra (m/z 300-1700) were acquired in the Orbitrap with resolution R=60,000 at m/z 400. For protein identification, automated database searches were performed with Thermo Proteome Discoverer 2.0 (Thermo Fisher Scientific) using the 2019 release of the SwissProt Human Taxonomy database (https://www.uniprot.org/proteomes/UP000005640).
Statistics. Western blot data was analyzed using GraphPad Prism 6 software (GraphPad, San Diego, CA, USA) with Mann–Whitney U-test. 2D-Gel data were analyzed by Student’s t-test using Delta2D Software 4.7.2 (DECODON). A value of p<0.05 was defined as significant.
Data mining. For expression analysis, the dataset GSE21032, GSE59984 and GSE104786 were analysed using GEO2R (https://www.ncbi.nlm.nih.gov/geo/geo2r/) and the Betastsis website (http://www.betastasis.com/) (16-18).
Results
IL6 induce NETD in the PC cell line LNCaP. According to the protocol of Spiotto et al., LNCaP cells were incubated with 50 ng/ml IL6 for 7 days to induce NETD (10). In the presence of IL6, a neuroendocrine-like cell morphology was observed after 7 days (Figure 1A). Active IL6 signalling was assessed by detection of the activation of the IL6R-downstream target STAT3. Phosphorylated STAT3 protein was detected in IL6-treated cells but not in the untreated control cells (Figure 1B). To demonstrate NETD, expression of the molecular markers for NETD TPD52 isoform 1, TUBB3, and SYP were assessed (4). All tested marker proteins showed a significant increase after 7-day IL6 incubation (Figure 1B). Moreover, there was a significant increase in the secretion of CALCA and GRP protein (Figure 1C) and a tendency for increase of GRP mRNA (Figure 1D). Therefore, a neuroendocrine-like phenotype was found after 7 days of IL6 treatment.

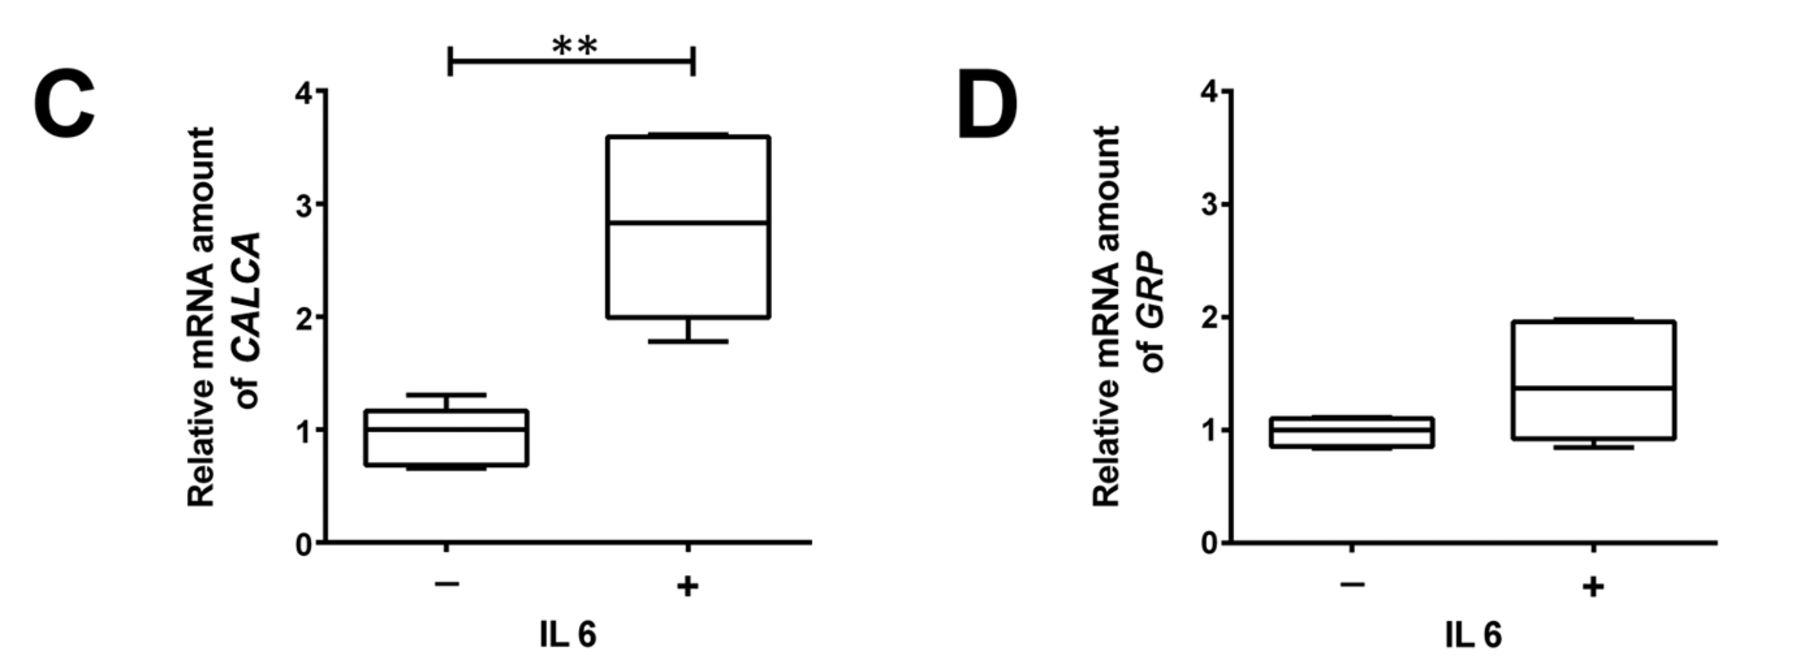
Characterisation of an in vitro neuroendocrine transdifferentiation (NETD) model for prostate cancer – relative protein and mRNA expression of NETD markers in LNCaP cells. A: Representative light microscopy images of LNCaP cells (bar=50 μm) with and treatment with 50 ng/ml interleukin 6 (IL6) for 7 days. The arrows indicate typical morphological changes due to NETD. B Western blots (left) for expression of signal transducer and activator of transcription 3 (STAT3), phospho (p)STAT3, tumour protein D52 isoform 1 (TPD52), tubulin, beta 3 class III (TUBB3) and synaptophysin (SYP) proteins in LNCaP cells after treatment with and without IL6, and their quantitative analyses (right). Representative blots are shown (n=5). Membrane staining served as the loading control. C: Relative mRNA expression of CALCA (left) and gastrin-releasing peptide (GRP) (right). Differences were assessed using Student’s t-test (*p<0.05, **p<0.01).
Proteomic analysis of LNCaP cells. For proteomic analysis, five biological replicas of samples from untreated and neuroendocrine-like cells were electrophoretically separated in 2D, combined with a fusion image and differentially expressed factors were identified. A total of 1,506 protein spots were detected, of which 64 differed by at least a factor of two and exhibited a standard deviation of <30% (data not shown). The strong induction of GSN expression by IL6 treatment (Figure 2A) was striking and was further verified by western blot (Figure 2B).

Gelsolin (GSN) protein expression in LNCaP cells after treatment with/without 50 ng/ml interleukin 6 (IL6) for 7 days. A: Enlarged view of Coomassie-stained 2D gel of LNCaP cells without (left) and with (right) treatment. GSN is encircled. Differences in spot intensities were analysed with Delta 2D software. B: Quantitative western blot analysis indicating the relative amount of GSN protein in LNCAP lysates with/without treatment; representative membrane signals are shown (n=5). Membrane staining served as the loading control. Differences were assessed using Student’s t-test (**p<0.01).
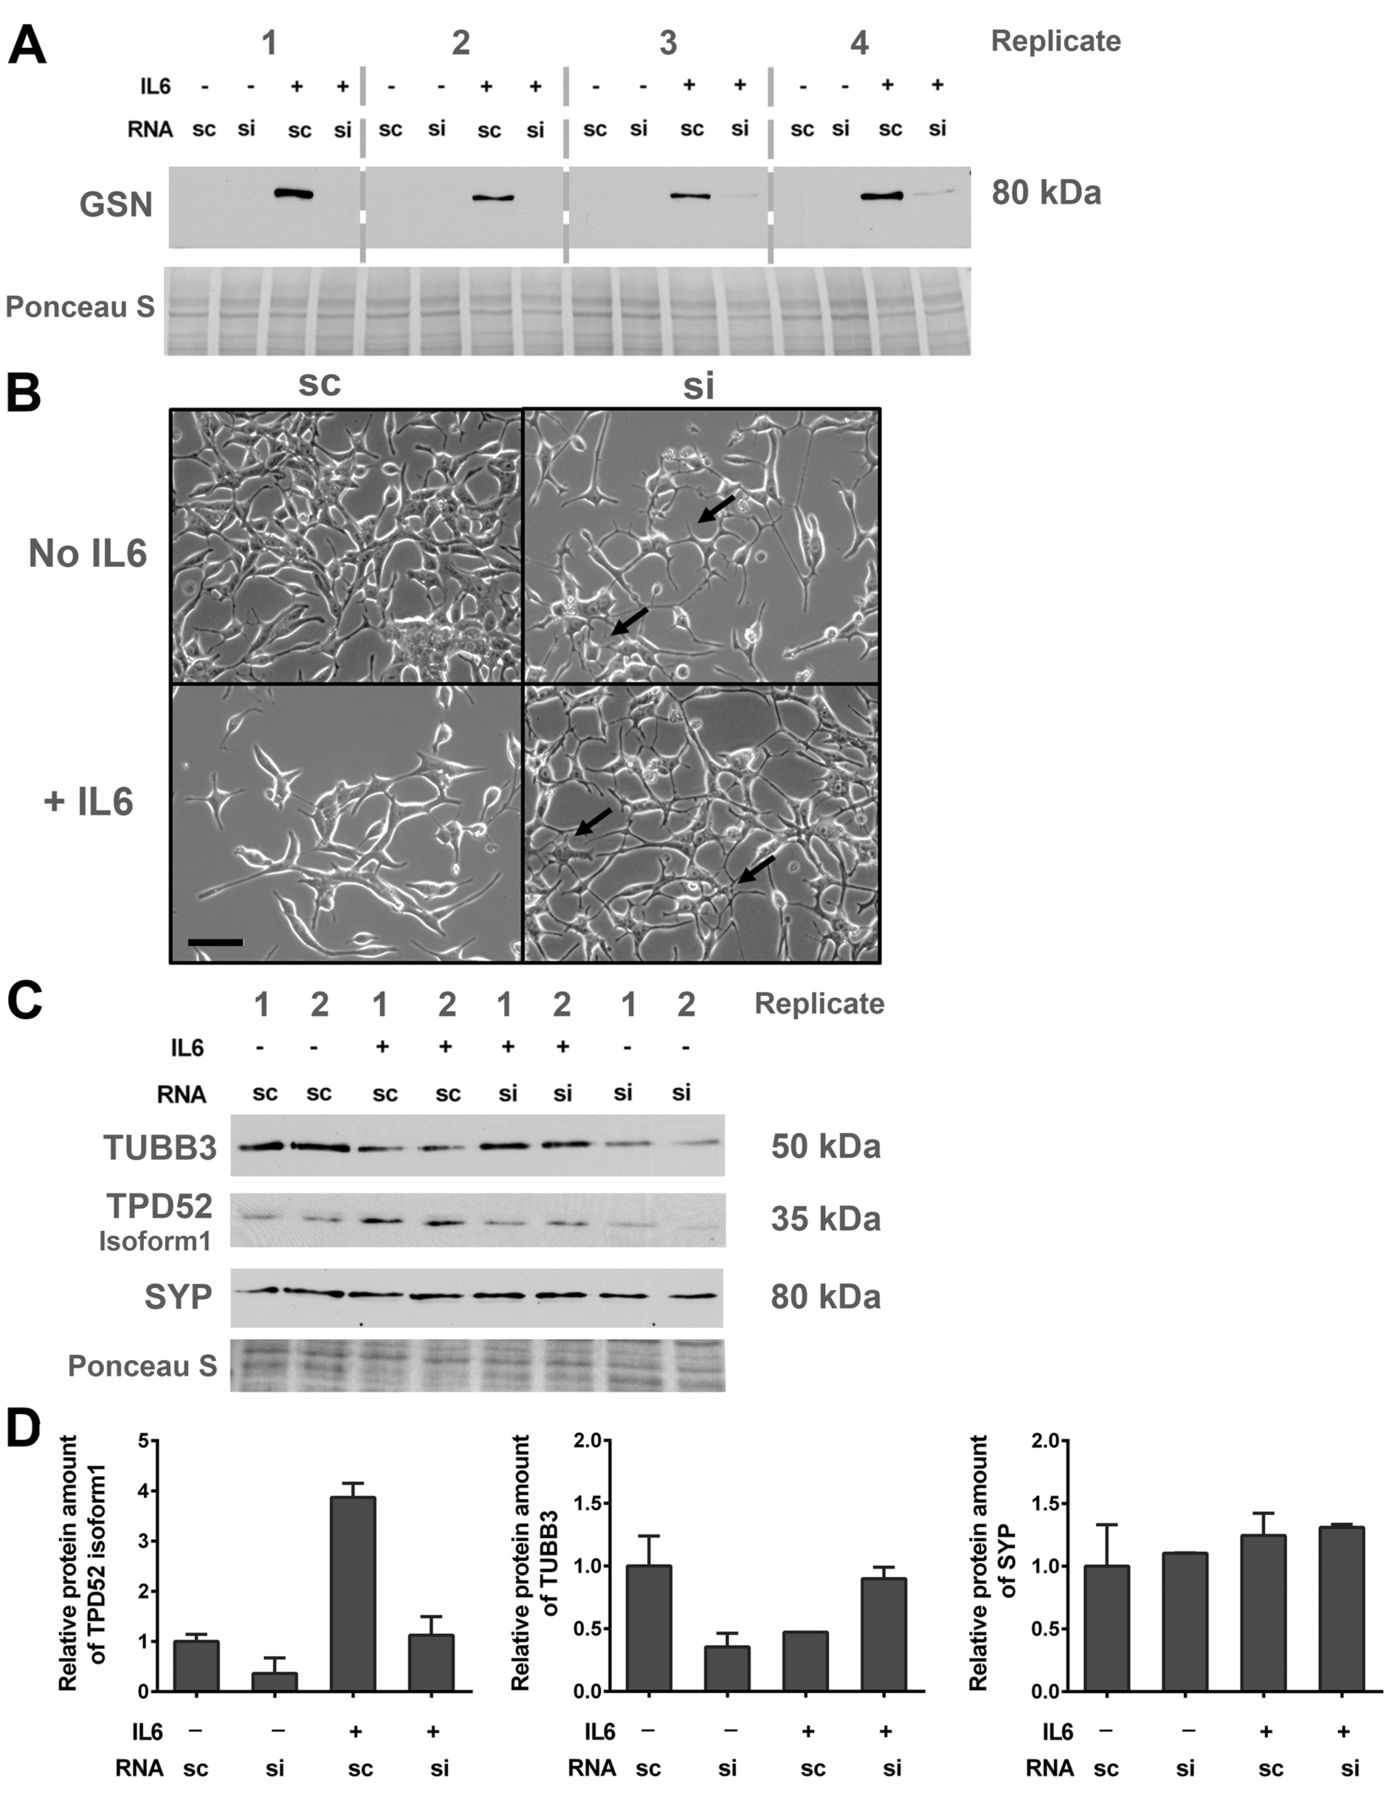
GSN inhibits NETD. To investigate if GSN is involved in NETD, knock-down experiments were performed. Transfection with siCTRL showed no effect on GSN expression in cells treated with IL6 for 7 days, whereas transfection with siGSN suppressed its protein expression (Figure 3A). To investigate if silencing of GSN prevented IL6-induced NETD, cell morphology (Figure 3B) and expression of the NETD marker proteins TPD52 isoform 1, TUBB3, and SYP were assessed after siGSN transfection and 7 days of IL6 treatment. After siGSN transfection, IL6 neither induced neuroendocrine-like morphology (Figure 3B) nor increased the expression of the tested NETD markers (Figure 3C and D).

Influence of gelsolin (GSN) knock-down on neuroendocrine transdifferentiation in LNCaP cells. LNCaP cells were transfected with 50 nM scrambled control RNA (sc) or siRNA-GSN (si) and cultivated for 7 days with or without interleukin 6 (IL6). A: Representative western blot showing the efficiency of the siRNA-mediated GSN knock-down. B: Light microscopy images indicating morphology of LNCaP cells after RNA transfection (bar=50 μm). C: Representative western blot of two independent experiments. Expression of tubulin, beta 3 class III (TUBB3), tumour protein D52 isoform 1 (TPD52) and synaptophysin (SYP) and total protein stained with Ponceau S were detected. D: Densitometry of TUBB3, TPD52, and SYP protein expression levels relative to total protein.
GSN interaction with VDAC1. GSN protein has been reported to functionally interact with VDAC1 (19). Microscopic analysis of the intracellular localization demonstrated that both proteins were predominantly detectable in the perinuclear space and hardly in cellular protrusions (Figure 4A-F). Bioinformatic image analysis indicated the significant co-localization of the two proteins (r=0.924; CCFmin=0.041 for dx=100 and CCFmax=0.924 for dx=0; ICQ=0.487), which suggested a functional correlation of GSN and VDAC1 proteins in NETD. This was supported by the observation that VDAC1 protein expression was also significantly up-regulated in the IL6-dependent development of NETD (Figure 4G).
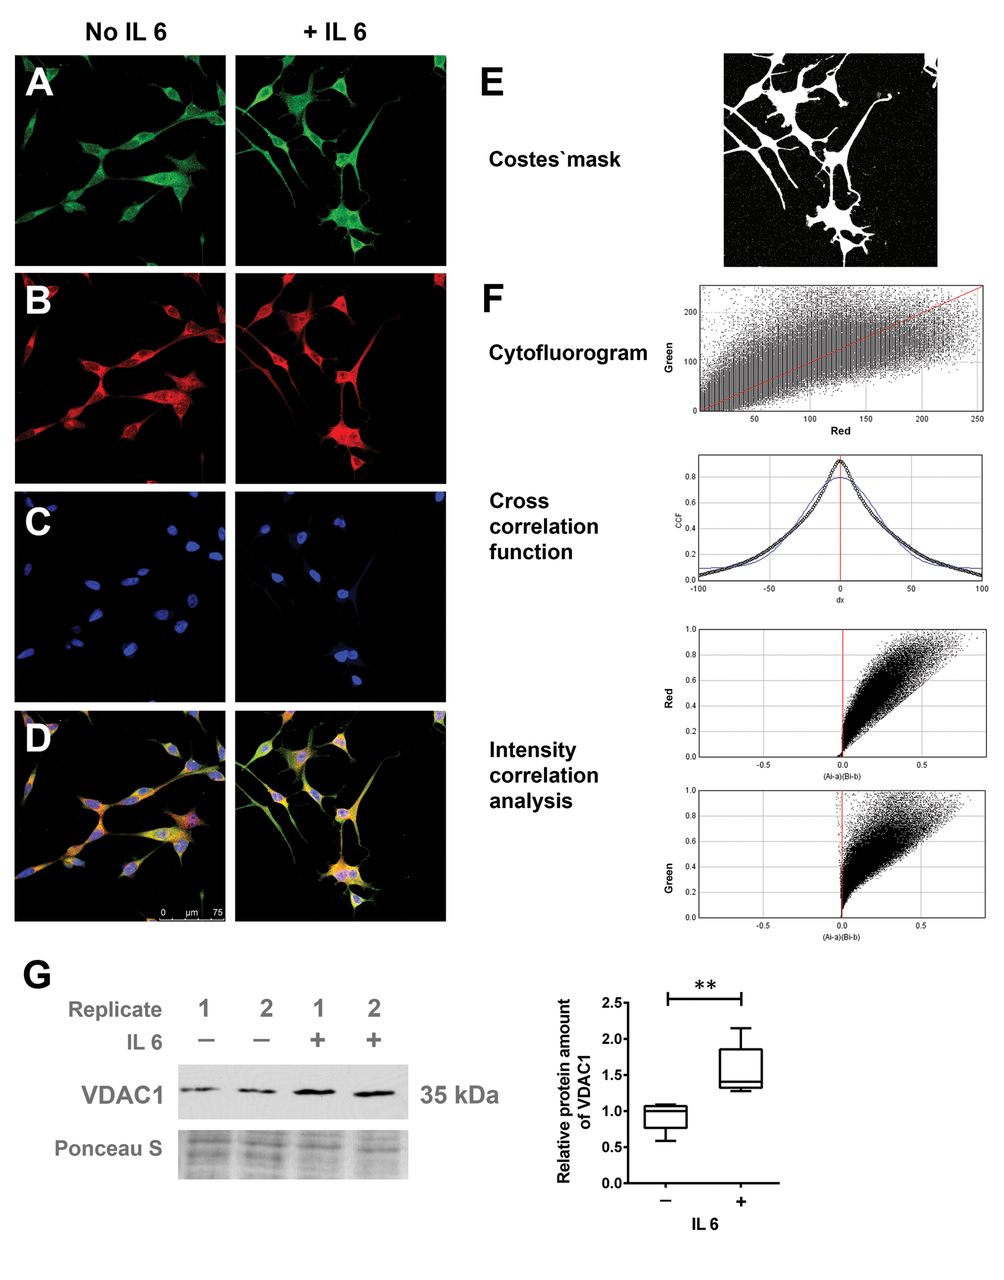
Co-localisation analysis for gelsolin (GSN) and voltage-dependent anion-selective channel 1 (VDAC1). LNCaP cells were treated with/without 50 ng/ml interleukin 6 (IL6) for 7 days. Confocal fluorescence images were taken for green, red and blue channels. Immunofluorescence staining of GSN (A, green), VDAC1 (B, red) and nuclei (C, 4’,6-diamidino-2-phenylindole (DAPI), blue) were performed after fixation with 4% paraformaldehyde. Merged images are shown in D. E and F: Co-localization analysis was performed with an ImageJ Plugin JACoP. G: Quantitative western blot analysis indicating the relative protein amount of VDAC1; representative membrane signals are shown (n=5). Membrane staining served as the loading control. Differences were assessed using Student’s t-test (**p<0.01).
GSN knock-down induces apoptosis of neuroendocrine-like cells. To further investigate if GSN influences VDAC1, western blot analysis of VDAC1 protein was performed after GSN knock-down. After knock-down, expression of VDAC1 protein was reduced by a factor of 1.9 (Figure 5A). According to previous studies showing a pro-apoptotic role of GSN and VDAC1 (19), induction of apoptosis was investigated after GSN knock-down. siGSN transfection led to a 3.3-fold increase of the apoptotic marker cleaved CASP3 protein in the cells treated with IL6 for 7 days (Figure 5B). Moreover, an increase of apoptotic cells by 1.75-fold was confirmed by flow cytometric analysis of annexin V (Figure 5C and D) after GSN knock-down in the cells treated with IL6 for 7 days. The increased induction of apoptosis was accompanied by a reduced cell viability after siGSN transfection and simultaneous IL6 treatment (Figure 5E). Therefore, siRNA-mediated down-regulation of GSN leads to apoptosis in cells treated with IL6.
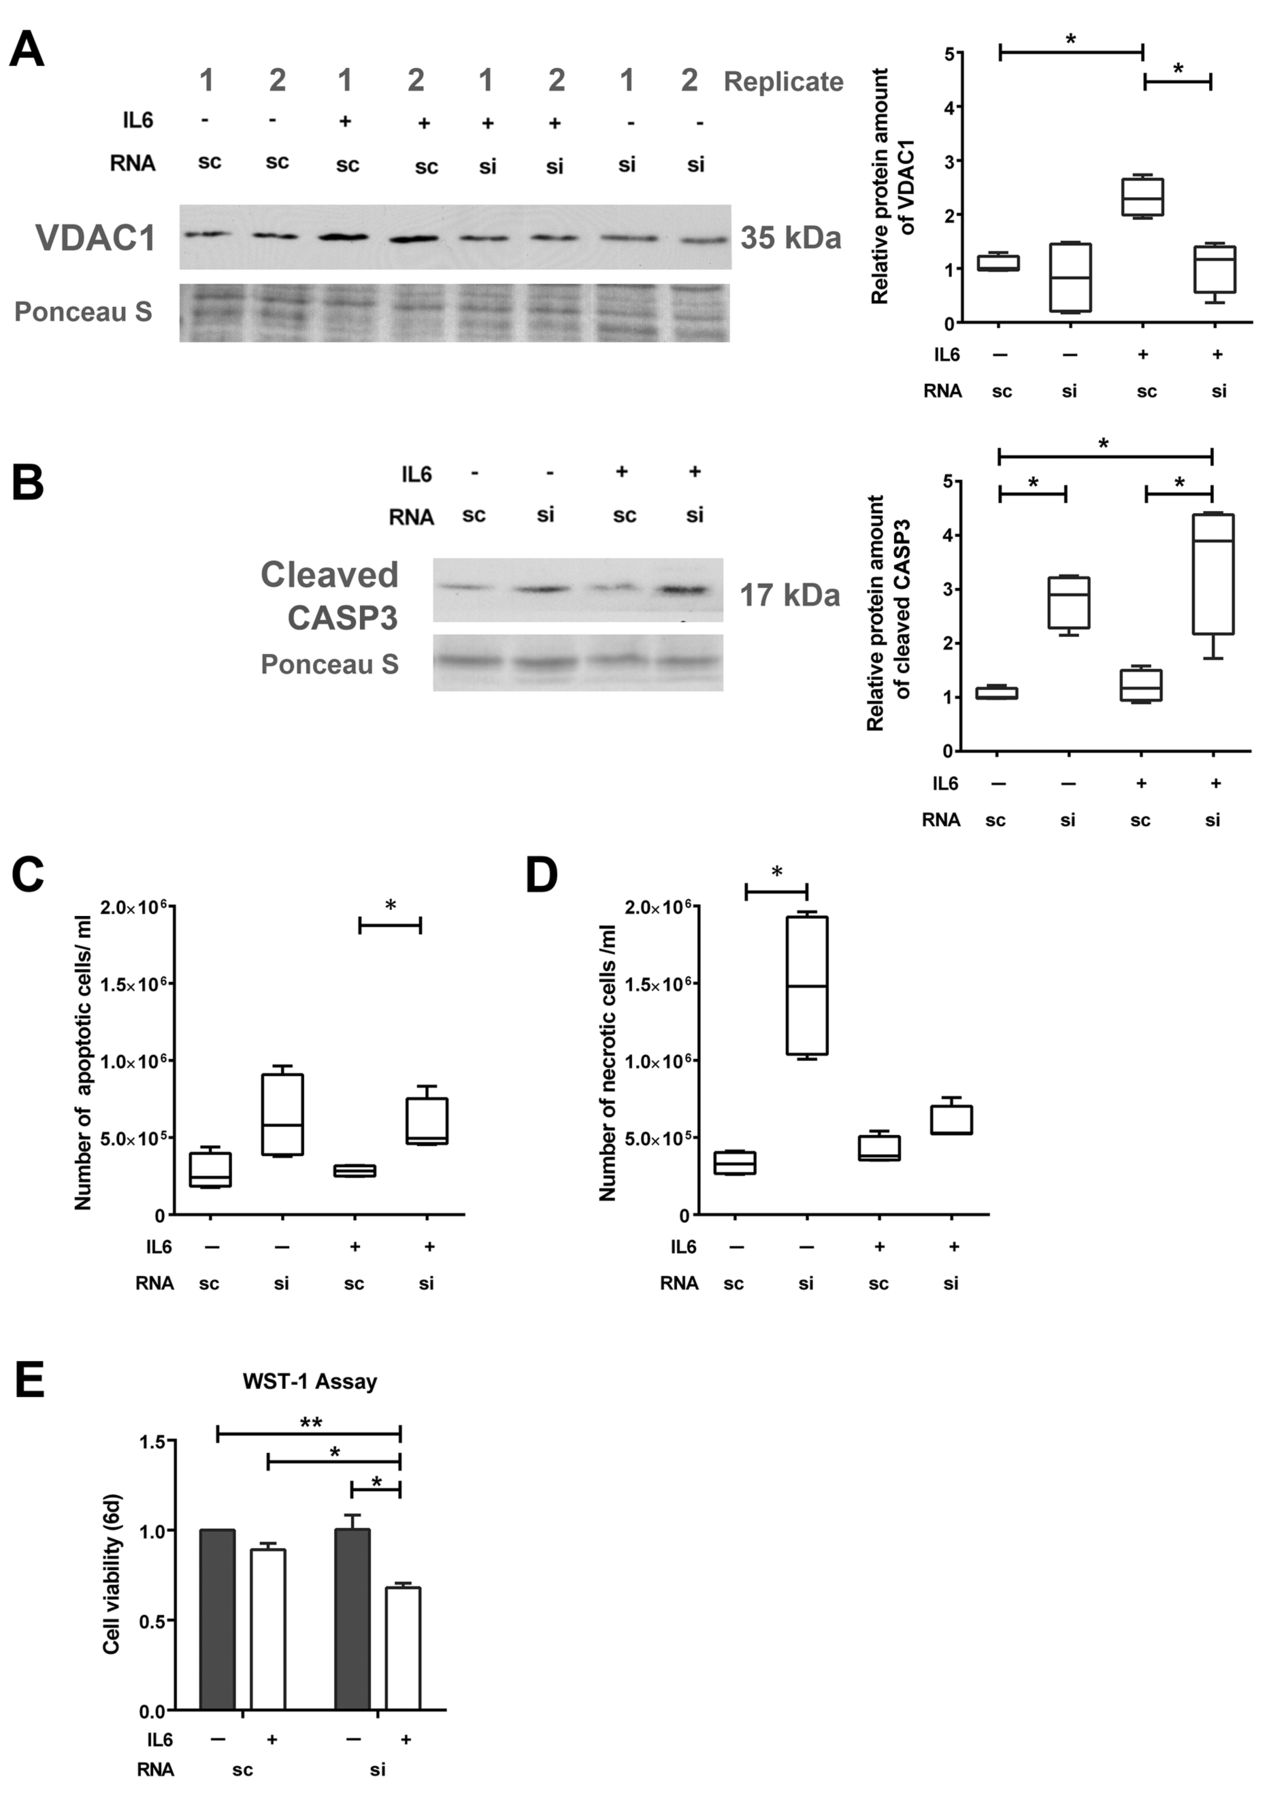
Influence of gelsolin (GSN) knock-down on apoptosis in LNCaP cells. LNCaP cells were transfected with 50 nM scrambled (sc) or siRNA-GSN (si) and cultivated for 7 days with or without interleukin 6 (IL6). Representative western blots and relative protein expression of voltage-dependent anion-selective channel 1 (VDAC1) (A) and cleaved caspase 3 (CASP3) (B) (n=4). Quantification of flow cytometric analysis for apoptotic (annexin V-positive) cells (C) and necrotic (zombie dye-positive) cells (D). E: Data from cell viability assay using WST-1 reagent (n=4). Differences were assessed using Student’s t-test (*p<0.05, **p<0.01).
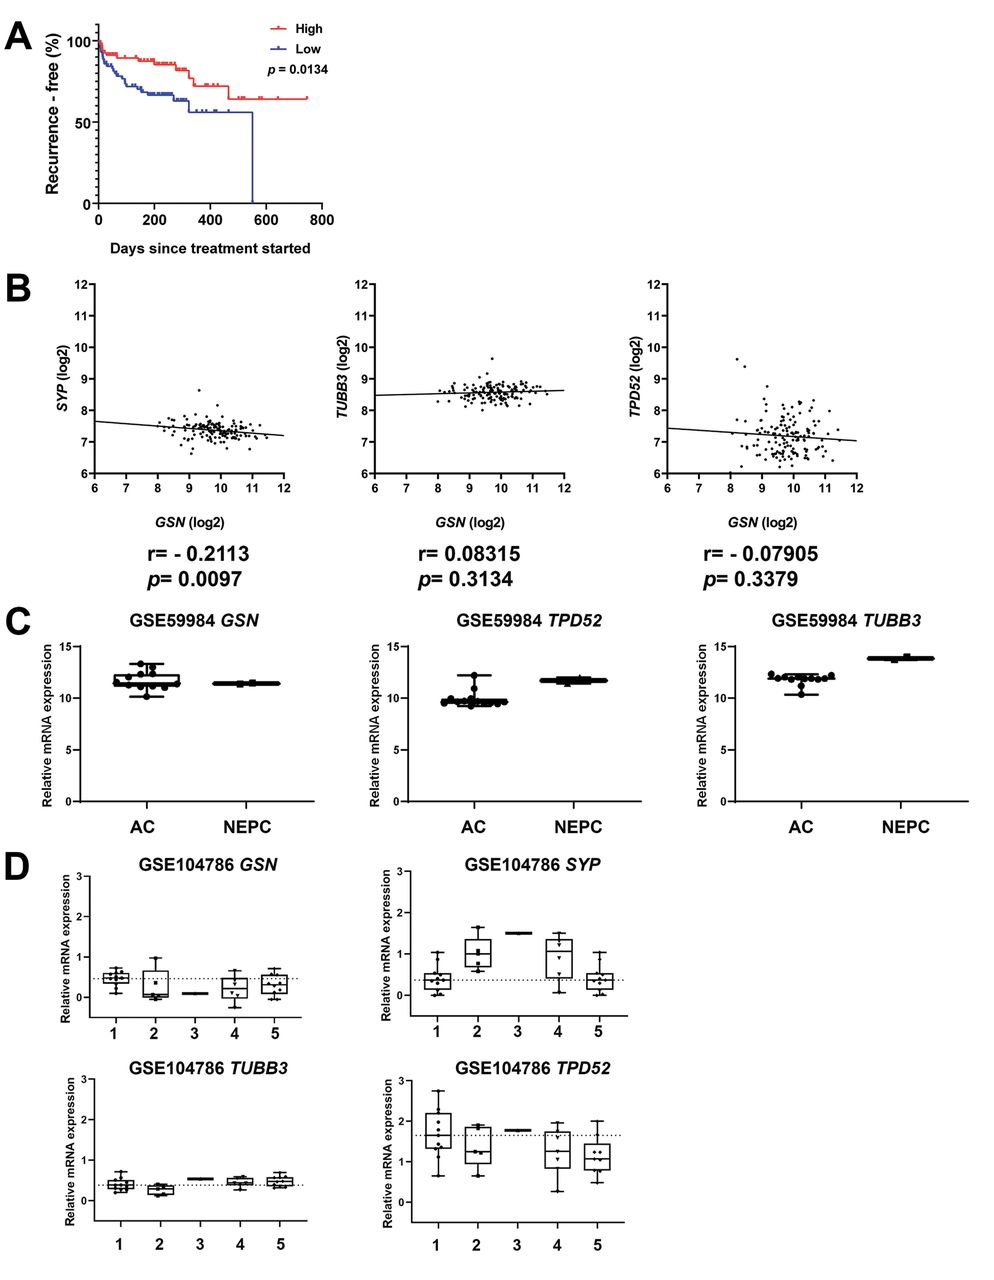
GSN mRNA expression is not increased in patient-derived neuroendocrine tumours. To investigate the GSN expression in NEPCs, publicly available data sets were analysed for GSN mRNA expression. Kaplan–Meier survival analysis (Figure 6A) on the data of Taylor et al. showed GSN mRNA expression to be associated with poorer survival (16). However, GSN mRNA expression was not correlated with themRNA levels of neuroendocrine molecular markers SYP, TUBB3, and TPD52 (Figure 6B). In prostate adenocarcinoma and NEPC derived from patient-derived xenograft models, no difference in GSN mRNA expression was found (Figure 6C) (18). In this dataset, the mRNA expression of neuroendocrine molecular markers SYP, TUBB3 and TPD52 was increased in NEPC compared to adenocarcinoma. Similar results were found in a dataset published by Tsai and colleagues comparing different small-cell and NEPC phenotypes to the adenocarcinoma phenotype (17). Compared to adenocarcinoma phenotype, all other phenotypes showed down-regulation of GSN mRNA expression (Figure 6D). Only the neuroendocrine molecular marker SYP showed increased mRNA expression in NEPC compared to the adenocarcinoma phenotype.
Gelsolin (GSN) mRNA expression is not increased in patient-derived neuroendocrine prostate cancer (NEPC) tumours. A: Recurrence-free survival analysis from patients with low and high GSN levels (16). The median expression level was chosen as a threshold. B: Correlation analysis of GSN with the NEPC molecular markers synaptophysin (SYP), tubulin, beta 3 class III (TUBB3), and tumour protein D52 isoform 1 (TPD52) in the dataset published by Taylor et al. (16). C: GSN mRNA expression in prostatic adenocarcinoma (AC) and NEPC derived from patient-derived xenograft from the dataset GSE59984 (18). D: GSN mRNA expression in prostatic adenocarcinoma and different subtypes of NEPC from the GSE104786 dataset (17). Sample type: 1: Adenocarcinoma, 2: adenocarcinoma with mixed histology, 3: adenocarcinoma with neuroendocrine differentiation, 4: small-cell carcinoma, 5: small-cell carcinoma with mixed histology.
Discussion
NEPC has become an increasingly recognised clinical problem as approximately 20% of patients with metastatic CRPC will develop this highly aggressive form of PC (2). While NEPC can arise de novo, most cases develop due to hormonal therapy and taxane-based chemotherapy used to treat progressive CRPC (1). Overall survival for patients diagnosed with NEPC is about 15 months, whereas for patients with adenocarcinoma it is approximately 32 months (20). NEPCs are currently palliatively treated with platinum-based chemotherapy regimens similarly to neuroendocrine cancer of other organ systems (20). Due to the limited therapy success, new therapy strategies and prognostic markers are necessary.
In this study, a proteomics approach was used to identify new therapeutic targets in an in vitro model of NEPC. NEPC is characterised by small cells with a prominent nucleus, little cytoplasm and expression of neuroendocrine markers such as SYP, TPD52 and TUBB3 (3, 4). Here, neuroendocrine differentiation was induced by 7-day treatment of LNCaP cells with IL6, resulting in an increase of the expression of neuroendocrine markers SYP, TPD52, and TUBB3. This observation is in line with several other studies revealing IL6-induced STAT3 activation leading to trans-differentiation of LNCaP cells to neuroendocrine-like cells (4, 10, 11). IL6 and STAT3 are considered promising targets in PC treatment, and several inhibitors of the IL6/STAT3 signalling cascade, such as siltuximab, ruxolitinib and galiellalactone, have been studied in PC [reviewed in (21)]. However, although these compounds delivered promising results in pre-clinical studies, none were successful in clinical trials.
To identify potential therapeutic targets involved in IL6-induced NETD, the proteomes of cells before and after IL6 treatment were examined using MS. Out of the 1,506 identified proteins regulated during neuroendocrine differentiation, the lipid-binding actin-regulatory protein GSN was chosen for further investigation. GSN is widely expressed intracellularly, including in the cytoplasm and mitochondria, and its expression is altered in several tumour types, including of the bladder, colon, breast, and prostate (22, 23). GSN inhibits apoptosis by stabilising mitochondria and has been shown to act as a co-regulator for nuclear receptors, including STAT3 and AR (13, 14, 24). Tanaka and colleagues revealed a role of GSN in epithelial– mesenchymal transition, thereby describing the role of this protein in a differentiation process (23). Their study suggested that GSN functions as a switch that controls E- and N-cadherin, and demonstrated that loss of GSN expression leads to a mesenchymal phenotype and is involved in tumorigenesis. In our study, knock-down by siRNA against GSN prevented IL6-induced neuroendocrine differentiation of LNCaP cells and therefore identified GSN as a possible target for preventing NETD of PC.
The exact role of GSN in neuroendocrine differentiation has not been clarified but the data presented here suggest a potential role of the interaction between GSN and VDAC1. Several studies have already reported the interaction of GSN and VDAC1, and in vitro experiments have revealed that the physical binding of GSN to VDAC1 has anti-apoptotic effects (24). VDAC1 is regulated by multiple proteins and molecules and is a protein crucial in controlling apoptotic mitochondrial changes by interaction with members of anti-apoptotic proteins such as the BCL2 apoptosis regulator family (25). The data presented here show that knock-down of GSN leads to apoptosis during IL6-induced neuroendocrine differentiation of LNCaP cells, suggesting a protective role of GSN and VDAC1 during this differentiation process. VDAC1 is a known cellular transporter of metabolites, Ca2+ and reactive oxygen species, and controls cell metabolism (26). Metabolic reprogramming in tumour cells has been recognised as one of the hallmarks of cancer and plays a role in tumour progression (27). In PC, it has been demonstrated that aggressive NEPC phenotypes require more energy, and, therefore, metabolic reprogramming is mandatory during neuroendocrine differentiation (28). The results presented here suggest a possible non-apoptotic role of GSN and VDAC1 in IL6-induced neuroendocrine differentiation of LNCaP cells by reprogramming their metabolism and therefore influencing cell fate.
To evaluate the in vitro data, several publicly available datasets of patient material were screened for GSN expression. As the data presented here suggest that GSN is increased in NEPC, Kaplan–Meier analysis was performed of the dataset of Taylor et al. and revealed a shorter survival for patients with high GSN expression (16). This result is in line with reports that NEPC is highly aggressive and linked to short survival (20, 29). However, GSN expression did not correlate with the neuroendocrine molecular markers SYP, TUBB3 and TPD52 in the dataset of Taylor et al. (16). Moreover, the datasets indicate no up-regulation of GSN compared to adenocarcinoma phenotypes. These results again reveal the problem of high tumour heterogeneity in PC (30-32). It should be mentioned that data on NEPC are limited, and patient cohorts are small. Therefore more data on NEPC is necessary for including or excluding possible new biomarkers and therapeutic strategies. In addition, these data were obtained using an NEPC model created by a 7-day treatment with IL6, so that an IL6-specific effect cannot be excluded.
In summary, this study confirmed IL6 induces neuroendocrine differentiation as shown by former studies. Moreover, it was demonstrated that GSN is required in the differentiation process. Therefore, more investigations should be performed to define the role of GSN in the process of neuroendocrine differentiation and as a promising target to prevent NEPC.
Acknowledgements
The Authors gratefully acknowledge the Interfaculty Institute of Genetics and Functional Genomics, Department of Functional Genomics, University of Greifswald for the MS measurements and Robert Beyer for excellent technical assistance.
Footnotes
* These Authors contributed equally to this study.
This article is freely accessible online.
Authors’ Contributions
Conceptualisation, HJ, RW and SV; methodology, FO, HJ and SV; formal analysis, FO, HJ and SV; investigation, MBS and HHHE; resources, RW and UZ; writing — original draft preparation, MBS and HHHE; writing — review and editing, HJ, MBS, HHHE and SV; supervision, RW and UZ. All Authors read and agreed to the published version of the article.
Conflicts of Interest
The Authors declare that they have no competing interests.
- Received June 7, 2021.
- Revision received July 5, 2021.
- Accepted July 6, 2021.
- Copyright © 2021 International Institute of Anticancer Research (Dr. George J. Delinasios), All rights reserved.