

Abstract
Aim: To evaluate modifications of perfusional parameters assessed by perfusion computed tomography (P-CT) of liver metastases (LM) from pancreatic neuroendocrine tumors (PanNETs) during everolimus treatment. Patients and Methods: All patients with LMs from G1-2 PanNETs undergoing everolimus treatment between January 2013 and January 2015 were prospectively evaluated with P-CT at baseline, and after 2 and 4 months of therapy. Size, perfusion, blood volume (BV), peak enhancement intensity (PEI) and time to peak for each lesion were calculated. Results: A total of 33 LMs in nine patients with G1-2 PanNETs were prospectively evaluated: 23/33 (69.7%) were responders, 10/33 (30.3%) were non-responders. Among perfusional parameters, only numerical peak enhancement intensity values significantly differed between the two groups at baseline (p=0.043). BV increase was the most significant perfusional modification identifying responding lesions, even at an early stage of treatment, with a high positive predictive value (89.47%). Conclusion: P-CT seems to be useful for prediction of response to everolimus of LMs from PanNETs.
- Perfusion CT
- perfusion
- pancreatic neuroendocrine tumor
- everolimus
- predictive biomarkers
Pancreatic neuroendocrine neoplasms represent about 1.3% of all solid tumors of the pancreas, with high prevalence and increasing incidence. Pancreatic neuroendocrine neoplasms are divided into well-differentiated pancreatic neuroendocrine tumors (PanNETs; grade 1 and 2, with Ki67 index of <2% and 2-20%, respectively) and poorly differentiated pancreatic neuroendocrine carcinomas (grade 3, with Ki67 index >20%) (1).
Well-differentiated PanNETs usually present high vascularization, with diffuse expression of pro-angiogenic molecules such as vascular endothelial growth factor (VEGF) (2). This is the rationale for using agents that directly or indirectly inhibit angiogenesis; among these, sunitinib and everolimus significantly improved progression-free survival (PFS) in phase III randomized controlled trials in patients with advanced and progressive PanNETs, and are currently approved by main regulatory agencies for such indication (3, 4).
A major limitation in the use of targeted agents lies in the difficult evaluation of tumor response. Response Evaluation Criteria in Solid Tumors (RECIST) 1.1 are the only validated criteria (5) but their accuracy is largely debated when applied to drugs that induce tissue modifications rather than tumor shrinkage, and this may underestimate clinical benefit (6).
The alternative response criteria of Choi et al. (7) and modified RECIST criteria include changes in tumor enhancement on computed tomography (CT) and demonstrated better correlation with clinical outcome in hepatocellular carcinoma and gastrointestinal stromal tumor (7-9). Nevertheless, their potential in predicting drug response in patients with PanNETs is still under debate; for this reason there is a compelling need to find new parameters of response that evaluate also perfusional and functional modifications.
Perfusion CT (P-CT) can assess the vascular supply of tumors through the analysis of temporal changes in the attenuation of blood vessels and tissues (10). It allows highly reproducible measurements of tumor vascular physiology and construction of regional maps of tumor blood flow, blood volume (BV), time to peak (TTP) and peak enhancement intensity (PEI).
Preliminary studies in NETs suggest a significant correlation between P-CT parameters and intratumoral microvascular density, tumor grade, microscopic vascular involvement and both the presence of lymph node and liver metastases (11). As a functional biomarker, P-CT has been tested in the evaluation of metastatic NETs treated with interferon, bevacizumab, and everolimus (alone and in association), demonstrating its capability in detecting early modifications in perfusion parameters (12-14). The correlation between such modifications and treatment response or clinical outcome is under investigation.
The aims of this study were to describe the modifications detected by P-CT in liver metastases from PanNETs during everolimus treatment and to evaluate possible correlations between tumor perfusion changes and clinical outcome in terms of PFS.
Patients and Methods
Ethical board approval was waived. All patients who underwent treatment with everolimus for well-differentiated (grade 1-2) PanNET metastatic to the liver between January 2013 and January 2015 were prospectively evaluated with P-CT.
Patients. Inclusion criteria included: age >18 years; histological diagnosis of well-differentiated (G1-2) PanNET obtained with a percutaneous or endoscopic ultrasound-guided biopsy; advanced progressive disease in the 6 months preceding the enrolment; presence of measurable liver metastases that could be evaluated as target lesions at baseline and during therapy. Exclusion criteria included: previous treatment with transarterial (chemo)embolization, local ablative techniques, peptide receptor radionuclide therapy; contraindications to CT study; contraindications for the use of everolimus.
Treatment. Patients were treated with continuous oral everolimus (Afinitor; Novartis) therapy at the daily dose of 10 mg in association with best supportive care; a treatment cycle was considered to be 28 days. Safety and tolerability of the drug were assessed at the beginning of each cycle from the initiation of study treatment until at least 28 days after the last dose of the drug by standard monitoring methods [Common Terminology Criteria for Adverse Events (CTCAE) version 4.0] (15). For patients who reported any relevant toxicity (grade 3-4 according to CTCAE), dose adjustments or dose interruptions were allowed.
P-CT technique. P-CT studies were performed at baseline (T0) and after 2 (T1) and 4 (T2) months of everolimus treatment. All perfusion CT examinations were performed with a 64-row multidetector CT scanner (Brilliance 64; Philips, Eindhoven,the Netherlands). Each examination was performed after a minimum fast of 6 hours, with patients in supine position with their arms behind their head during superficial and regular free-breath scanning. An unenhanced scan was acquired before P-CT to select the target volume. Repeated sequential scans were performed during the administration of 60 ml of iodine contrast agent (iopromide, Ultravist 370; BayerScheringPharma AG, Berlin, Germany) administered with a double-syringe injector (Stellant, MadRad, Indianola, PA, USA) at an injection rate of 5 ml/s followed by 40 ml of saline solution at the same flow rate.
CT scanning parameters included 120 kVp, tube current of 100 mAs/slice, gantry rotation time of 0.4 s, increment 5 mm, 5-mm slice thickness and 100 mm in length. 64-Slice CT scanners allow an axial coverage of about 40 mm. Using toggling table technique during dynamic image acquisition, axial coverage could be extended to 100 mm. Scanning started 7 s after starting injection of contrast agent and images were acquired every 10 s for 60 s, then at 82, 97, 117 s, for a total of 200 images.
Image data analysis. Image data were processed on a workstation (Extended Brilliance Workspace V4.5.2.40007; Philips) loaded with commercial P-CT software (CT Perfusion Software; Philips) based on slope method of analysis. An abdominal radiologist with 15 years of experience in abdominal imaging (MD) reviewed all images. The arterial input was obtained by manually drawing a circular region of interest (ROI) within the abdominal aorta. A single ROI was manually drawn within each target lesion.
Definition of response. Treatment response was evaluated by means of RECIST1.1 criteria as reference standard. For the purpose of our study, we considered responders to be patients with disease control lasting at least 11 months during everolimus treatment; this boundary was chosen on the basis of the observed median PFS in the phase III trial of everolimus in patients with advanced, well-differentiated, progressive PanNETs (4). For the separate evaluation of each lesion, we used dimensional criteria adapted from the RECIST criteria in order to define a lesion as stable (<30% decrease or <20% increase in the maximum diameter) or progressive (>20% increase in the maximum diameter); to avoid possible transient modifications, the progressive trend had to be confirmed in two subsequent imaging studies. Accordingly, we defined responder lesions as those which did not show progression before 11 months, while lesions progressing before 11 months were considered non-responders.
Statistical analysis. Morphological and perfusional features of each target lesion were recorded at baseline and during everolimus treatment. A comparison between responding and non-responding lesions was made for morphological and perfusional variables at T0, T1 and T2. After assessing absolute modifications of each parameter separately for responding and non-responding lesions with repeated ANOVA tests, we compared the mean values of responding and non-responding lesions using one-way ANOVA test. Chi-square test was used to compare different trends between groups for categorical variables. A p-value of less than 0.05 was considered statistically significant. Sensitivity, specificity, and positive (PPV) and negative predictive values (NPV) of relevant modifications were calculated.
Results
Study population. Twelve consecutive patients with G1-2 PanNETs suitable for everolimus treatment were prospectively enrolled. Two patients were excluded because their liver lesions were deemed too small to be analyzed with P-CT; one patient was excluded because of worsening chronic renal failure after the second P-CT examination. Our final study population included nine patients [Gender: male=4 (44%), female=5 (56%); Age: mean=62.44, range=47-74; Grade G1=1 (11%), G2=9 (89%)]. At baseline, a total of 33 liver target lesions were selected.
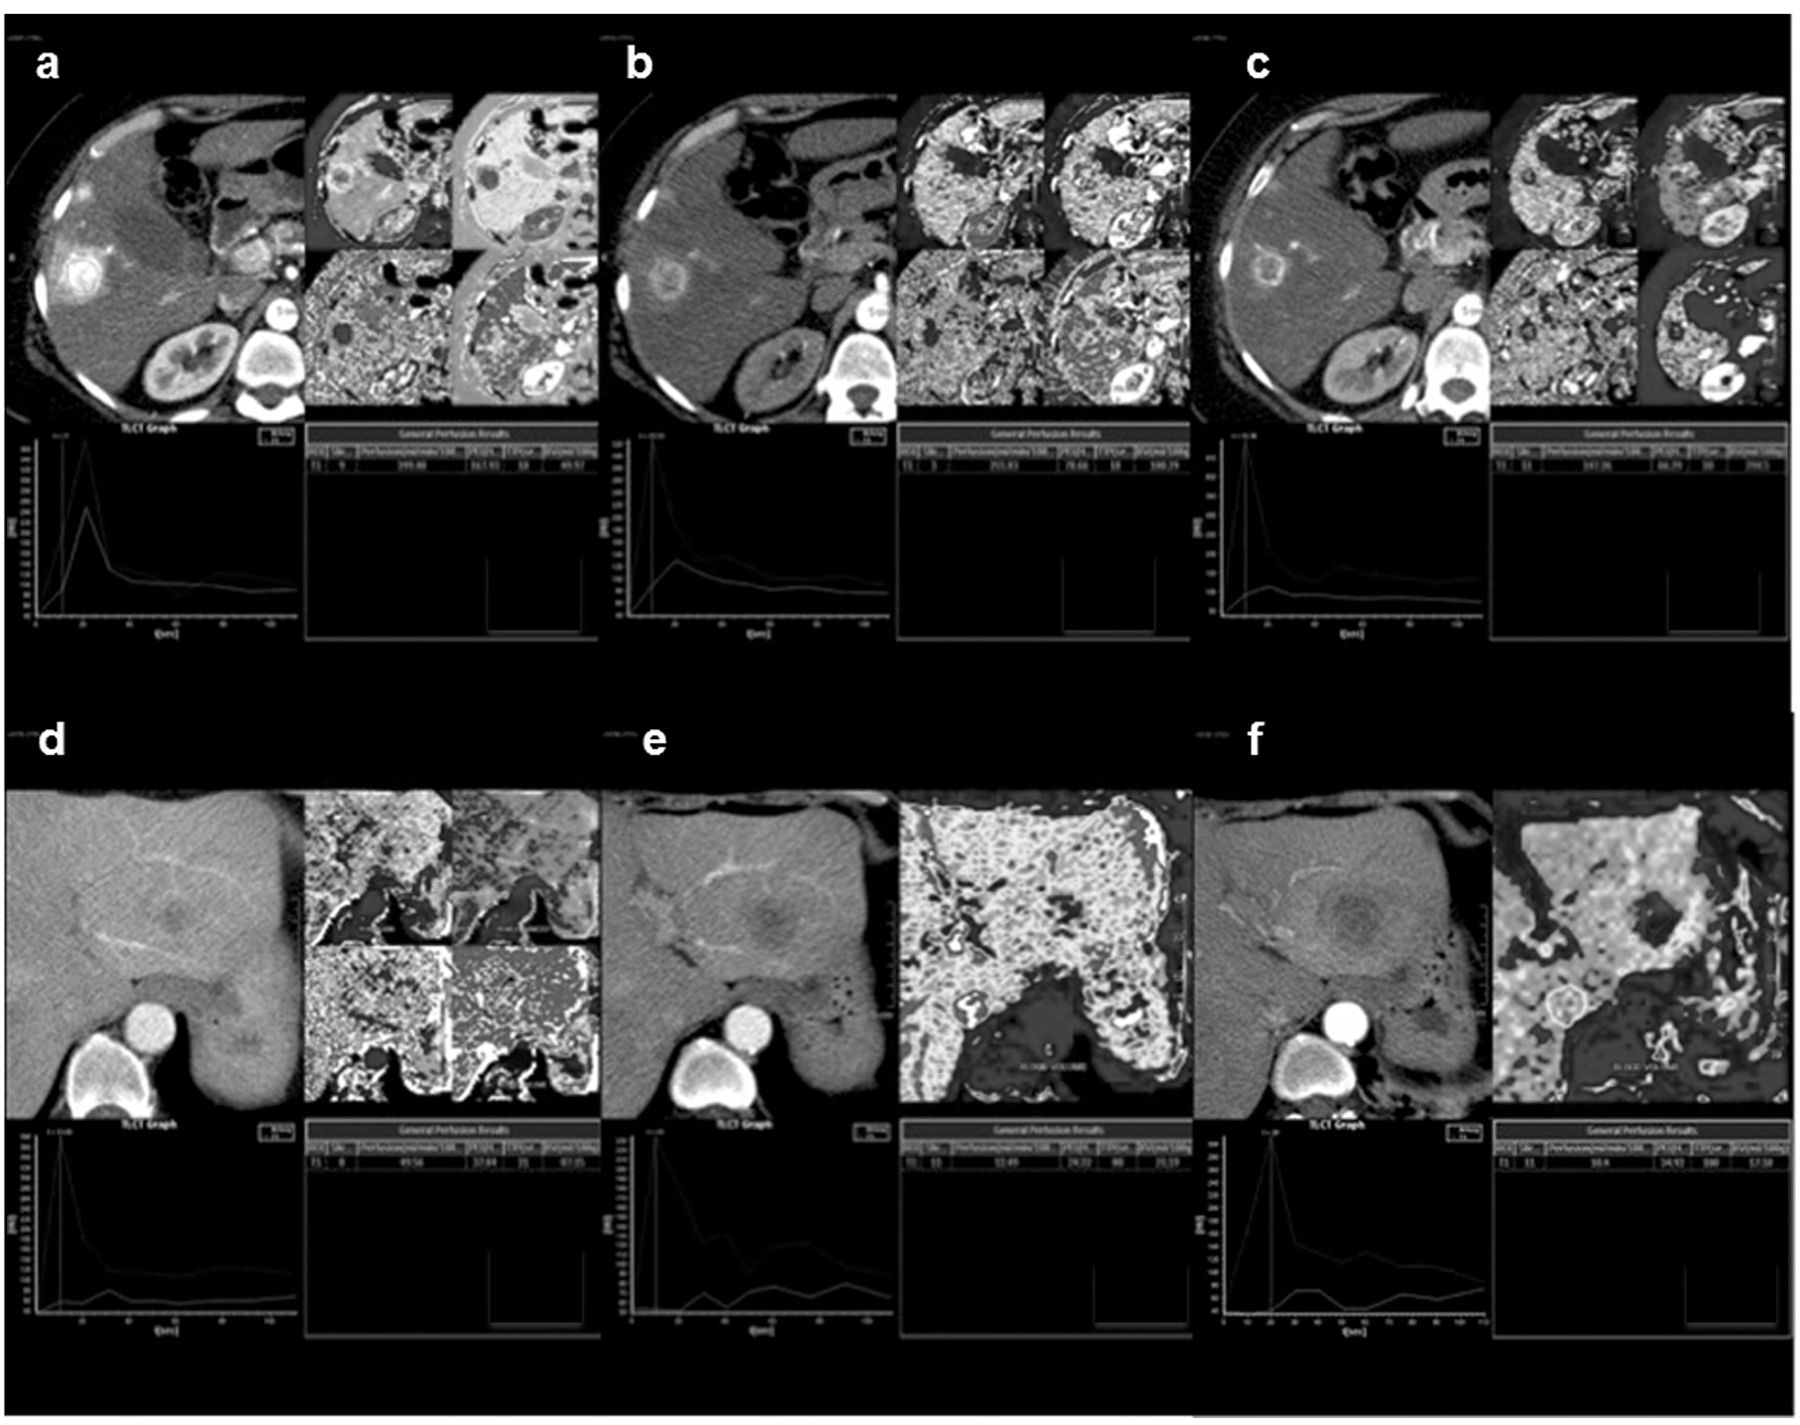
Perfusion computed tomographic (CT) study. Responding liver lesions during everolimus treatment at baseline (a), and after 2 (b) and 4 (c) months of treatment: hypervascular metastasis perfusion CT maps and parameters express in numerical values for quantification and comparison. Non-responding liver lesions during everolimus treatment at baseline (d), and after 2 (e) and 4 (f) months of treatment: hypovascular metastasis perfusion CT maps and parameters express in numerical values for quantification and comparison.
Per-patient analysis. Overall, for this patient cohort, during the treatment period everolimus led to a disease control rate of 77.8% (7/9 patients), with stable disease as best objective response in all cases (no partial responses were observed); the remaining two patients (22.2%) had disease progression during the study. Globally, 6/9 patients had prolonged benefit from everolimus treatment (>11 months) and were, therefore, considered responders; three patients obtained minimal benefit (disease control for less than 11 months, one patient) or no benefit (two patients) from everolimus and were considered non-responders. Considering the per-patient evaluation, the majority of patients (6/9, 67%) had hypervascular lesions at T0 that remain unchanged at T1. Among these patients, in the majority (4/6, 67%) lesions remained hypervascular at T2. The intra-patient lesion heterogeneity was, therefore, low at baseline and subsequently increased.
Per-lesion analysis: Morphology and vascularization. At baseline, the mean maximum diameter of target lesions was 17.8±7.4 mm (range=9-31.5 mm). After two months of everolimus treatment (T1), 5/33 target lesions had an increase greater than 20% of their maximum diameter, one of them showed diameter reduction at T2; the remaining 28 target lesions were substantially stable (no >20% increase nor >30% decrease). At T2, 6/33 lesions had increased in size by >20%; the remaining 27 target lesions, with one lesion that increased at T1 but showed a diameter reduction at T2, were substantially stable (no >20% increase nor >30% decrease). Imaging studies conducted beyond the end of the P-CT study period confirmed dimensional stability for at least 11 months in 23/33 target lesions, which were therefore considered responding lesions. Responder lesions were significantly larger than non-responder lesions at baseline (mean diameter: 20.7±6.4 vs. 11.2±4.8 mm, p<0.001). Qualitative analysis of such lesions conducted at baseline classified 22/33 lesions (63.7%) as hypervascular, 8/33 (24.2%) as isovascular and 4/33 (12.1%) hypovascular. After 2 months of therapy (T1), 22/33 lesions (66.7%) were hypervascular, 6/33 (18.2%) isovascular and 5/33 (15.1%) hypovascular; after 4 months (T2), 17/33 lesions (51.5%) resulted hypervascular, 5/33 (15.1%) isovascular and 11/33 (33.4%) hypovascular. Hypervascular lesions more frequently responded to treatment compared with iso/hypovascular lesions (76.2% vs. 58.3%), although this difference was not statistically significant (p=0.43). When considering only hypervascular lesions, the baseline maximum diameter remained significantly associated with response, with responding lesions being larger than non-responding lesions (20.6±5.8 mm vs. 10.9±5.7 mm, p=0.004).
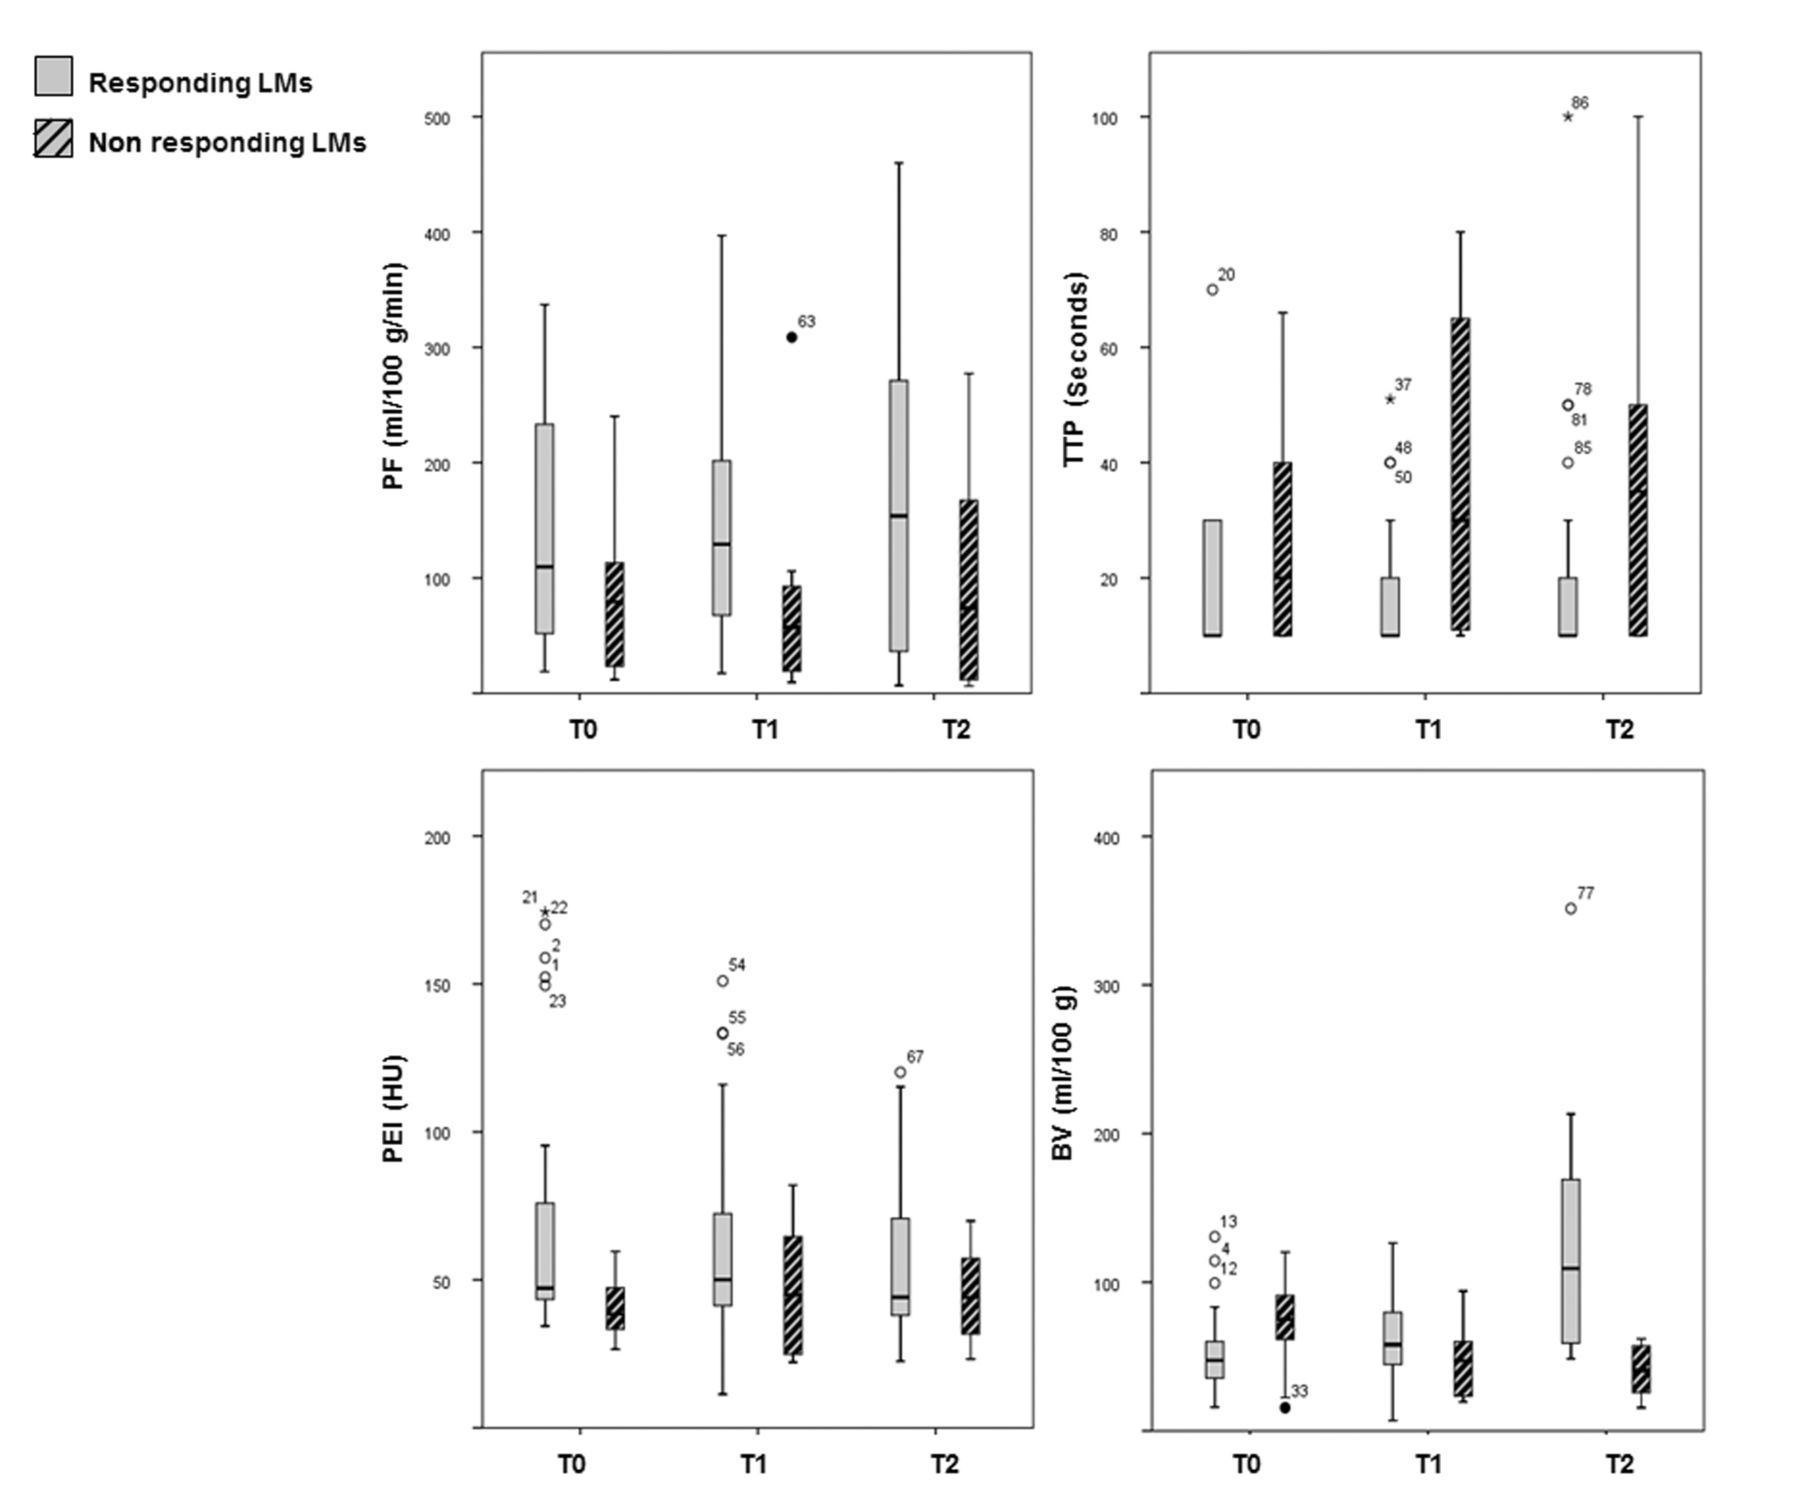
Perfusion. P-CT study was performed in all cases (Figure 1). Baseline and treatment values of perfusion parameters were recorded and analyzed (Table I). At baseline, responding lesions had higher perfusion values compared to non-responding lesions (mean: 148.1±111.8 vs. 82.8±68.2 ml/100 g of tissue/min, respectively; p=0.098). Over time, perfusion slightly increased in both responder and non-responders, although without statistical significance (p=0.731 and p=0.607, respectively). When considering perfusion modifications as a categorical variable (decrease vs. stability/increase), no differences were found at T1 (p=0.678), T2 (p=0.341), or at any point during the study treatment (p=0.283) between responding and non-responding lesions (Figure 2). In terms of TTP, responder and non-responders did not differ at baseline (mean±SD=19.6±14 vs. 25.8±18 s, respectively; p=0.289). Over time, mean TTP values initially decreased and subsequently increased in responding lesions (p=0.648), while non-responding lesions increased early (T1) with subsequent stabilization (p=0.444). This led to an observed significant difference (Figure 2) in mean TTP values at T1 between responder and non-responders (p=0.002), which was lost at T2 (p=0.078). Increase in TTP, as a categorical variable, from baseline to T1 was significantly more frequent in non-responding than in responding lesions (p=0.032), while from T0 to T2 no significant difference was found (p=0.592). An increase in TTP at any time during the study period was noticed more frequently in non-responding lesions (80%) than in responding lesions (43.5%), with borderline statistical significance (p=0.053). At baseline, PEI was significantly higher (Figure 2) in responding compared to non-responding lesions (mean=72.8±49.2 versus 39.4±10.1 HU; p=0.043). Mean PEI values progressively decreased in responding lesions (p=0.06), but not in non-responding ones (p=0.523). Frequency of PEI decrease from baseline to T1 in responding lesions compared to non-responding ones did not significantly differ (69.6% vs. 40%, respectively, p=0.110), nor from baseline to T2 (65.2% vs. 40%, respectively, p=0.178). However, in general, a PEI decrease at any time of the study period was significantly more frequent in responding compared to non-responding lesions (82.6% and 40%, respectively; p=0.014). Although no differences were found in mean BV values between responding and non-responding lesions at baseline (p=0.121) nor at T1 (p=0.150), at T2, the mean BV value for responding lesions was significantly higher compared to non-responding lesions (p=0.001) (Figure 2). Over time, indeed, mean BV values progressively, significantly increased in responding lesions (p=0.001) and decreased in non-responding lesions (p=0.111). When considering BV modifications as a categorical variable (increase vs. stability/decrease), we found a significant difference between the two groups even at T1 (p=0.004), that was subsequently confirmed at T2 (p<0.001); in general, a BV increase at any point of the study treatment was more frequent in responder than in non-responder lesions (p=0.001). Considering that BV and PEI exhibited the most sustained significant modifications during treatment, sensitivity, specificity, PPV and NPV and accuracy were calculated (Table II) and therefore these parameters could be used for early assessment of treatment response using P-CT.
Baseline and on treatment perfusion parameters. Mean (SD) values are reported. Differences between responding and non-responding lesions were assessed by means of one-way ANOVA: Peak enhancement intensity (PEI) was the only perfusional parameter that significantly differed between the two groups at baseline.

Perfusion parameters in responding and non-responding liver metastases (LMs) are reported at baseline (T0), and after 2 (T1) and 4 (T2) months of everolimus treatment. Box-plots show the median values and range for perfusion parameters in all responding and non-responding LMs during treatment. PF: Perfusion; TTP: time to peak; PEI: peak enhancement intensity; BV: blood volume.
Discussion
P-CT is an imaging technique able to quantify tissue vascularization and perfusion. Preliminary studies have suggested a role for P-CT in predicting early response to anti-angiogenic therapies in PanNETs. Two studies evaluated the role of P-CT as a functional biomarker of treatment response in well-differentiated NETs of different sites of origin. Ng et al. evaluated 24 patients treated with bevacizumab or interferon (12). Bevacizumab induced a significant reduction in mean blood flow and BV compared with baseline. Yao et al. evaluated 39 patients treated with bevacizumab and everolimus, alone and in combination (14). In their study, the absolute decrease in tumor perfusion following bevacizumab and everolimus correlated with that at baseline, and treatment led to a proportional decrease in such parameters. However, single-agent everolimus was associated with only a non-statistically significant decrease in perfusion. Everolimus, an inhibitor of the mammalian target of rapamycin (mTOR), has indirect anti-angiogenic activity through the modification of gene expression and intracellular activity mediated by the inhibition of the phosphatidylinositol-4,5-bisphosphate 3-kinase/protein kinase B/mTOR pathway, finally leading to in vitro inhibition of endothelial and stromal cells growth, and reduction of VEGF release from tumor cells (16).
Statistical outcomes for relevant perfusional parameters.
In our study, the morphological analysis led to the observation, as expected, of a prevalent hypervascular pattern of liver metastases from PanNET; although lesions classified as hypervascular at baseline seemed more likely to respond, there was no significant association between qualitative/visual analysis of vascularization and response to treatment (hypervascular vs. iso/hypovascular, p=0.433). Responding lesions were significantly larger than non-responding lesions at baseline both for the whole group (p<0.001) and in the subset of hypervascular lesions (p=0.004). The perfusion analysis demonstrated that at baseline, only PEI was significantly correlated with response, being significantly higher in responding compared to non-responding lesions (p=0.043). The few number of cases included does not allow us to propose possible predictive cut-offs, but this observation deserves further study.
Treatment with everolimus led to relevant modifications in three out of four P-CT parameters: TTP, PEI and BV. Considering TTP, an early (T1) increase was observed in non-responding lesions, leading to higher mean TTP values in non-responder compared to responder lesions at T1 (p=0.002); however, such between-groups difference was not maintained at T2 (p=0.078), and a TTP increase at any time during the study period was not significantly associated with response. On the contrary, a constant, borderline significant decrease in PEI was observed in responding but not in non-responding lesions, and a PEI decrease at any time of the study period was significantly associated with response (p=0.014). The most relevant and sustained post-treatment perfusion modification was observed for BV. Although no differences were found in mean BV values between responding and non-responding lesions at baseline (p=0.121), an early and significant trend towards BV increase was observed both at T1 (p=0.004) and T2 (p<0.001) in responding lesions. Higher absolute mean values, comparing responding versus non responding lesions, were observed at T2 (124.11±73.75 and 39.9±17.52 ml/100 g of tissue, respectively; p<0.001).
Understanding intratumoral vascular changes during everolimus treatment needs to take into account pharmacodynamics in respect to other targeted agents. In fact while bevacizumab induces regression and normalization of tumor vascularization and inhibition of neo-vascularization with a reported BV decrease (12-14), everolimus leads to inhibition of endothelial and stromal cells growth, possibly with a disruption of the vascular integrity and blood leakage into the extravascular space. BV, as milliliters of contrast material per 100 g of tissue, increases in relation to increasing permeability. Intratumoral contrast medium accumulation, detected as BV, seems therefore the most early and sustained modification detectable by P-CT associated with everolimus treatment benefit. Such modification has extremely high accuracy and PPV for response, even at an early evaluation, after 2 months of therapy (accuracy: 75.76%; PPV=89.47%), performing even better after 4 months (84.85% and 90.91%, respectively); the integration of other perfusion parameter modifications, such as PEI decrease, did not improve the predictive strength of BV increase (Table I). Interestingly, these perfusion modifications are detectable earlier than the size modifications required by standard response criteria.
This study has several limits. First of all, the number of patients evaluated with P-CT was relatively small; for this reason, our observations should be seen as hypothesis-generating, to be confirmed by further prospective studies. Another main limitation of this study lies in our arbitrary definition of ‘responder’ patient or lesion on the basis of a dimensional stability lasting at least 11 months, derived from the modified PFS observed in the registrative trial of everolimus in PanNETs (4).
Conclusion
Everolimus treatment leads to modification of P-CT parameters in liver metastases from PanNET. An early and significant increase of BV by P-CT seems to be the most relevant and sustained modification that may be associated with response to treatment. The present study suggests that P-CT may have a role in better and earlier stratification of patients with tumor response to treatment.
- Received December 15, 2016.
- Revision received January 27, 2017.
- Accepted February 2, 2017.
- Copyright© 2017, International Institute of Anticancer Research (Dr. George J. Delinasios), All rights reserved