

Abstract
Background/Aim: To compare the relationship between Ktrans from DCE-MRI and K1 from dynamic 13N-NH3-PET, with simultaneous and separate MR/PET in the VX-2 rabbit carcinoma model. Materials and Methods: MR/PET was performed simultaneously and separately, 14 and 15 days after VX-2 tumor implantation at the paravertebral muscle. The Ktrans and K1 values were estimated using an in-house software program. The relationships between Ktrans and K1 were analyzed using Pearson's correlation coefficients and linear/non-linear regression function. Results: Assuming a linear relationship, Ktrans and K1 exhibited a moderate positive correlations with both simultaneous (r=0.54-0.57) and separate (r=0.53-0.69) imaging. However, while the Ktrans and K1 from separate imaging were linearly correlated, those from simultaneous imaging exhibited a non-linear relationship. The amount of change in K1 associated with a unit increase in Ktrans varied depending on Ktrans values. Conclusion: The relationship between Ktrans and K1 may be mis-interpreted with separate MR and PET acquisition.
- MR/PET
- dynamic contrast enhanced-MRI
- 13N-NH3 PET
- perfusion parameter
- rabbit
Dynamic contrast-enhanced magnetic resonance imaging (DCE-MRI) parameters are widely used for assessment of treatment response to anti-angiogenic drugs in both preclinical studies and clinical trials (1, 2). The main advantages of DCE-MRI are its high spatial resolution and nonuse of ionizing radiation (3, 4). However, absolute quantification of flow is difficult and interpretation of DCE-MRI data is complicated. Dynamic 13N-NH3 positron emission tomography (PET) primarily reflects blood flow because NH3 has a high extraction fraction; therefore, interpretation 13N-NH3 PET parameters is more straightforward (5, 6). While dynamic 13N-NH3 PET has been clinically utilized in myocardial perfusion imaging (5, 6), its utility in tumor imaging is under-investigated. However, several reports involving this technique have demonstrated promising results in the diagnosis of brain tumors and fibrosarcomas (7-10). Knowledge of the quantitative perfusion parameters of dynamic 13N-NH3 PET and the relationship between MR and PET parameters might enhance our understanding of angiogenesis and vascular permeability (11).
With the recently introduced hybrid MR/PET, DCE-MRI and dynamic 13N-NH3 PET images can be obtained simultaneously with perfect temporal and much improved spatial co-registration (12-14). The simultaneity of hybrid MR/PET systems offers several advantages over separate MR and PET and PET/computed tomography (15, 16), including precise patient alignment, recording of dynamic phenomena, tissue information under identical physiologic state from both modalities, and better localization of PET signals in soft tissues (17). In terms of patient alignment, a previous study reported better alignment quality with simultaneous MR/PET than with retrospective fusion of MR and PET data (18). However, there is a paucity of studies evaluating the simultaneity of hybrid MR/PET systems based on functional information and verifying its clinical implications. The purpose of this study was to compare the relationship between Ktrans from DCE-MRI and K1 from dynamic 13N-NH3-PET, with simultaneous and separate MR/PET in the VX-2 rabbit carcinoma model.
Materials and Methods
Animal model. This study was approved by the Animal Care and Use Committee in our institution (Permit number: 13-0394-C1A1(3)). Eight adult New Zealand white rabbits weighing 3.0-3.5 kg, were included in this study. The rabbit VX2 tumor model was chosen for the following reasons; (i) it is a reliable transplantable tumor model that has not been well established in large animals (19), (ii) rodents are too small in size to obtain reliable perfusion parameters with MR/PET; (iii) many previous studies have employed the rabbit VX2 tumor model for DCE-MR imaging (20, 21) and the preclinical animal experimental center of our institute periodically inoculates VX2 cells into the thigh muscles of New Zealand White rabbits to maintain in vivo passages of VX2 cells, thus making the cells easily accessible for this study.
Prior to tumor implantation, animals were sedated by intravenous injection of 5 mg/kg of a 1:1 combination of tiletamine hydrochloride and zolazepam (Zoletil; Virbac, Carros, France) and xylazine hydrochloride (Rompun 2%; Bayer Korea, Seoul, Korea). After anesthesia and shaving of the paravertebral area, 0.2 ml of a suspension of finely minced fresh VX2 tumor was implanted in the left paravertebral muscle at the level of heart, using 16-gauge Medicut needles under ultrasonographic guidance. The heart was required to be within the scan range in order to measure the arterial input function of dynamic PET. Two weeks after tumor implantation, the VX2 tumors were expected to be approximately 2 cm along the longest dimension, appropriate for tumor perfusion imaging. Each rabbit was subjected to MR/PET (Biograph mMR, Siemens Healthcare, Erlangen, Germany) on two successive days 14 days after tumor implantation. All efforts were made to minimize the suffering of animals during tumor implantation and MR/PET.
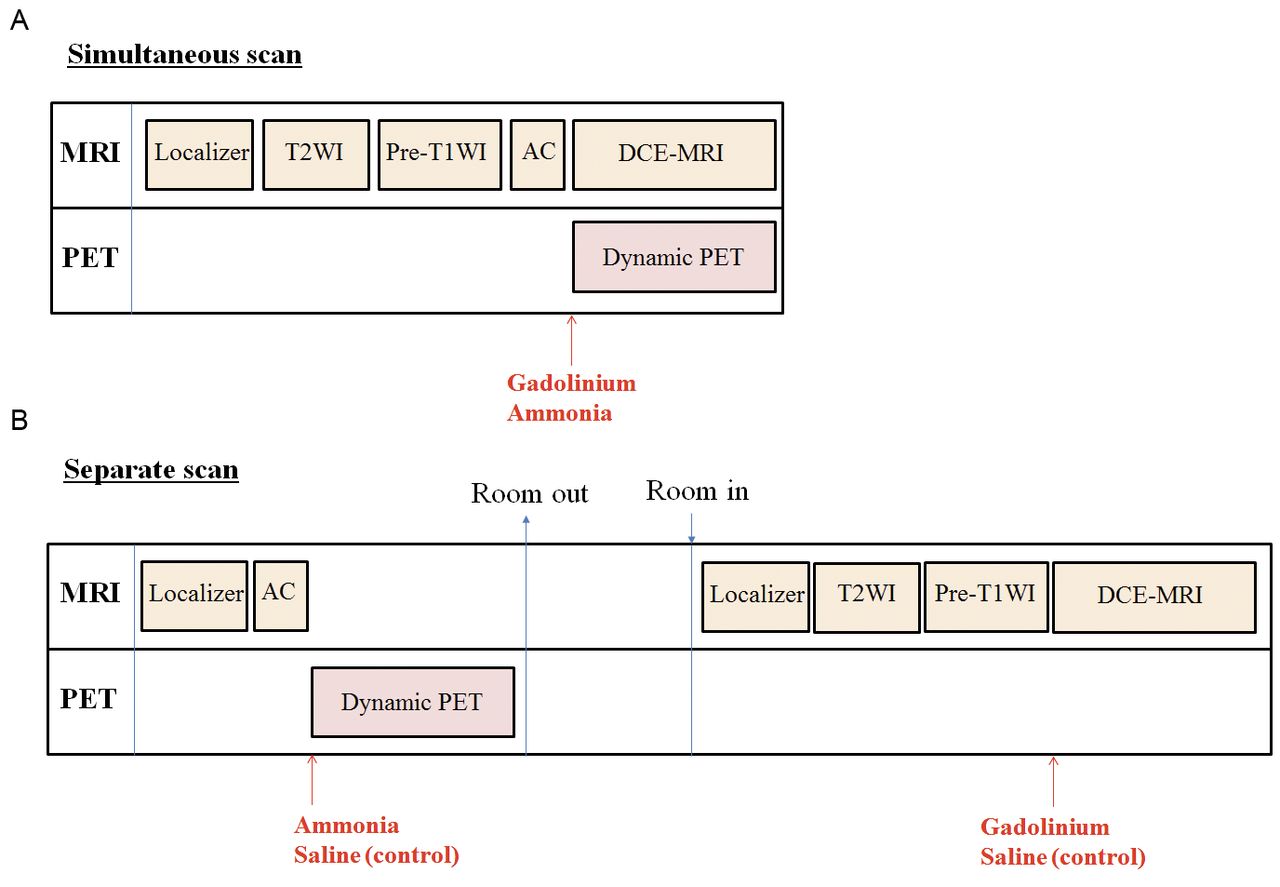
MR/PET. Rabbits were anesthetized, and a 20-gauge intra-venous cannula (Medicut) was inserted into the right marginal ear vein before the start of MR/PET. The MR/PET acquisition protocol is illustrated in Figure 1. Simultaneous MR and PET image acquisition was performed 14 days after tumor implantation. For dynamic MR/PET, 0.2 mmol/kg gadoterate meglumine (Dotarem; Guerbet, Bloomington, IN, USA) and 111 MBq 13N-NH3 were hand injected simultaneously using three-way stopcocks, followed by 8 ml saline chaser. Since we planned on examining two rabbits per synthesis of 13N-NH3 (up to 200mCi/cassette), the total injection volume of MR and PET contrast media was made up to 2 ml by dilution with normal saline to maintain uniform concentration of MR contrast media at every examination. Contrast media was injected slowly over a 30-s duration. The total scan time was approximately 25 min. Separate MRI and PET image acquisition was performed 15 days after tumor implantation. After completion of PET, the rabbits were removed from the MR/PET scanner and placed back inside the scanner approximately 60 minutes later. The animals were positioned on their back at the same level as the MRI table. The injection dose, volume and method of MR and PET contrast media were maintained the same between simultaneous and separate imaging. However, during separate MR and PET, 2 ml normal saline was hand injected simultaneously as the control. The total examination time for separate imaging was approximately 40 min. Scanning parameters for PET and MRI were maintained the same for simultaneous and separate imaging, as described below.
DCE-MRI parameters. All MR images were acquired using dedicated head and body coils approved for MR/PET at the same time. T2-weighted imaging (T2WI) was performed with the following parameters: repetition time/echo time (TR/TE), 4100/87 ms; matrix size, 128×128; slice thickness, 3 mm; and field of view (FOV), 130×130 mm. Pre-T1-weighted (T1W) images were acquired with a gradient echo sequence (weighted volumetric interpolated breath-hold examination [VIBE]) at each of the four flip angles for T1 mapping using the following parameters: TR/TE 4.4/1.1 ms; flip angles (α=2°, 5°, 10° and 15°); matrix size 128×128; slice thickness 3 mm; number of slices 20; and 130×130 mm. Using the VIBE sequence, DCE-MR images were obtained at 5 s of temporal resolution with the following parameters: TR/TE, 3.5/1.5 ms; flip angles (α=11°); matrix size 128×128; slice thickness, 3 mm; number of slices, 20; and FOV, 130×130 mm. The total acquisition time of dynamic scan including the first six phases of pre-contrast images was 10 min.
Dynamic 13N-NH3 PET parameters. An approximately 20-s T1W Dixon gradient-echo sequence image in the coronal plane was first acquired for attenuation correction. Then, the emission protocol of a 10-min dynamic scan (6×5 s [precontrast]); 12×5 s; 3×10 s; 6×30 s; 2×60 s; and 1×180 s) was implemented. The 30-s precontrast phase was included to maintain uniformity between dynamic 13N-NH3 PET and DCE-MRI. Dynamic PET images were reconstructed by point spread function modeling.
Image analysis. One board, certified radiologist (K.H.L.), with four years of experience after board certification) measured the long and short diameters of tumors on axial T2WI. In addition, the same radiologist manually drew region-of-interests (ROIs) on the left ventricle and tumors on DCE-MR images using MRIcro (http://www.sph.sc.edu/comd/rorden/mricro.html). To derive individual arterial input function (AIF) curves, ROIs were drawn in the left ventricle in three or four different image slices in the peak arterial enhancement phase of imaging. The radiologist also manually drew ROIs on tumors by outlining the entire tumor boundary as delineated by contrast enhancement in all involved MR slices containing the tumor.
In-house software program development. We developed an in-house software program using customized matrix laboratory (MATLAB) scripts (The Mathworks Inc., Natick, MA, USA) to generate Ktrans and K1 maps on ROI- and voxel-level from DCE-MRI and 13N-NH3 PET using individual AIF curves. For simultaneous image acquisition, the MR and PET data were resampled to match the image coordinates and dimensions. For separately acquired MR and PET images, registration was processed using SPM software (Statistical Parametric Mapping, SPM12). The details of the in-house software program are described below.

Schematic drawing of the MR/PET acquisition protocol. (A) Simultaneous MR/PET acquisition and (B) Separate MR and PET acquisition 14 and 15 days after tumor implantation, respectively.
Tumor perfusion parameters from DCE-MRI. i) Pre-processing of T1 signals in DCE-MRI: Baseline T1 signal was measured using pre-T1 images acquired at four different flip angles. Three-dimensional (3D) R10 and S0 maps were calculated based on the Ernst formula (TE << T2*) using four sets of gradient recalled echo (GRE) images with different flip angles. A linear least square method was used for calculation of the 3D R10 and S0 maps (22). ii) Estimation of contrast agent concentration time curves: Four-dimensional (4D; x, y, z, t) post-injection longitudinal relaxation rate (R1(t)) maps were calculated for each dynamic phase using signal intensity data from the pre- and post-contrast T1W-GRE dynamic series:
 where α=11°; TR=3.5 seconds;
 and S(0) and S(t) are the signal intensities of images in the 4D T1W-GRE dynamic series before and after contrast injection. 4D gadoterate meglumine concentration maps (x, y, z, t) in tissues [Ct(t)] were calculated from 4D R1(t) maps as follows: R1(t)=R10+r1xCt(t), where r1 is the experimentally determined relaxivity of gadoterate meglumine and r1=4.5 mM−1s−1 (at 37°). iii) Determination of individual AIF: For each patient, concentration maps in blood (Cb(t) maps) were calculated based on the ROI in the left ventricle. Concentration maps in the plasma (Cp(t) maps) were calculated from Cb(t) maps using the following equation, where hematocrit (Hct) was 0.4:
 iv) Parameter estimation for a given compartmental model: 3D perfusion parameter (Ktrans) maps were calculated from the Cp(t) and 4D C(t) maps using the single-tissue compartment modified Tofts model:

Tumor perfusion parameters from 13N-NH3 PET. Perfusion parameters from 13N-NH3 PET were calculated using several different methods. First, they were quantified using a 2-tissue (2TCM) or 1-tissue (1TCM) compartment model. Goodness-of-fit factors (the Akaike information [AIC], Schwartz [SC], and model selection [MSC] criteria) were calculated for comparison of 1TCM and 2TCM perfusion parameters. Second, at the ROI-level, perfusion parameters were estimated from a single time-activity curve (TAC) of ROI or by averaging the parameters of voxels within the ROI. i) Two-tissue compartment model (2TCM): As in the equation for DCE-MRI parameters, Ca(t) is the concentration of 13N- NH3 in arterial blood and Ct(t) is the concentration of tracer in tissues. This model, which assumes that 13N in tissue is in a freely diffusible (Ce) (intra- and extravascular) or a metabolically trapped (Cm) state, can be expressed as:

Since the rate of diffusion of 13N- NH3 across the capillary wall is high, the rate constant K1 is an indicator of blood flow. To address the issues of spillover and partial-volume recovery, it was assumed that Ct(t)=(1−Va)•Ct(t)+Va•Ca(t) where Ct(t) is the concentration of tracer in tissues; Va is a real number between 0 and 1; and (1−Va) is a regional estimate of the tissue partial-volume recovery coefficient. 13N-NH3 PET perfusion parameters (K1) were estimated using a generalized linear least square method (23). ii) One-tissue compartment model (1TCM): This model assumes that 13N is present either in blood (Ca) or in tissues (Ct) and can be expressed as:
 Using this model, 13N-NH3 PET perfusion parameters (K1, k2) were estimated using the linear least square method. iii) Voxel-matching of parametric maps from DCE-MRI and 13N-NH3 PET: The voxel resolutions of DCE-MRI and 13N-NH3 PET were 1.03×1.03×3 mm and 1.4×1.4×1.4 mm, respectively. For voxel-wise comparison of perfusion parameters between the two methods, parametric map images from PET were re-sliced into the same resolution as those from DCE-MRI using SPM software. Thus, the TACs and input functions at each tumor voxel for both PET and MR images were obtained using the same masking image.
Statistical analysis. Pearson's correlation coefficients between MR and PET perfusion parameters were calculated. The adjusted correlation coefficients were calculated in ROI- and voxel-level by the method of Bland and Altman (24, 25) which accounts for the lack of independence among repeated measurements. Correlation coefficients were interpreted as follows; 0-0.3, negligible; 0.3-0.5, low positive; 0.5-0.7, moderate positive; 0.7-0.9, high positive; and 0.9-1.0, very high positive correlation (26). The relationship between MR and PET perfusion parameters on ROI-level was analyzed using a linear/nonlinear regression function. Reproducibility of MR and PET parameters between two successive days on ROI-level were estimated using intra-class correlation coefficients (ICC) by two-way mixed-effects analysis, and ICCs of individual consistency-of-agreement were interpreted as follows; 0-0.2, poor; 0.2-0.4, fair; 0.4-0.6, moderate; 0.6-0.8, good; and 0.8-1.0, excellent correlation. Data analyses were performed using the Stata software package (version 14; Stata, College Station, Tex).
Results
Of the eight rabbits, one died from air-embolism during the 10-min dynamic MR/PET examination. The remaining seven rabbits successfully underwent MR/PET and were sacrificed after the second MR/PET imaging session by intravenous injection of 5 ml potassium chloride while under deep anesthesia. Unfortunately, because of some error in storage of the raw data of two rabbits, the final analysis included only five rabbits. Representative MR/PET images, arterial input function, and parametric maps are shown in Figures 2 and 3.
Rabbit tumor characteristics. VX2 tumors were successfully grown in all five rabbits. The characteristics of rabbit tumors, including tumor size and mean±standard deviation of MR and PET perfusion parameters, are summarized in Table I. The number of ROIs outlining the tumors ranged from 12 to 18 per rabbit (total, 71 ROIs).
Dynamic NH3 PET modeling. The AIC, SC, and MSC values of 1TCM and 2TCM are shown in Table II. The 1TCM model was found to be more appropriate model, given its lower AIC and SC values and greater MSC values in comparison to those of the 2TCM model.
Correlation coefficients between between Ktrans and K1. Assuming a linear relationship, there was a positive correlation between MR (Ktrans) and PET (K1) perfusion parameters at the ROI- and voxel-levels (Table III). At the ROI-level, MR and PET perfusion parameters exhibited moderate positive correlations with simultaneous (r=0.54-0.57) and separate (r=0.53-0.69) imaging. At the voxel-level, the two sets of parameters exhibited only negligible correlations with simultaneous (r=0.24) and separate (r=0.16-0.18) imaging.
Relationship between Ktrans and K1. While the Ktrans and K1 from separate imaging exhibited a linear relationship, those from simultaneous imaging exhibited a nonlinear relationship (Figure 4). The amount of change in K1 associated with a unit increase in Ktrans varied depending on the values of Ktrans.
Reproducibility of Ktrans and K1. While the ICCs of Ktrans between simultaneous and separate imaging revealed fair agreement (ICC, 0.29-0.31), those of PET parameters (K1) demonstrated moderate agreement (ICC, 0.44-0.49) (Table IV).
Discussion
In this study, Ktrans and K1 exhibited moderate positive correlations with both simultaneous (r=0.54-0.57) and separate (r=0.53-0.69) imaging at the ROI-level, under the assumption of linear relationship between PET and MR parameters, as demonstrated with separate image acquisition. However, careful examination of the association between MR and PET parameters from simultaneous imaging revealed a non-linear relationship between Ktrans and K1. The amount of change in K1 associated with a unit increase in Ktrans varied depending on the values of Ktrans.
We believe that a more robust investigation of the relationship between MR and PET perfusion parameters is possible with simultaneous MR/PET than with separate acquisition. Simultaneity is one of the most powerful merits of hybrid MR/PET imaging in comparison with separate PET and MRI or PET/CT, which involves CT followed by PET, hoping that the subject does not move between the two procedures. However, hybrid MR/PET has not been thoroughly investigated, especially in terms of its ability to acquire in vivo functional information, although its necessity has been recently suggested (14, 27). Simultaneous acquisition not only saves time but also enables better alignment quality (18) and precise evaluation of the relationship between MR and PET parameters under identical tissue microenvironments. Assuming the simple linear correlation between Ktrans and K1 based solely on separate MR and PET images might result in misinterpretation of the relationship between the two sets of parameters.

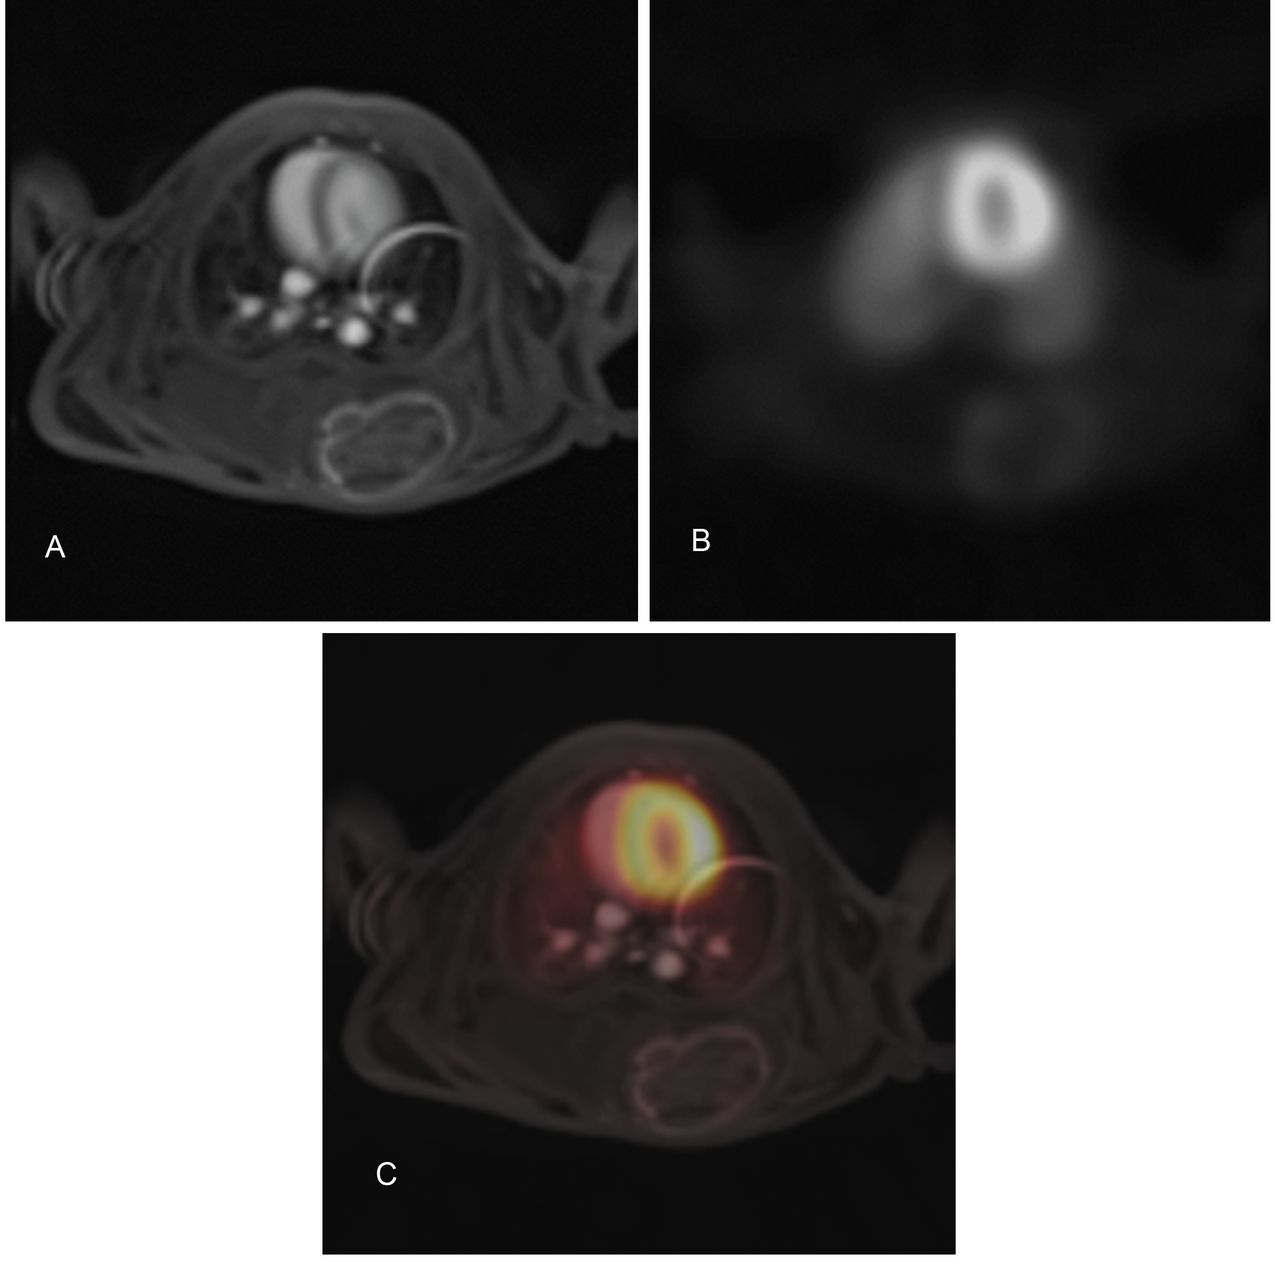
An example of the MR and PET images. (A) Dynamic contrast-enhanced MR, (B) 13N-NH3 PET, and C: Fused MR/PET images with simultaneous MR/PET acquisition 14 days after tumor implantation.
Validation of CT and MRI perfusion parameters has been performed mostly in brain and myocardial imaging (28, 29). Unlike perfusion imaging of the myocardium or the brain, there has been no established gold-standard imaging method for tumor perfusion because of the possibility of tissue-dependent pathologic vascular abnormalities, such as vascular leakage, shunting, or malformation (30, 31). Instead, validation against histopathological findings such as microvessel density or vascular endothelial growth factors has been attempted for some tumors; however, the results were inconsistent and did not accurately reflect true tumor perfusion in vivo (32, 33). Furthermore, pathologic perfusion markers do not reflect perfusion in vivo. Therefore, investigation of the relationship between perfusion parameters from two different imaging modalities might serve to cross-validate each parameter. The present results indicate that DCE-MRI perfusion parameters demonstrate a fair amount of blood flow, which is represented by 13N-NH3 PET perfusion parameters. However, since DCE-MRI perfusion parameters are influenced by both blood flow and permeability, the amount of change in K1 associated with a unit increase in Ktrans was not always the same. In our study, voxel-level analysis revealed only the negligible correlation between the two parameters. The limited resolution and blurring of PET images might explain this weak correlation on voxel-level and discrepancy between the voxel- and ROI-level analysis.
Summary of tumor characteristics in five rabbits.
While 13N-NH3 PET has been used in myocardial perfusion imaging, only a few studies have examined its utility in tumor imaging (7-10). Prior studies have demonstrated that 13N-NH3 PET might be a useful imaging tool for semi-quantitative evaluation of tumor perfusion (7-9). Since this is the first study involving quantitative dynamic 13N-NH3 PET in tumor imaging, we estimated perfusion parameters using two different tissue-compartment models. Although the 2TCM has been widely used in myocardial perfusion, our data indicated that the 1TCM was more appropriate for tumor imaging. This difference might be attributable to the faster circulation time of rabbits and differences in microenvironments and vascular abnormalities within the tumor.
Goodness-of-fit parameters of the 1-tissue compartment model (1TCM) and 2-tissue compartment model (2TCM) in 13N-NH3 PET.
Correlation coefficient between MR and PET perfusion parameters with simultaneous scan and separate scan.

Parameteric maps of Ktrans and K1. (A) A representative ROI outlining the entire tumor boundary drawn by a board-certified radiologist on DCE-MRI. (B) Arterial input function curve, and (C) Ktrans map of DCE-MRI. D: Arterial input function curve, and E: K1 map of dynamic 13N-NH3 PET using 1-tissue compartment model.
In the present study, the values of K1 (ICC, 0.44-0.49) were more reproducible than those of Ktrans (ICC, 0.29-0.31). However, the reproducibilities of K1 and Ktrans in this study were relatively low when compared to those reported in several previous studies (34-36). Since the reproducibility of perfusion parameters may vary according to the calculation method (37, 38), we speculate that the low reproducibility observed in the present study could be due to the one-day gap between simultaneous and separate imaging, calculation of pre-T1 values, estimation of individual AIF or TACs and manual contrast media injection. In addition, in correspondence with the present results, recent studies have demonstrated the low reproducibility of perfusion parameters (39, 40).

Scatterplot of ROI values of Ktrans versus K1. (A) Simultaneous MR/PET acquisition, (B) Separate MR and PET acquisition. In each plot, a dotted line represents an equation estimated with a non-linear and linear regression function, respectively.
Reproducibility of MR parameters (Ktrans) and PET parameters (K1) on ROI-level between two successive days.
There are some limitations to the present study. First, this study included a small number of rabbits. We did not perform additional experiments in order to avoid radiation exposure of the experimenters, although the degree of radiation exposure was relatively low (estimated radiation exposure of the experimenters, 0.0125 mSv per 13N-NH3 PET examination). Second, we chose 13N-NH3 as a perfusion marker instead of 15H2O, which is regarded as the gold standard for in vivo estimation of perfusion in the myocardium and brain, for the following reasons: (a) in comparison 15H2O, the longer half-life of 13N-NH3 (10 min) enables more consistent radiotracer injection among the subjects; (b) the main purpose of this study was to compare simultaneous and separate MR/PET, rather than validation of DCE-MRI, and (c) 13N-NH3 PET has been under-investigated as a tumor perfusion marker. Finally, since the volume of blood flow and permeability might vary among tumors, the relationship between K1 and Ktrans might also vary among different tumors.
In conclusion, the relationship between Ktrans and K1 may be mis-interpreted with separate MR and PET acquisition. Simultaneous MR/PET might allow a more robust investigation of the relationship between MR and PET perfusion parameters than with separate imaging.
Acknowledgements
The Authors thank the Medical Research Collaborating Center at Seoul National University Bundang Hospital for statistical analyses.
Footnotes
* These Authors contributed equally to this study.
Financial Disclosure
This research was supported by Basic Science Research Program through the National Research Foundation of Korea (NRF) funded by the Ministry of Education (NRF-2013R1A1A2063746), http://nrf.re.kr/. The funder had no role in study design, data collection and analysis, decision to publish, or preparation of the manuscript.
- Received January 11, 2017.
- Revision received February 20, 2017.
- Accepted February 21, 2017.
- Copyright© 2017, International Institute of Anticancer Research (Dr. George J. Delinasios), All rights reserved