

Abstract
Background: Proliferation index (PI) plays a critical role in distinguishing surrogate biological subtypes of breast cancer and, thus, determining the optimal therapeutic scheme. The commonly applied method of determining PI is visual semiquantitative scoring. The most precise way of PI evaluation is formal counting of nuclei on a digital picture using software equipped with a pointer function. The less time-consuming solution may be using image analysis software enabling automatic counting of nuclei, such as the free web application ImmunoRatio. Materials and Methods: We analyzed a group of 98 patients diagnosed with invasive breast carcinoma. A digital image of the hot-spot was taken from each case. Cell Counter plug-in of ImageJ platform was employed to precisely count brown- and blue-stained nuclei. The same images were analyzed using ImmunoRatio. The results were compared using Pearson's and Spearman's coefficients. The agreement was assessed with Cohen's kappa. Results: Pearson's correlation coefficient was 0.84 (p<0.05), Spearman's correlation coefficient was 0.83 (p<0.05). Moderate agreement was shown by Cohen's kappa calculation (K= 0.47; p<0.05). Conclusion: As many as 26 cases were classified to different biological subtypes depending on the method of PI assessment. Thus, ImmunoRatio needs further improvement to be a reliable diagnostic tool.
- Proliferation index
- Ki-67
- breast cancer
- image analysis
- ImmunoRatio
- ImageJ
- cell counter
Proliferation activity assessment is of significant clinical importance in oncological histopathology. The Ki-67 antigen is a commonly accepted marker of proliferation in routine diagnostics (1, 2). Proliferation activity is determined as the percentage of Ki-67-positive cells among overall cell population; the measurement is commonly known as proliferation index (PI). The routine method of Ki-67 antigen detection is immunohistochemistry.
PI evaluation is particularly important in diagnostics of breast cancer. It results from St. Gallen consensus recommendations commonly applied in Europe. Based on these recommendations, breast cancer is divided into three major categories: luminal-like, HER2-positive and triple-negative (Table I) (1). The luminal-like type is further divided into luminal A-like, B-like and luminal B-HER2-positive. PI value plays a critical role in distinguishing between luminal A and B-like subtype.
Initially, according to St. Gallen 2011 recommendations, cut-off point of ≥14% was used to define luminal B subtype (3). It was later modified at St. Gallen conference in 2013. The 20% cut-off point for PI was accepted by most experts (1). Moreover, tumours positive for estrogen receptor (ER) and with low level of progesterone receptor (PgR) expression (<20%) were included into luminal B-like group regardless of PI. The current St. Gallen 2015 recommendations were published when creating this paper. It is stated there that “it is very difficult to determine …… optimal cutpoint” and that “Ki-67 should be regarded as a continuous marker, reflecting the continuous variation of the proliferation rate” (2). The debate about the strict cut-off value for PI value will be aimless until a consensus on the method of PI assessment amongst pathologists is achieved.
The commonly applied method of determining PI is visual scoring of the sample by a pathologist. In practice, PI is estimated roughly by eye observation. The most precise way of PI evaluation is to take a digital picture and count nuclei one-by-one using software for cell counting. Most of microscopic image analysis programs use a pointer function.
We introduced ImageJ free application with Cell Counter plug-in into our laboratory (4, 5). However, counting nuclei one-by-one is laborious and time-consuming, thus, not useful in laboratories with many cases of breast cancer being diagnosed. The solution may be automatic counting of all the nuclei in the microscope field using software. To date several commercial image analysis platforms with nuclear counting option have been developed. The examples include Aperio (Leica Biosystems), TissuemorphKP (Visiopharm), GenASIs (Applied Spectral Imaging), NuclearQuant (3DHISTECH) and Virtuoso (Ventana).
Surrogate definitions of molecular subtypes of breast cancer according to St. Gallen 2013 consensus (1).
We evaluated the usefulness of ImmunoRatio (2, 6), a free web application for automated image analysis, for determining PI in breast cancer patients examined in the Department of Pathology of the Lower Silesian Oncology Centre in Wroclaw. The aim of this paper is to describe methods and results of ImmunoRatio validation in clinical use.
Materials and Methods
Patients. We analysed a group of 98 patients diagnosed with invasive breast carcinoma in the Lower Silesian Oncology Centre between 2012 and 2013. The material consisted of 50 mammotome biopsies, 19 tru-cut biopsies, 7 lumpectomy, 13 quadrantectomy and 9 mastectomy specimens.
Ethics, consent and permissions. The study was approved by the Bioethical Committee of Wroclaw Medical University and the Director of Lower Silesian Oncology Centre.
Immunohistochemistry. Immunohistochemistry was conducted with monoclonal ready-to-use antibody against human Ki-67 antigen (Clone 30-9; Ventana, Tucson, AZ, USA). The procedure was performed automatically using Ventana Benchmark XT (Ventana), in line with the producer's manual.
Image acquisition. The images were captured using Leica DM1000 microscope equipped with EC3 digital camera (Leica, Wetzlar, Germany) and LAS EZ software (Leica). The image of high-power field (HPF) (objective 40 X) of each selected hot-spot was taken from each case. The white balance was adjusted for each specimen. The images were saved as .jpg files.
Measurements with ImageJ. Cell Counter plug-in of ImageJ platform (http://rsb.info.nih.gov/ij/index.html) was employed to precisely count brown and blue stained nuclei (4, 5). ImageJ is a public domain image analysis program based on Java. It has an open architecture that provides extensibility via user-written plug-ins (7). Being a free open source program, ImageJ has become a widely used image processing tool in many laboratories. We used Fiji distribution of ImageJ whose “main focus …… is to assist research in life sciences” (8).
The number of diaminobenzidine (DAB)- and hematoxylin-stained nuclei was counted in the images of the hot-spots (Figure 1). The Ki-67-positive nuclei were included regardless of staining intensity, in line with the Recommendations from the International Ki67 in Breast Cancer Working Group (9). The DAB-stained nuclei were divided by the sum of DAB- and hematoxylin-stained nuclei and converted into percentage format using Microsoft Office Excel 2007 (www.youtube.com/watch?v=xpMJRuFSIFw). The results were treated as reference values of PI.
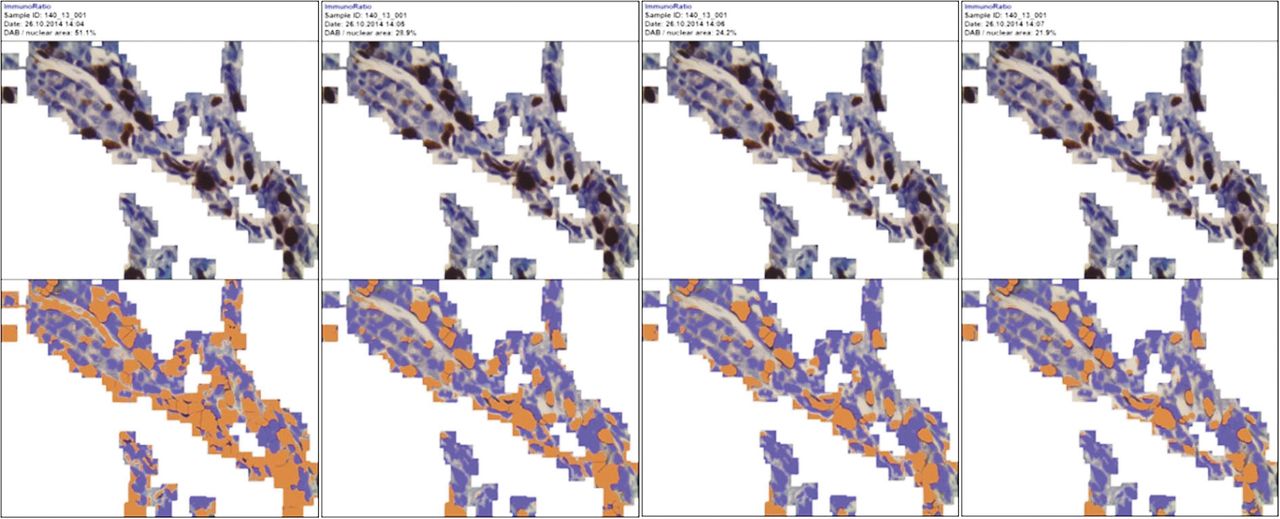
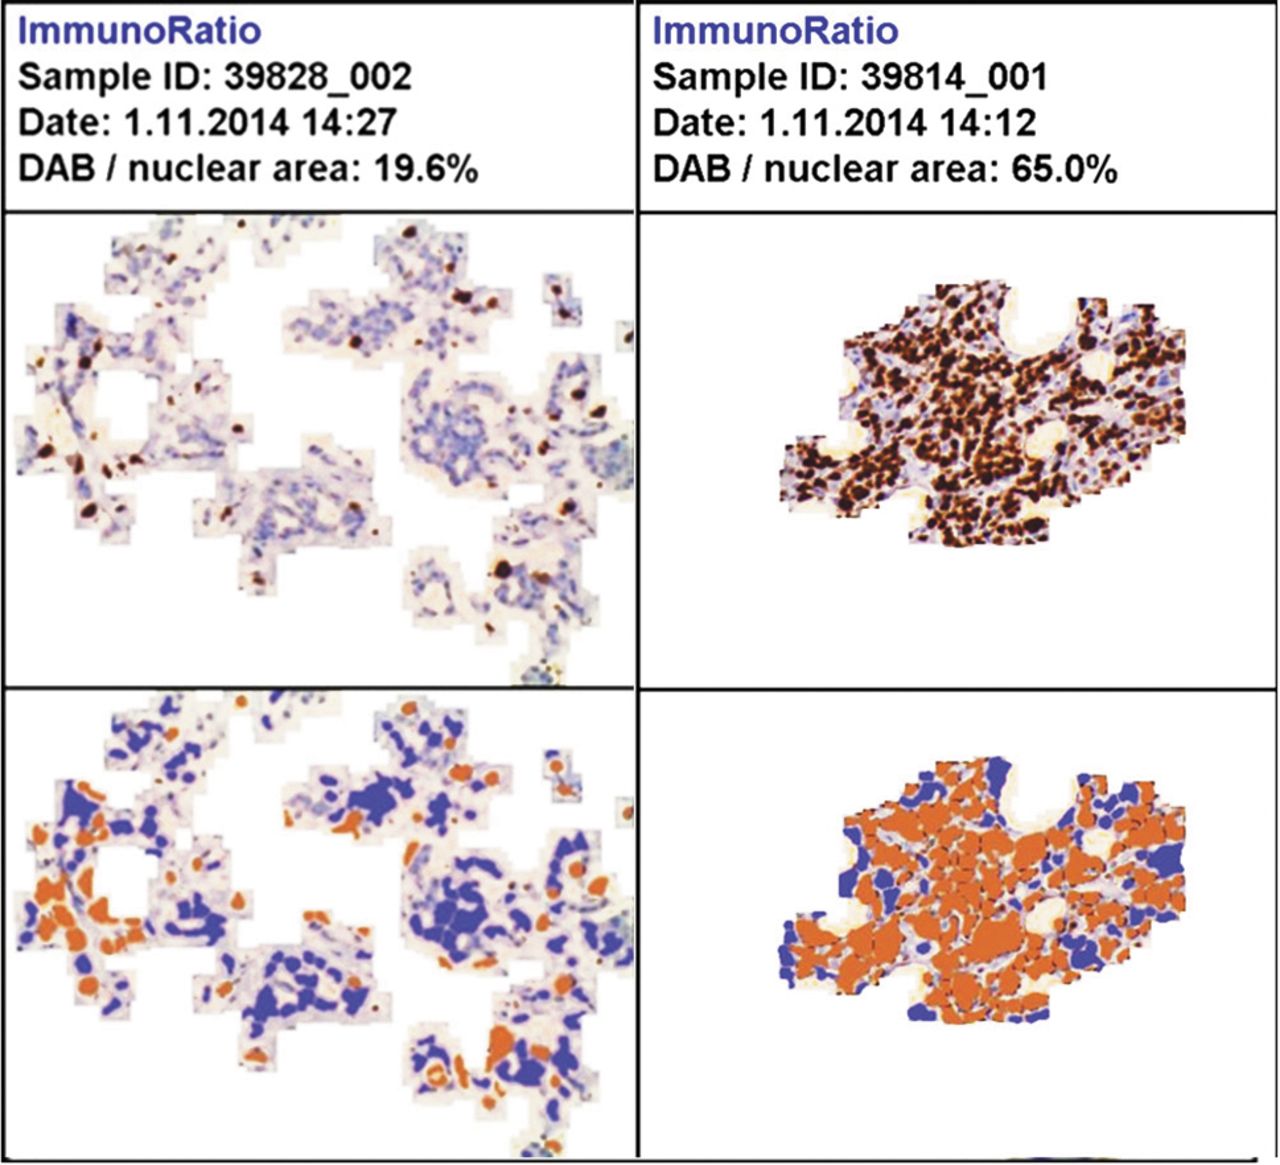
Measurements with ImmunoRatio. Image analysis was conducted using publicly available ImmunoRatio software (2). ImmunoRatio segments DAB-stained and hematoxylin-stained nuclei from the microscopic image. The labelling index is calculated as a quotient of DAB-stained nuclear area over total nuclear area (2, 6). The pseudo-coloured image, corresponding to the original one, is generated to check if segmentation was made correctly (Figure 2). The images were uploaded onto the ImmunoRatio server for analysis. The images previously used for counting with ImageJ were used.
ImmunoRatio application enables to define the region of interest (ROI), which is a time-consuming function. Great effort must be put to evaluate tissue with significant stromal area between malignant cell clusters (Figure 3). Additionally, when started, the user must close the polygon defining ROI without the possibility to erase the single node (Figure 3).To eliminate this inconvenience, our colleagues from Wroclaw University of Technology developed a software that automatically excludes the area out of ROI (10) (Figure 4, www.youtube.com/watch?v=bIUBaWr0yIQ).
Each pseudo-coloured image generated by ImmunoRatio was visually evaluated by a pathologist. Advanced mode was used. In cases where artificial colours did not match nuclei from the original image, the blue and brown threshold values were adjusted to obtain a more precise PI assessment (Figure 5). ImmunoRatio application enables to adjust the mean diameter of the assessed cancer nuclei. It helps the program to eliminate non-tumour nuclei that are generally smaller than the malignant ones (Figure 6). The ImmunoRatio application contains Camera Adjustment Wizard helping “to ensure that …… image brightness and contrast settings are within acceptable range” (11). This was useless, in our study, because camera acquisition options were adjusted for every single image. It resulted from the fact that images were captured during routine clinical work and microscope brightness adjustments were constantly being changed.
Statistical analysis. Statistica 12 (Statsoft, Tulsa, OK, USA) and Microsoft Excel 2007 were used for statistical analysis. Pearson's coefficients and Spearman's rank correlation were calculated for each pair of results. The agreement was assessed with Cohen's kappa. PI variable was categorized into binary variable for 20% cut-off point.

Cell Counter plug-in of ImageJ platform was employed to count brown (Ki-67-positive, DAB-stained, Type 1) and blue (Ki-67-negative, hematoxylin-stained, Type 2) nuclei.

Pseudo-coloured image generated by ImmunoRatio.
Results
Pearson's correlation coefficient between PI calculated with ImmunoRatio and manually counted PI was 0.84(p<0.05) (Figure 7). Spearman's rank correlation coefficient was 0.83 (p<0.05).We observed significant underestimation of PI values calculated by ImmunoRatio compared to manually counted PI (Table II, Figure 7). It was shown that as many as 26 cases classified into low proliferative group (PI<20%) by ImmunoRatio revealed high proliferating activity (PI≥20%) when counted manually (Table II, Figure 7). In contrast, only one case with high PI measured by ImmunoRatio was classified as low PI by manual counting. Moderate agreement was shown by Cohen's kappa calculation (K=0.47; p<0.05).
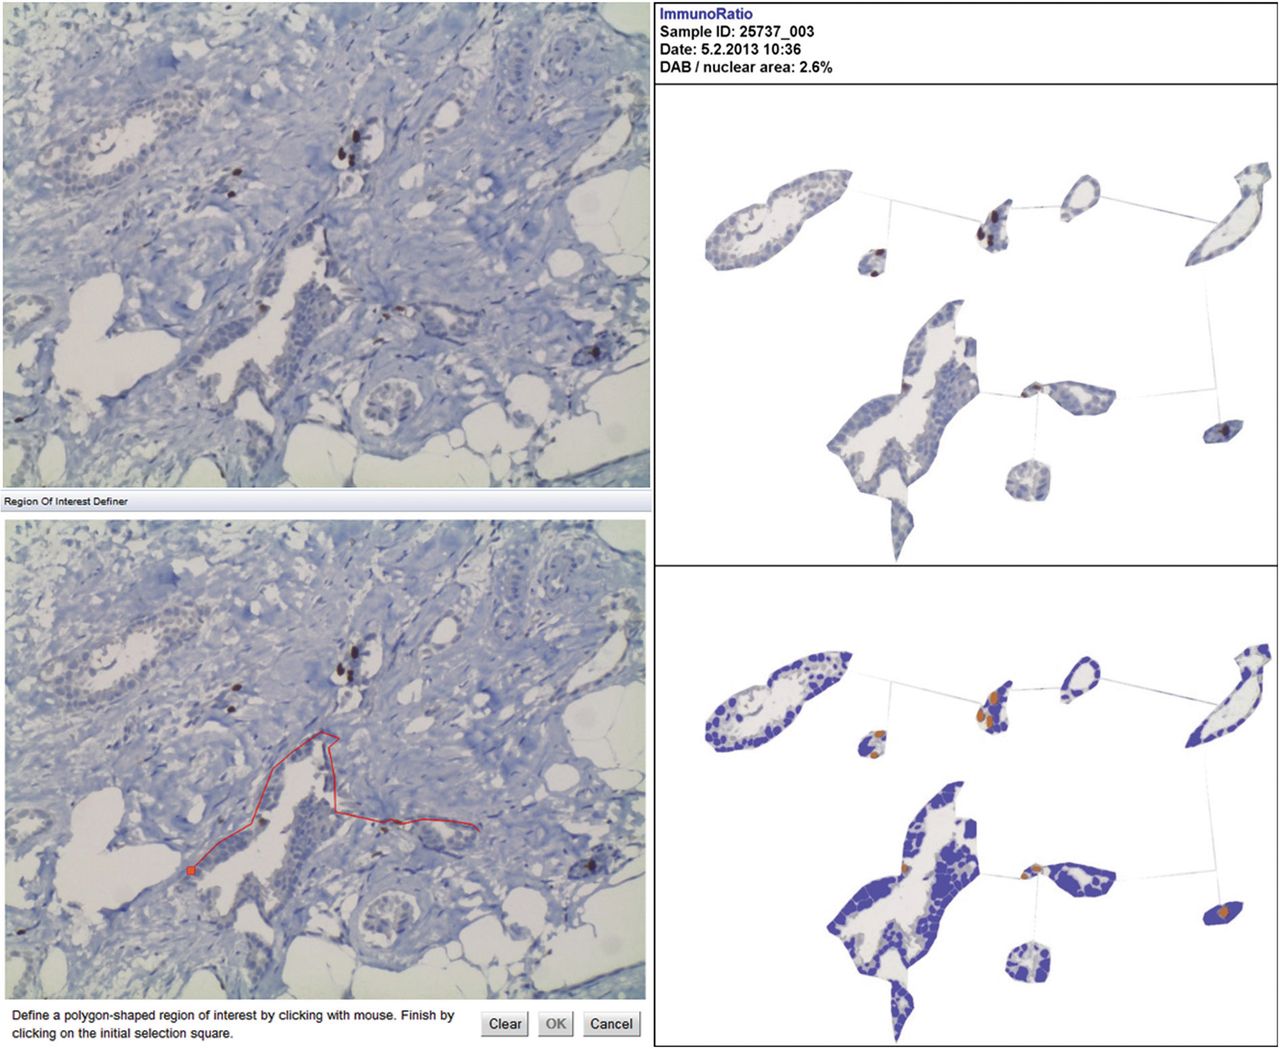
ImmunoRatio application enables to define the region of interest (ROI). When started, the user must close the polygon defining ROI without the possibility to erase the single node. Moreover, it is impossible to define multiple ROIs.

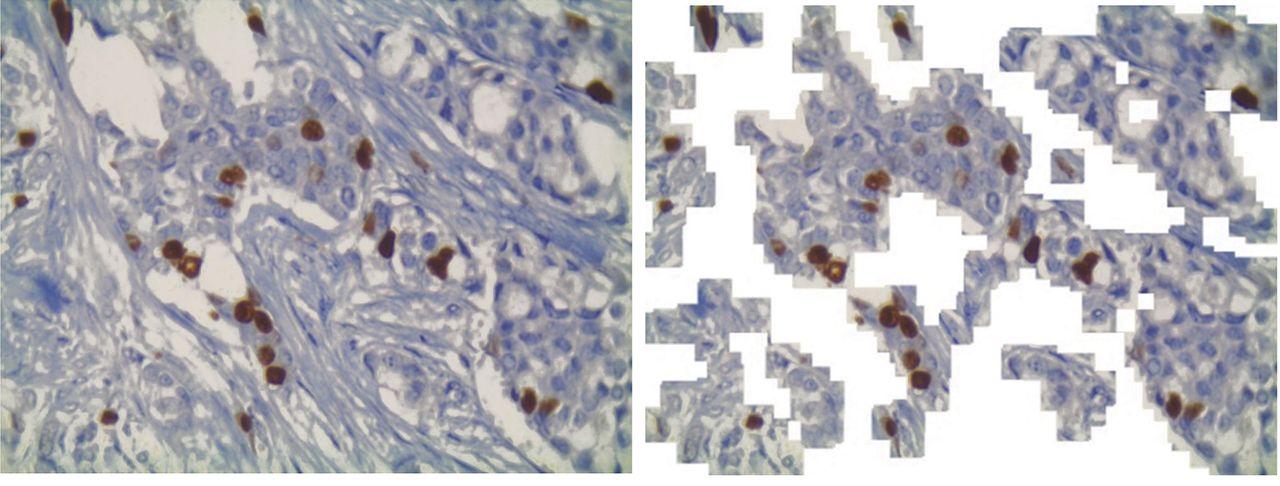
Software automatically excluding the area out of ROI (10).

Blue and brown threshold values were adjusted so that pseudo-coloured images correspond precisely to tumour nuclei.

ImmunoRatio application enables to adjust the mean diameter of cancer nuclei assessed.
Frequency of cases classified into low and high proliferative group (PI<20%, PI≥20%, respectively) by ImmunoRatio and manual counting with ImageJ accessorized with Cell Counter plug-in.

Results of proliferative index evaluation using ImmunoRatio application compared to manually counted PI with ImageJ. Vertical and horizontal lines represent 20% cut-off point.
Discussion
Proliferation index is a crucial predictive factor in breast cancer according to St. Gallen consensus recommendations commonly applied in Europe. In line with the recommendations, at least 1,000 cells should be counted and “500 cells be accepted as the absolute minimum” to score PI (9). These values are commonly encountered in studies regarding Ki-67 (12-15). In our opinion, it is impossible to precisely count nuclei one-by-one in the microscopic field. To make it possible, each counted nucleus would have to be immediately marked to prevent it from being counted twice. But how is it possible to mark a single cell on the glass using only a microscope? A grid maybe helpful but it has not been mentioned in any previous reports. Many authors have declared that nuclei were precisely counted in their studies. We call these statements into question as this method has not been described by any author.
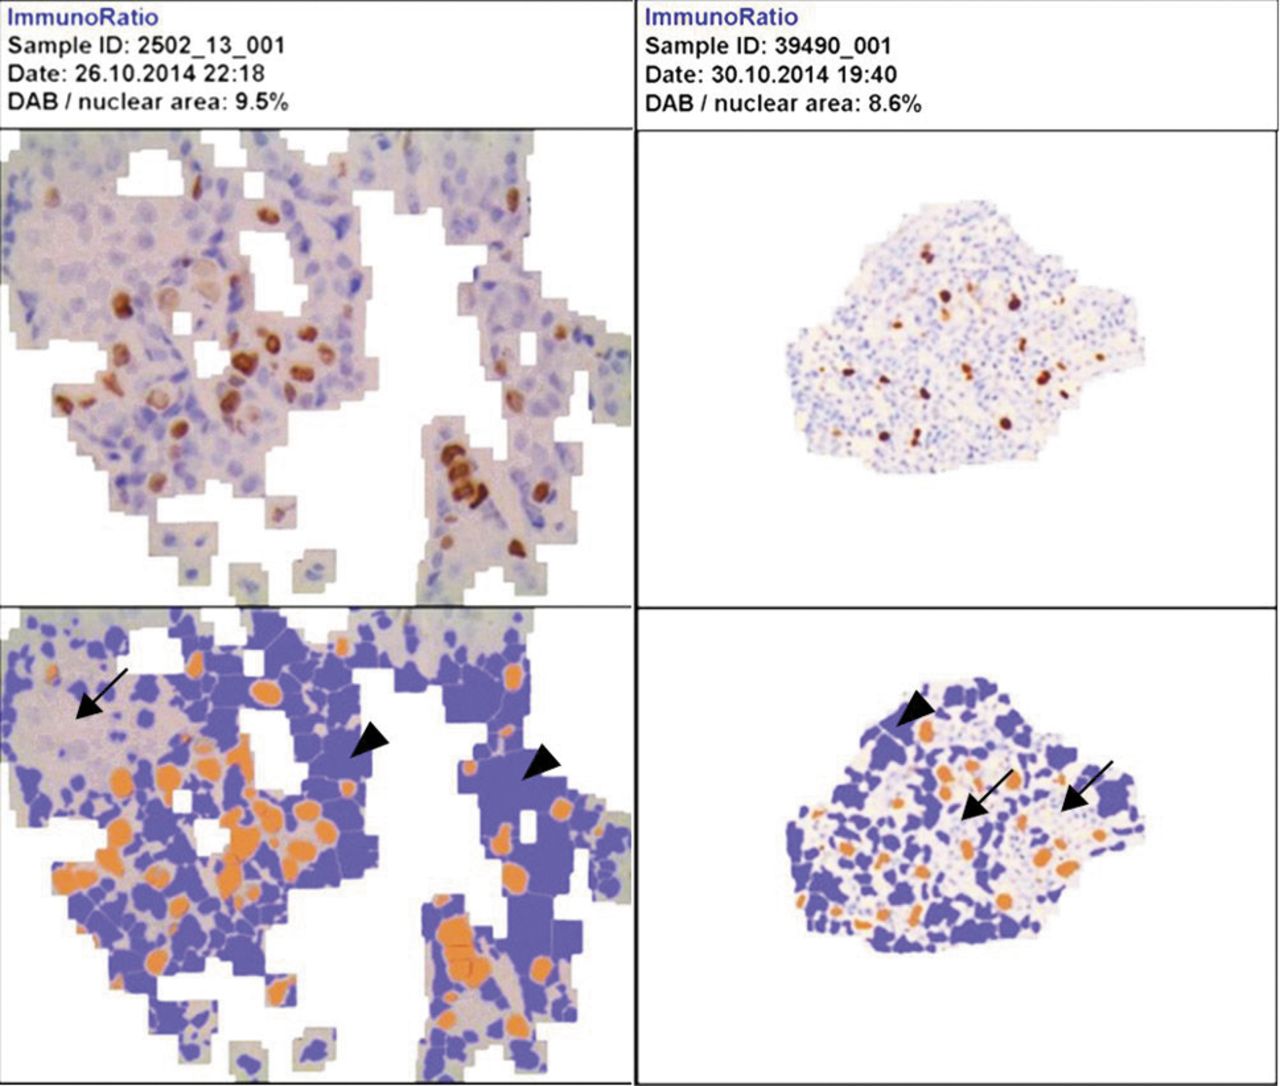
Some nuclei were not marked at all (arrows), whereas a significant area of extracellular matrix (ECM) was marked (arrowheads).
Based on our experience, nuclei can be counted one-by-one only in a digital picture using software for cell counting. Applications used in clinical practice contain pointer function enabling such approach. One of the applications employed is ImageJ with Cell Counter plug-in (4, 5). However, counting nuclei one-by-one is laborious and time-consuming, thus, not useful in laboratories with many cases of breast cancer being diagnosed. The solution appears to be automatic counting of all the nuclei in the microscope field using software.
We evaluated the usefulness of ImmunoRatio application (2, 6) in determining PI of breast cancer cases examined in our Department. To date, only two full-text studies, including evaluation of ImmunoRatio, have been published in addition to the original article describing application development (16, 17). It is also worth noticing that one of them (Remes et al. (17)) is co-authored by ImmunoRatio developers.
Rajan et al. used mmunoRatio application to score estrogen receptor α (ERα)-positive nuclei in 200 breast cancer cases. Manual counting was conducted on scanned slides (16). However, the authors failed to provide information on how this measurement was made. In contrast to our documentation (Figure 1), their pictures do not show tags introduced on counting. Thus, the reader may not have confidence that counting was precise. In the second paper, authored by Remes et al., the material consisted of 31 neuroendocrine tumours (NETs) from the pancreas and ileum. It is stated that at least 2,000 nuclei were counted (17). There is no description, however, of the measurement method. To the best of our knowledge, we were first to compare PI based on precise one-by-one nuclei counting to ImmunoRatio results derived from the analysis of the same pictures.

ImmunoRatio enables to adjust colour threshold values between −50 and +50. In some cases higher or lower values were necessary for obtaining more precise matching of nuclei.
The Pearson's correlation coefficient in our study was 0.84, which was lower than in Remes' group study (r=0.985, r=0.987 and r=0.995, for repeated measures). The Spearman's rank correlation coefficient was 0.83, which was comparable to results by Rajan et al. (0.87). Cohen's kappa in our study revealed moderate agreement (0.47), similarly to Rajan's (0.42), but lower than Remes' group (0.67).
We observed significant underestimation of PI values calculated by ImmunoRatio compared to manually counted PI (Table II, Figure 7). It is similar to Rajan's group results who conclude that it results from “the inability of the software to differentiate cancer nuclei from the non-cancer stromal elements” (16). There is, significant area of stromal component in the pictures presented by Rajan's group, which was not excluded from analysis. Three pictures presented in Remes' group study do not contain stroma; however, the reader cannot be sure if other images exclude it.
The areas where slice was folded were characterized by intensive blue staining.
To eliminate stromal component, we define the region of interest (ROI) containing tumour cells. As mentioned in the Materials and Methods section, defining ROI option in ImmunoRatio is inconvenient. Therefore, we asked our colleagues from Wroclaw University of Technology to develop a software that automatically excludes the area out of ROI (10) (Figure 4, www.youtube.com/watch?v=bIUBaWr0yIQ). Even if ROI is defined, there are still some stromal elements between tumour cells. Similarly to Rajan's study, we observed poor distinction between cancer cell and inflammatory cell nuclei. Precise selection of the mean diameter of cancer nuclei, which was possible in the application, did not eliminate this problem. The range of image scale was between 6.8 and 10.0 pixels per micrometre (pix/μm).
Each pseudo-coloured image generated by ImmunoRatio was visually assessed. We observed several factors that affected precise matching of brown- and blue-coloured nuclei. One of them was the fact that chromatin is not homogeneously stained and some nuclear areas were paler than cytoplasm or extracellular matrix (ECM). In some cases, there were groups of nuclei that were not marked at all, even if significant area of ECM was marked (Figure 8).The inability to adjust colour threshold values beyond −/+ 50 (Figure 9) was another problem. In our opinion, this may be solved with more precise white balance adjustment on the images being acquired but it is too time-consuming in clinical practice. The areas where slice was folded were characterized by intensive blue staining (Figure 10). Destroying the nuclei and smearing of chromatin resulted in an area with positive immunoreaction being too large, which, in turn, resulted in higher PI (Figure 11). The problems listed above were observed by other investigators as well (16).

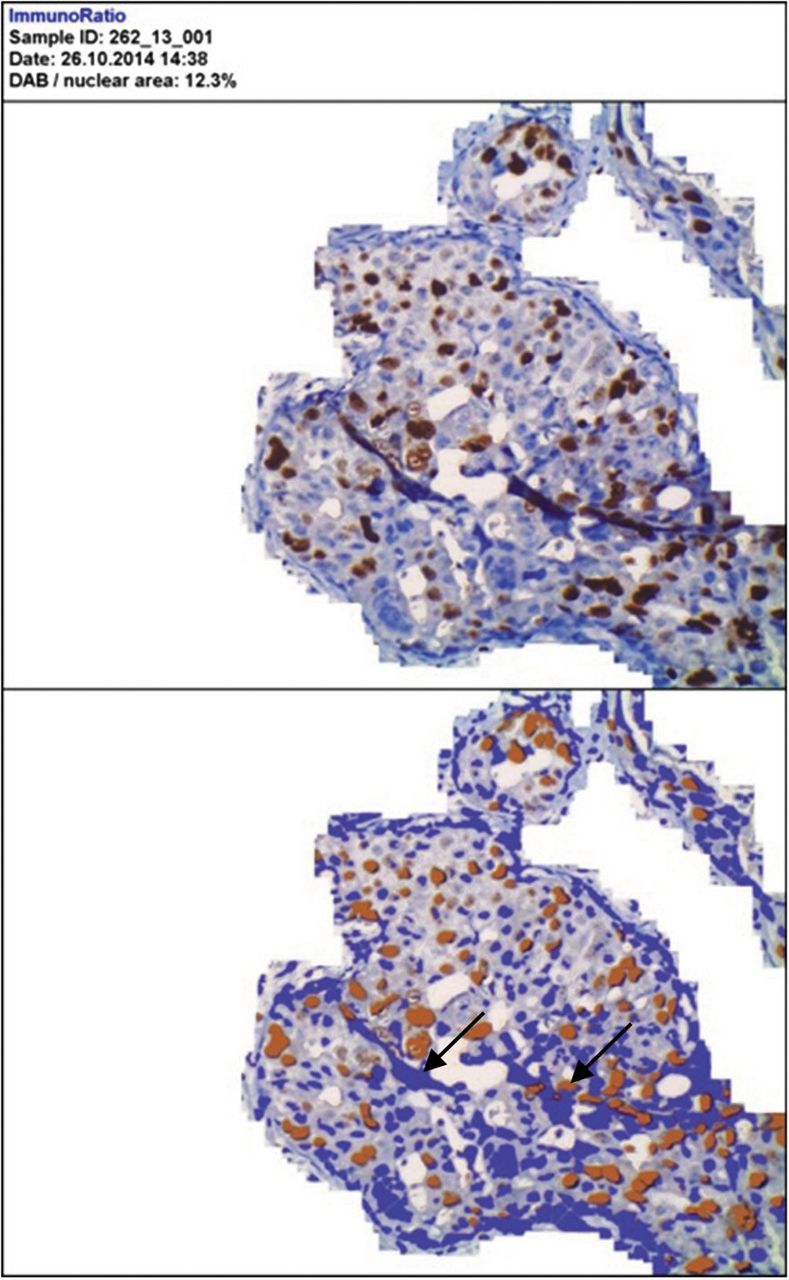
Destroying nuclei and smearing of chromatin resulted in an area with positive immunoreaction being too high, which in turn resulted in higher PI.
Defining breast cancer subtype is of key importance because it determines the treatment scheme. PI value plays critical role in distinguishing between luminal A-like and luminal B-like subtypes of breast cancer. The 20% cut-off point for PI was accepted by most experts at St. Gallen conference in 2013 (1). St. Gallen 2015 recommendations that were published while this paper was being written preserve the role of PI in differentiating between luminal A-like and luminal B-like HER2-negative breast cancer (2).
Our study revealed that as many as 26 cases classified as low proliferative (PI<20%) by ImmunoRatio were labelled as high PI (PI≥20%) by manual counting (Table II, Figure 7). These patients would have been administered different therapeutic strategies, depending on the method of PI evaluation. On the other hand, in practice, PI is estimated roughly by eyeballing. The issue of significant inter-observer variability has been often raised during pathology conferences. It has also been shown by the results of many studies (18-20).This situation will not change until precise guidelines on how PI should be measured are formulated and introduced into routine diagnostics.
Acknowledgements
The Authors thank Cyprian Kozyra for help with statistical analysis of the results.The publication of this work was supported by a grant for statutory of the Wroclaw Medical University No. ST.B130.16.049.
- Received May 7, 2016.
- Revision received June 5, 2016.
- Accepted June 6, 2016.
- Copyright© 2016 International Institute of Anticancer Research (Dr. John G. Delinassios), All rights reserved