

Abstract
Background: The purpose of the present was to investigate whether the in vitro effects of gefitinib, an EGFR tyrosine kinase inhibitor, may regulate the expression of type III sodium phosphate Na/Pi co-transporters in an in vitro glioma model. Materials and Methods: Proliferation studies, global native EGFR and phosphorylated EGFR expressions, phosphate transporter type III isoform 1(PiT1) expression and phosphate transport with 99mTc-(V)-DMSA radioligand were performed in G111 (grade II astrocytoma), U-87-MG (grade III astrocytoma) and G152 (grade IV glioblastoma) cells. Results: Cells treated with gefitinib showed a significant decrease in proliferation in relation to EGFR and p-EGFR expression. Gefitinib also produced a decrease in phosphate transport mediated PIT1 expression at both the RNA and protein levels. Conclusion: The link between gefitinib acting on the EGFR and PiT1 regulation in these cancer cell lines was herein shown.
- Gefitinib
- malignant gliomas
- EGFR signaling
- PiT-1
The epidermal growth factor receptor (HER1/EGFR) has been extensively investigated as a target for anti-neoplastic therapy in gliomas (1-4). Many abnormalities of the receptors of tyrosine kinase pathways have been demonstrated in malignant gliomas, including HER1/EGFR overexpression, which is observed in 40% to 50% of cases, suggesting its fundamental role in pathogenesis (3-5) HER1/EGFR overexpression also appears to be correlated with malignant grade (3). One of the various approaches used to inhibit EGFR function is the use of tyrosine kinase receptor inhibitors such as gefitinib (ZD1839, Iressa®; AstraZeneca, London, UK). Gefitinib has been reported to be a specific reversible inhibitor of EGFR phosphorylation, and therefore of receptor activation and signal transduction. Gefitinib has also been investigated in a number of clinical trials in malignant gliomas (6-9). Many studies have already demonstrated that gefitinib is able to suppress Epidermal Growth Factor (EGF)-stimulated activation of the PI3K/AKT pathway, with an action on cell proliferation (8, 10, 11). Most of these biological mechanisms suggest the phosphate ion is linked to proliferation of nucleic acids, or tyrosine kinase protein phosphorylation. Recent reports have suggested that phosphate transporter type III isoform 1 (NaPi type III or PiT1, or SCL20A1) plays an important role in vascular and bone mineralization (12-15). Arar et al. have demonstrated that EGF regulates NaPi type II phosphate transporter in weaned and suckling rats (16) however, in the literature, there are few studies about the regulation of PiT1 expression in tumor cells and the cross-talk between EGFR and PiT1 expression. Our previous work studied phosphate transport by means of radioligand: 99mTc -(V)-DMSA (Pentavalent 99mTc-dimercaptosuccinic acid) which enters cancer cell lines specifically via type III NaPi co-transporters (PiT1) (17). We recently demonstrated that 99mTc-(V)-DMSA uptake was correlated to the specific activity of two protein kinases, PI3K and PKC, and related to the aggressiveness of malignant gliomas cells (18). We also demonstrated that Gleevec®, a selective tyrosine kinase inhibitor of platelet-derived growth factor receptor (PDGFR), diminished phosphate transport in malignant glioblastoma (19).
The aim of the present study was to investigate the in vitro effects of gefitinib in regulating the expression of type III Na/Pi co-transporter on an in vitro model of glioblastoma using U-87-MG (grade III) and G152 (grade IV) cells with low and high expression of EGFR, respectively.
Materials and Methods
Cell culture. The U-87-MG cell line was obtained from the American Type Culture Collection (ATCC, Rockville, MD, USA) and was derived from a patient with grade III gliomas. G111 and G152 are two human cell lines originating from patients with grade II and IV glioblastoma respectively, and provided from INSERM U453, Léon Bérard Centre (France). Cells were cultured in appropriate media according to the supplier's instructions. Before any experimentation, cells were cultured in medium containing 1% serum overnight.
EGF receptor, tyrosine kinase inhibitor and activator. The tyrosine kinase inhibitor Gefitinib (‘Iressa’, ZD1839) was a generous gift from AstraZeneca (London, UK). Stock solutions were prepared at 10 mM in dimethylsulfoxide (DMSO), aliquoted and stored at −20°C. Dilutions of this stock solution were prepared immediately before use in cell culture medium, and were added directly to the cells.
EGF, considered to be an activator of EGFR, was obtained from Sigma (St. Louis, MO, USA). Stock solutions were prepared at a concentration of 10 μg/ml in phosphate buffered saline (PBS) with 0.1% acetic acid and were stored at −20°C. Dilutions of this stock solution were prepared immediately before use in cell culture medium, and were added directly to the cells
Cell-based ELISA assay. EGFR and phospho-(p)EGFR protein expressions after 24-hour incubation with gefitinib (10 μM) or EGF (100 ng/ml) were quantified by cell based ELISA. Briefly, glioma cell lines were seeded in 96-well plates at a density of 2×10⁴ cells per well and cultured to form a sub-confluent monolayer. After drug exposure, the cells were washed with PBS, fixed with 3.7% formaldehyde in PBS, and permeabilized with 0.1% Triton-X-100 in PBS. Nonspecific binding was blocked with PBS containing 10% foetal calf serum (FCS) for 60 minutes at 37°C. Primary antibodies, a rabbit anti-human EGFR (sc-03) and a goat anti-human p-EGFR (Tyr1173) (sc-12351), were obtained from Santa Cruz Biotechnology (Santa Cruz, Tebu-bio, Le-Perray-en-Yvelines, France). Each primary antibody was diluted to 1:100 in blocking solution, and incubated with cells for 2 hours at 37°C. Protein expression was detected after 1-hour incubation at 37°C with secondary antibodies, an anti-goat and an anti-rabbit conjugated to horseradish peroxidase, diluted to 1:10,000 in blocking solution. Finally, the 96-well plates were washed, 100 μl of TMB substrate (Sigma) were added, and the reaction was stopped after incubation for 5 to 10 minutes by 50 μl of 1 N hydrochloric acid. The absorbance of the resulting yellow end-product was then read at 450 nm.
Cell proliferation assay and viability assay. Growth kinetics and effects of gefitinib on U-87-MG glioma cell proliferation were assessed using UptiBlue® (Uptima; Interchim, Montluçon, France).
Firstly, to evaluate gefitinib cytotoxicity, cells were harvested and seeded in 96-well plates (Greiner Bio-one S.A.R.L., Poitiers, France) at a density of 1×10⁴ cells per well. In the exponential phase of growth, cells were incubated in the presence of gefitinib at a concentration range from 0 μM to 100 μM for an appropriate time (24, 48 or 72 h) and 10% v/v UptiBlue® was then added. UptiBlue® reduction was then monitored by fluorescence measurements at an excitation wavelength of 530-560 nm and an emission wavelength of 590 nm. The dose–response and time–response curves were established from the results, and the 50% lethal dose (LD50) was then determined. Cell viability and the cytotoxic effect of gefitinib were then studied more precisely after incubation of cells with 5, 10, 15, 20 and 50 μM gefitinib for 24, 48 and 72 h. Results are expressed as the percentage cell survival compared to that of the untreated control, considered to be 100%. Effects on cell proliferation were assessed by evaluation of the cell proliferation rate in the absence and in the presence of gefitinib.
EGF competition studies. Effects of competition between gefitinib and EGF on cell proliferation were monitored by UptiBlue® (Uptima; Interchim). As described above, gliomas cells were seeded in 96-well plates (Greiner Bio-one S.A.R.L., Poitiers, France) at a density of 1×10⁴ cells per well. In the exponential phase of growth, cells were incubated in the presence of a range of 0 ng/ml to 100 ng/ml EGF alone, or in combination with 10 μM gefitinib for 24, 48 and 72 h. UptiBlue® (10% v/v) was then added and the reduction of cell proliferation was then monitored by fluorescence measurements at an excitation wavelength of 530-560 nm and an emission wavelength of 590 nm. Results were expressed as the percentage cell survival compared to that of the untreated control considered to be 100%.
Phosphate transport studies: Cell kinetics. 99mTc-(V)-DMSA was prepared according to the method described elsewhere (20). The radiochemical purity of 99mTc-(V)-DMSA was greater than 95% in all experiments. The cells were plated in 24-well plates (Falcon, Elvetec, Lyon, France) and treated with different EGFR signaling pathway modulators: i) in the presence or absence of 10 μM and 50 μM gefitinib (EGFR inhibitor) for 48 h; ii) in the presence or absence of 100 ng/ml EGF (EGFR activator) for 48 h; iii) or with a combination of the two modulators.
After treatment, cells were used for radioactive tracer uptake as follows: cells were equilibrated in FCS-free medium before adding radioactive tracers. 99mTc-(V)-DMSA was added to the medium at a concentration of 0.9-1 nM for a 60-min incubation period, in agreement with our previous kinetics studies (6). The cells were rapidly washed three times with PBS at 4°C and were then solubilized with 1% sodium dodecyl sulfate (SDS) solution in 10 mM sodium borate. The radioactivity in the cellular lysate was counted with a gamma scintillation counter (Packard Cobra 5002; Perkin Elmer, Courtaboeuf, France).
Evaluation of PiT1 expression. RNA level measurements: Total RNA was extracted from confluent cells with Trizol (Life Science Technologies, Thermo Fischer Scientific, Lyon, France). cDNA was synthesized by reverse transcription of 1 μg of total RNA using Omniscript® Reverse Transcription kit (Qiagen,Courtaboeuf, France), according to the manufacturer's instructions. Real-time quantitative PCR was performed in a 7500 Applied Biosystems Cycler, Thermo Fischer Scientific, Lyon, France using Quantitec SYBR Green PCR kit (Qiagen). For amplification, the PIT1 primer pair spanning 150 bp (designed with Applied Biosystems software) was used, PIT1: forward: ACC AGC ATA GAT AGC ACC GTG AAT TGG TCG TAT CTA TCG TGG CAC TTA, and reverse: TGC TGA CGG CTT GAC TGA ACT ACG AGT GCC GAA CTG ACT TGA). The PCR conditions were initial denaturation in one cycle of 15 minutes at 95°C, followed by 40 cycles of 30 sec at 95°C, 30 sec at 60°C, and 30 sec at 72°C. All analyses were performed in triplicate. PiT1 expression was normalized to expression of GAPDH as a housekeeping gene (GAPDH: forward: CGT CTT CAC CAC CAT GGA GA, reverse: CGG CCA TCA CGC CAC AGT TT, accession no. AF106860).
The results are expressed as mean fold PIT1 expression, using the 2−ΔΔCT method.
PiT-1 expression protein measurement: Cells were plated in 96-well plates (Falcon, Elvetec, France), at 2×10⁴ cells per well until they reached subconfluency. Cells were rinsed twice with PBS 1X, then were fixed in formaldehyde 4% and permeabilized and blocked with 1% Triton X-100 and 10% FCS in PBS, for one hour at 37°C. Then cells were incubated for three hours with the primary antibody (1/1000, rabbit anti-mouse PIT1; E83650; Uptima Interchim), and the secondary antibody (1/10000, goat anti-mouse; Interchim Montluçon France), for 40 minutes. After each step, cells were rinsed in PBS 1X-10% of SVF. A final step tetramethylbenzidine (TMB) (Sigma Aldrich) for 15 to 30 minutes allowed spectrophotometric quantification at a wavelength of 620 nm. Absolute quantification was carried out using a calibration curve with PiT1-blocking peptide (B53580; Uptima, Interchim). Normalization of quantification was performed with total protein evaluation with MicroBC Assay Protein Quantification (Uptima, Interchim). Our results are expressed as μg PiT1 per mg of total protein.
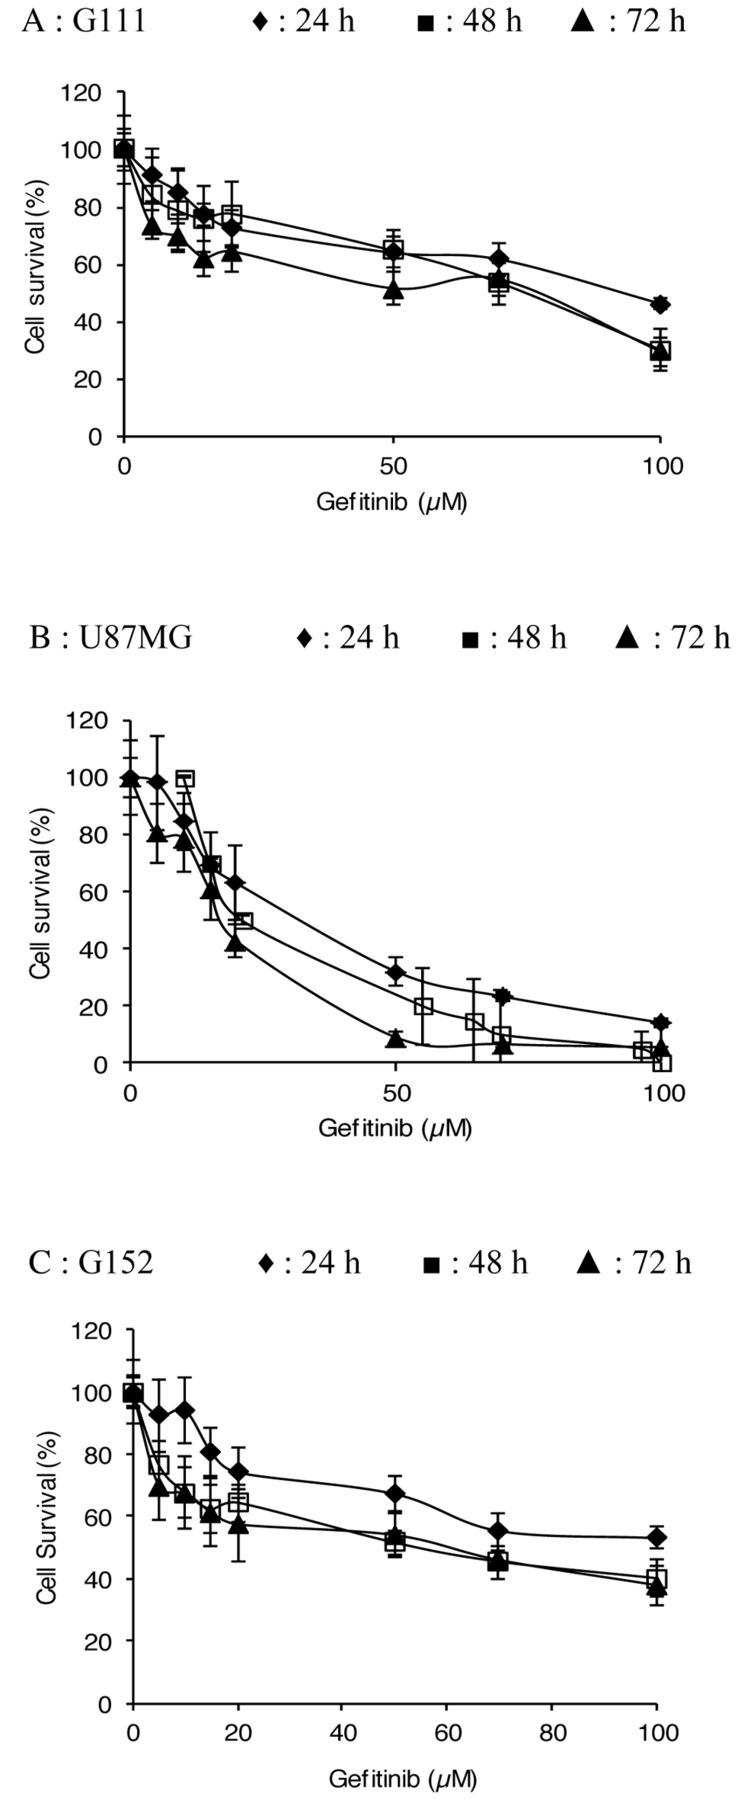
Evaluation of gefitinib cytotoxicity. Dose– and time–response curves of malignant glioma cell lines of treatment with gefitinib, Cells were incubated for 24 h, 48 h and 72 h with a range of 0 to 100 μM gefitinib. The percentage cell survival was assessed by UptiBlue as described in the Materials and Methods. Each point represents the mean±standard deviation (SD) (n=18).
Statistical analysis. Treated samples were compared with the untreated control. Statistical significance in all experiments was determined by an unpaired two-tailed Student-test. p-Values less than 0.05 were considered significant (*p<0.05, **p<0.01, ***p<0.001)
Results
Determination of cytotoxic dose. Figure 1 shows the dose–response curves for gefitinib against the malignant glioma cell lines. Gefitinib cytotoxicity was evaluated after 24, 48 and 72 h of treatment, with concentrations ranging from 0 μM to 100 μM. Gefitinib concentrations inducing 50% inhibition of cell proliferation (IC50) ranged from 17 μM to 32 μM for U-87-MG, from 75 and 93 μM for G111, and from 55 μM and 62 μM for G152, depending on the incubation period. All results obtained seemed to demonstrate that G111 and G152 cell lines were more resistant to gefitnib than the U-87-MG cell line. This study showed a significant inhibition of cell survival after treatment of the cells with 50 μM gefitinib for 24-72 h. This dose was chosen as the cytotoxic dose in our model, which allows for an EGFR-independent model to be utilised.
Evaluation of the effect of gefitinib on cell proliferation. The effects of gefitinib on gliomas cell proliferation were evaluated over a concentration range of 5 μM to 50 μM for 24, 48 and 72 h. The results were normalized by evaluating the proliferation rate of each cell line (Figure 2) compared to the untreated control. This study showed that gefitinib induced a significant inhibition of cell proliferation. A gefitinib concentration higher than 10 μM induced a significant decrease in cell proliferation after each treatment period in all glioma cell lines studied. According to the results, and in agreement with the literature, we chose a 10-μM dose for 48 h. This dose produces significant inhibition in all three cell lines without any cytotoxic effect; therefore this dose corresponds to our EGFR-dependent model.
We consequently determined two gefitinib concentrations: 10 μM for use in the EGFR-dependent model and 50 μM for use in the EGFR-independent cytotoxic model.
To evaluate the specific action of gefitinib on the EGFR signaling pathway, competition studies between gefitinib and EGF were performed in our EGFR-dependent model. Our studies were monitored with EGFR-stimulating medium, with a concentration range of 0-100 ng/ml EGF for 24, 48 and 72 h (Figure 3). The results presented in Figure 3 show that EGF significantly stimulated cell proliferation. A more intense effect was obtained with an EGF concentration of 100 ng/ml after an incubation time of 72 hours in all cell lines. The combination of 10 μM gefitinib and EGF at a concentration of 2.5 ng/ml after 48 hours induced a significant decrease of cell proliferation for the three glioma cell lines of incubation compared to cells treated with EGF alone: 17.6% decrease vs. a 5% increase, respectively, for U87-MG cells (p<0.05) (Figure 3); an 18% decrease vs. a 6% increase, respectively, for G111 cells, (p<0.05); and finally, for G152 cells, a 12.5% decrease of cell survival vs. a 22% increase, respectively, was found (p<0.001).

Effect of gefitinib on glioblastoma cell proliferation rate. Cells were incubated for 24 h, 48 h, and 72 h with different concentration of gefitinib. Cell proliferation rate was assessed by Uptiblue assay as described in the Materials and Methods. Each point represents the mean±SD (n=24). Significantly different from the control at *p<0.05, **p<0.01 and ***p<0.001.

Competition between gefitinib (10 μM) and Epidermal growth factor (EGF) on cell proliferation of malignant glioma cell lines. Cells were incubated with EGF at concentrations ranging from 1 to 100 ng/mL alone and in combination with 10 μM gefitinb for 24, 48 and 72 h. Cell proliferation was evaluated with UptiBlue as described in the Materials and Methods. Each point represents the mean± standard deviation (SD) (n=16). Combined treatment significantly different from the untreated control at *p<0.05, **p<0.01 and ***p<0.001;and from treatment with gefitinib alone at #p<0.05, ##p<0.01 and ###p<0.001.
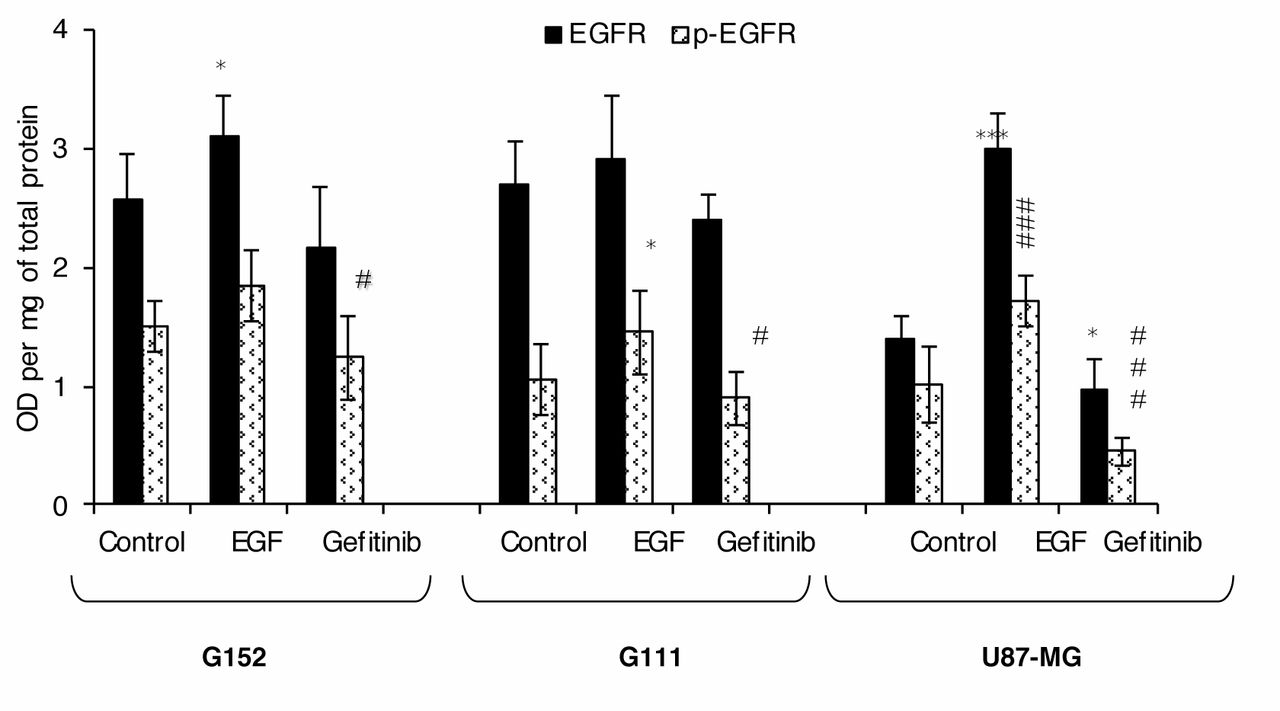
Analysis of gefitinib and Epidermal growth factor (EGF) effects on EGF Receptor (EGFR) and phosphorylated EGFR (p-EGFR) expression in an in vitro model of malignant glioma. The levels of EGFR and p-EGFR expression was assessed by a cell ELISA technique after incubation of cells with 10 μM gefitinib and 100 ng/ml EGF for 48 h, as described in the Materials and Methods. The results are expressed in optical density per mg of total protein. Each point represents the mean± SD (n=24). Significantly different from the untreated control at *p<0.05, **p<0.01 and ***p<0.001, #p<0.05; ##p<0.01 and ###p<0.001.
Influence of gefitinib on EGFR expression by cell-based ELISA analysis. In order to determine whether these malignant glioma cell lines express the native form of EGFR, the level of protein expression was first evaluated by cell ELISA. The results are presented in Figure 4 and show a low EGFR expression in U-87-MG cells (1.39 optical density (OD)/mg protein). On the contrary, G111 and G152 cells expressed higher EGFR levels at 2.69 OD/mg protein and 2.57 OD/mg protein, respectively.
Gefitinib is defined as a specific inhibitor of EGFR phosphorylation, and inhibits receptor activation. The possible influence of this tyrosine kinase inhibitor was, therefore, assessed by evaluating p-EGFR expression and native EGFR expression. The results demonstrated that treatment with 10 μM gefitinib induced a significant decrease in expression of both p-EGFR (activated form) and EGFR (native form) in all treated cells (Figure 4). The results obtained from the p-EGFR expression study demonstrated a 56% relative decrease iin G111 cells. Similar results were observed for the native EGFR form, with a relative decrease in all cell lines observed after treatment with gefitinib (Figure 4).
The effect of EGF (the specific ligand of EGFR) on EGFR activation was evaluated at the same time. The global and phosphorylated forms of EGF receptor were therefore studied after activation with 100 ng/ml EGF. A significant increase in p-EGFR and EGFR was observed in all cell lines after treatment.
Phosphate transport studies. Phosphate transport studies were evaluated with radioligand 99mTc-(V)-DMSA, since in our previous work we demonstrated that this tracer specifically enters cancer cells by means of PiT1(17). In the study, we also demonstrated that U87MG, G111 and G152 cells only express type III co-transporter isoform 1 (PiT1).
To determine whether 99mTc-(V)-DMSA cell incorporation could be related to the specific action of gefitinib, 99mTc-(V)-DMSA uptake was studied in the presence of two different gefitinib concentrations, 10 μM in the EGFR-dependent model, and 50 μM in the EGFR-independent cytotoxic model; and in the presence or absence of EGF-containing medium (100 ng/ml) (Figure 5). After 48 h of incubation with gefitinib, a relative decrease in 99mTc-(V)-DMSA uptake was observed (Figure 5).
In cells treated with 100 ng/ml EGF, a significant increase in cellular 99mTc-(V)-DMSA uptake was observed. Results of competition between EGF and gefitinib were in line with our previous results. A study of the competition between 10 μM gefitinib and EGF showed a relative decrease in cellular 99mTc-(V)-DMSA uptake in comparison to 99mTc-(V)-DMSA accumulation observe with EGF stimulation alone.

Evaluation of phosphate transport-. Cells were treated for 48 h in an inhibitory cell culture medium with 10 μM or 50 μM gefitinib, or in a stimulatory cell culture medium with 100 ng/ml EGF. Evaluation of phosphate transport was done with 99mTc-(V)-DMSA radioligand as described in Material and Methods. 99mTc-(V)-DMSA uptake was studied in competition of gefitinib (100 ng/ml) with EGF (10 μM or 50 μM). Results are expressed as the percentage that of the untreated control considered to be 100%. Each point represents the mean±standard deviation (SD), n=18. Significantly different from the untreated control at *p<0.05, **p<0.01 and ***p<0.001;significantly different from treatment with EGF alone at #p<0.05, ##p<0.01 and ###p<0.001.
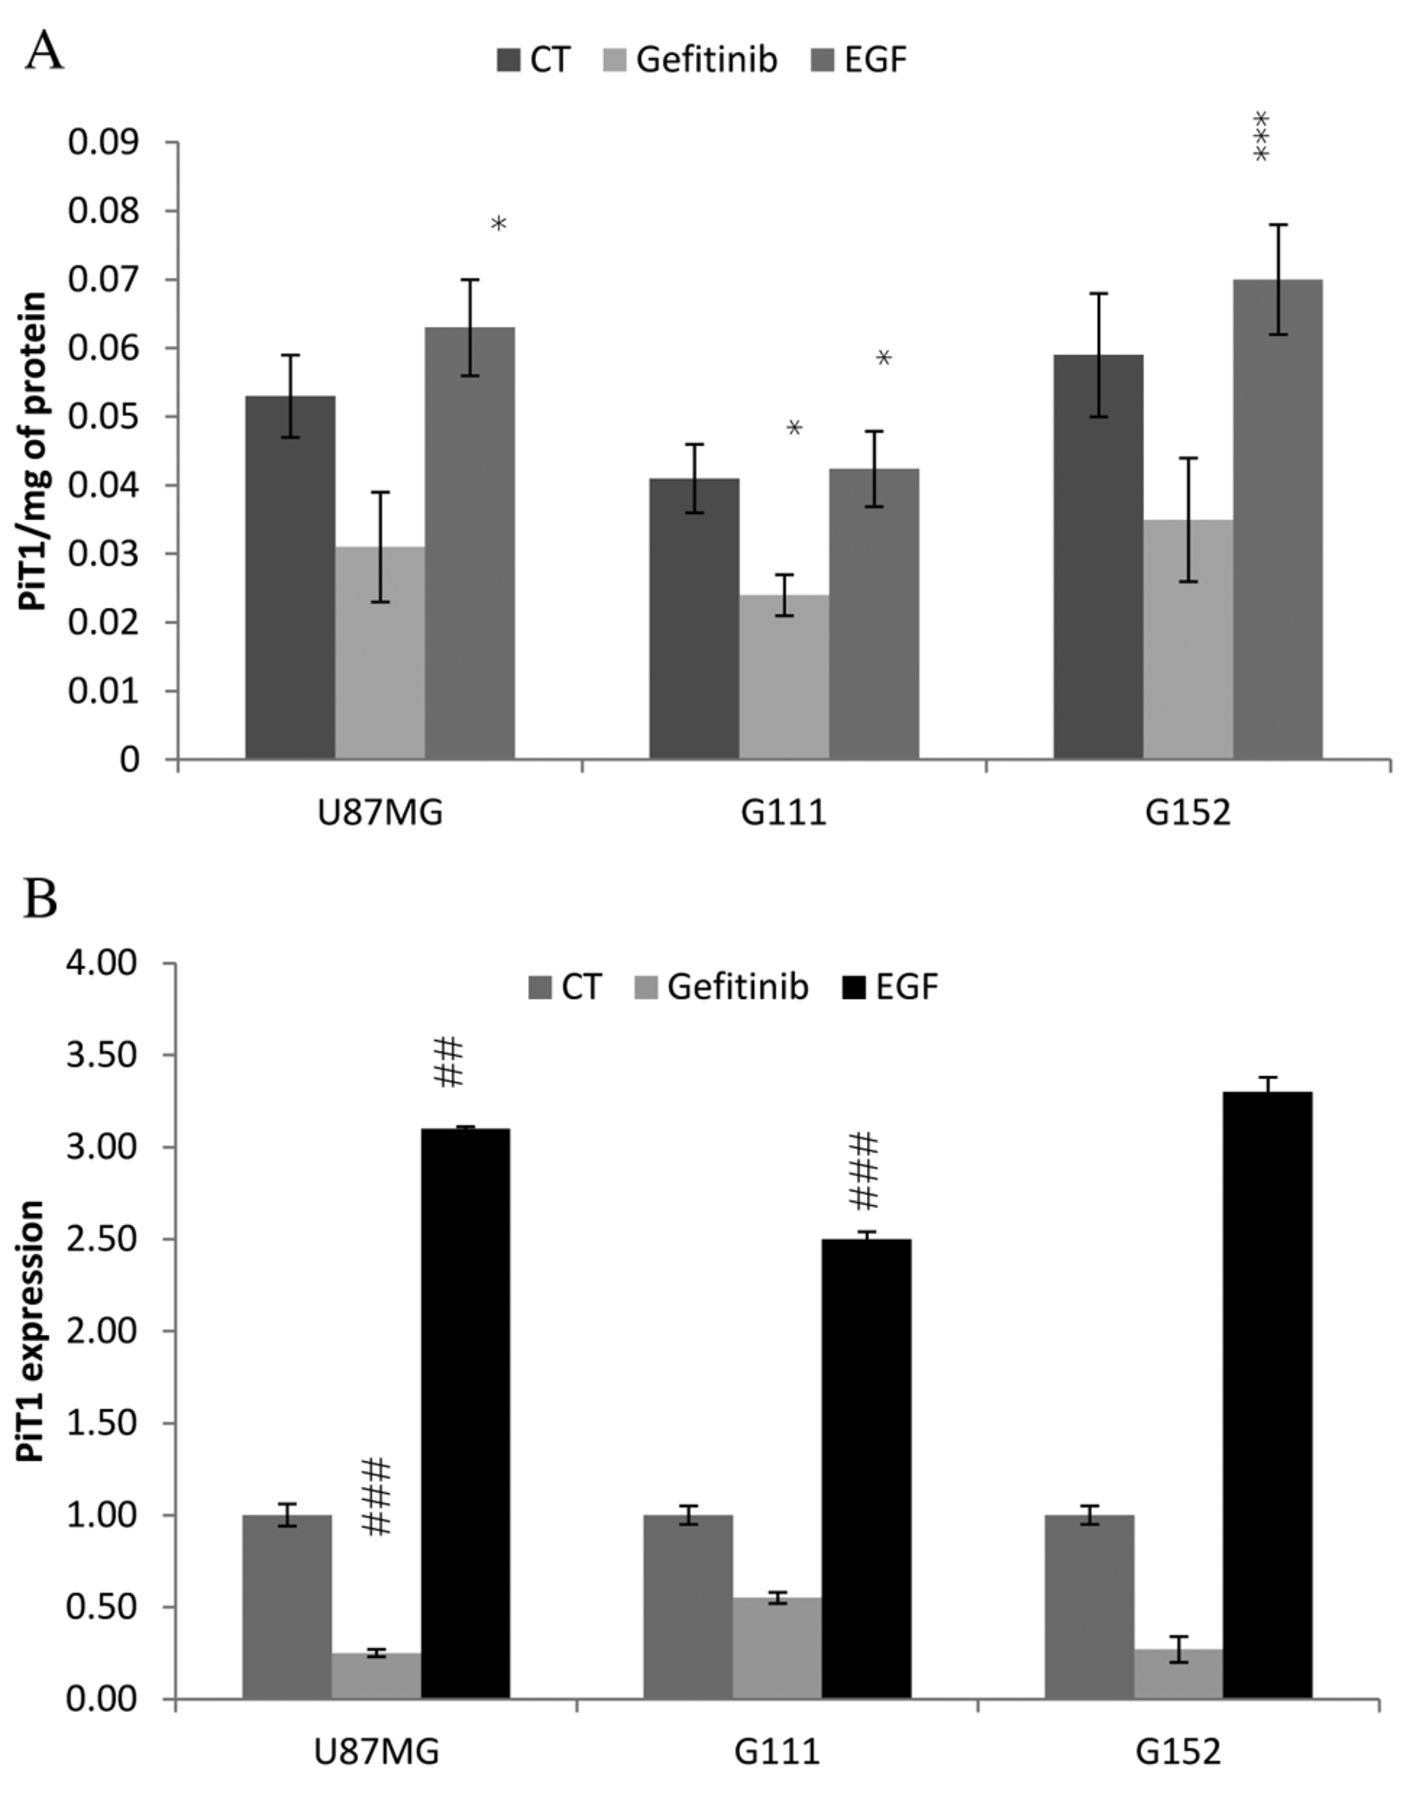
Evaluation of PiT-1 expression at RNA and protein levels. We studied PiT-1 expression by Cell Elisa and by Real time PCR after activation with EGF ligand or inhibition with Gefitinib. The results presented in Figure 6 show that PiT-1 expression was in the order of G152 > G111 > U-87-MG. We found that gefitinib treatment induced a significant decrease in PiT1 expression, by almost 40%, in all cell lines. The results show RNA expression of PiT1 to be in line with its protein expression. EGF stimulation increased PiT-1 expression both at the RNA and protein levels, as depicted in Figure 6.
Discussion
In the present study, we explored the in vitro effects of gefitinib on EGFR signaling in a human malignant glioblastoma model made up of three cell lines of different glioblastoma grades: G152 (grade IV), U87MG (grade III), and G111 (grade II-III). Gefitinib has been demonstrated to be a potent and selective tyrosine kinase inhibitor (8). More specifically, gefitinib has been shown to be an effective inhibitor of cell growth via inhibition of EGFR phosphorylation, notably involved in the recruitment of protein kinases allowing cancer (3, 4, 21). The proliferation study demonstrated that gefitinib has a dose- and time-dependent inhibitory effect on the glioblastoma cell lines tested. In vitro and in vivo studies demonstrated growth inhibition of multiple cell lines by gefitinib. The IC50s obtained were in the range of 17 to 55 μM, depending on the incubation period. These doses, higher than those described in the literature for other cell lines, such as non-small cell lung cancer, could be explained by the particularly aggressive nature of our cellular model, but are still in agreement with results found in glioma cells (6, 8, 10, 22). Results of the proliferation study showed a significant decrease in cell proliferation, without cell toxicity, after a 48-h incubation with 10 μM gefitinib. In light of these results and the literature, we decided to conduct this study at the IC20, as this concentration corresponds to the gefitinib dose that induces significant effects on biological behaviour, without any cellular mortality epiphenomena (EGFR-dependent model). Combinations of gefitinib and EGF demonstrated true competition between the two molecules and proved the specific action of gefitinib on EGFR.
EGFR and pEGFR expressions in our glioblastoma model were studied by cell ELISA. As described in the literature, U-87-MG cells were found to express low levels of EGFR, whereas G152 and G111 expressed more EGFR. A 48-h incubation period with 100 ng/ml EGF induced increased EGFR expression and activation (phosphorylation of EGFR). Conversely, decreases in EGFR and p-EGFR expression, associated with a decrease in cell proliferation, were observed after a 48-h incubation with 10-μM gefitinib. This protein expression study illustrates the specific action of gefitinib on EGFR phosphorylation.
The phosphate ion is known to play an important role in cell proliferation and is also intimately involved in the phosphorylative activity of proteins. In addition, we previously demonstrated that 99mTc-(V)-DMSA is a tracer of PiT1 in tumour cell lines (23) and is involved in proliferation (24). More recently, we also demonstrated the potential value of 99mTc-(V)-DMSA as a non-invasive agent for the evaluation of response to therapy with Gleevec®, a selective tyrosine kinase inhibitor of PDGFR, in malignant glioblastoma (19). In this study, 99mTc-(V)-DMSA uptake demonstrated an inverse correlation between cellular accumulation of 99mTc-(V)-DMSA and gefitinib treatment in all cell lines. Moreover, studies performed with 100 ng/ml EGF demonstrated an increase in 99mTc-(V)-DMSA uptake. These results, therefore, clearly demonstrate that modulation of 99mTc-(V)-DMSA accumulation is linked to modulation of EGFR signaling, due to the specific action of gefitinib on EGFR, and thus reflect phosphate transport.

Effects of gefitinib and EGF on PIT1 expression. Cells were incubated for 48 h with 100 ng of EGF or 10 μM gefitinib (GEF). PiT-1 expression was evaluated at the protein level with cell ELISA (A) and at the RNA level (B) as described in material and method. Each point represents the mean±SD, n=9. Significantly different from the untreated control at *p<0.05, **p<0.001 and ***p<0.001.
In addition, we determined the influence of modulation of EGFR signal mediated by gefinitib and EGF on PiT1 expression at the RNA and protein levels. Our results demonstrated that PiT1 expression follows EGFR modulation. We also demonstrated that a decrease in PiT1 expression, in response to gefitinib, is regulated at transcriptional and post-transcriptional levels in these cell lines. We showed that an increase in PiT1 expression in response to EGF stimulation is regulated both at the transcriptional and post transcriptional level. While there are few articles in literature with regard to PiT-1 regulation, Arar et al. (16) demonstrated that EGF down-regulates NaPi type II phosphate transporter in weaned and suckling rats, and Kakita et al. (25) studied the effect of PDGF on PIT1 expression, which is increased. In tumour cells in vitro, for the first time, we demonstrated on the contrary that gefitinib inhibits PIT1 expression. Furthermore, we demonstrated that EGF stimulates PIT1 expression. These results are also in opposition to those of Xu et al. (26) but their study involved another sodium phosphate transporter type IIb and intestinal reabsorption. Our work shows that PIT1 expression is regulated by EGFR signaling, and is directly linked to cell proliferation. In the present study, we determined the existence of cross-talk between gefitinib acting on the EGFR and PIT1 regulation in these cancer cell lines.
In summary, our investigation confirms the therapeutic potential of gefitinib treatment for malignant glioblastoma, with antitumour effects on phosphate transport. This study opens up new avenues on the function of the PiT protein family and the molecular mechanism involved in cancer cell proliferation, including open questions such as the proliferation-associated function of PiT-1 and EGFR signaling.
Acknowledgements
This work was supported by grants from Ligue National Contre le Cancer – Comité Départemental de la Loire. We thank ASTRA ZENECA society for the gift of gefitinib.
Footnotes
-
Conflicts of Interest
The Authors declare that there is no conflict of interests regarding the publication of this paper.
- Received July 10, 2014.
- Revision received August 20, 2014.
- Accepted August 25, 2014.
- Copyright© 2014 International Institute of Anticancer Research (Dr. John G. Delinassios), All rights reserved