

Abstract
Aim: To identify a simpler method of free circulating DNA (fcDNA) quantitation that may improve the specificity of the prostate cancer prostate-specific antigen (PSA) screening test. Materials and Methods: The patient group consisted of 241 men with elevated PSA/abnormal digital rectal exam (DRE), undergoing prostate biopsy. Serum fcDNA levels were measured by UV absorbance and PicoGreen. Results were compared to previously published quantitative polymerase chain reaction (qPCR) data. Results: We found that levels of fcDNA measured by PicoGreen correlated well with those measured by qPCR (r=0.8552). In the patient group with PSA >4 to 10 ng/ml, those with fcDNA (PicoGreen) >53.1 ng/ml were at increased risk for prostate cancer compared to those with fcDNA ≤53.1 ng/ml. Moreover, we found that measuring fcDNA levels by PicoGreen does not compromise the negative predictive value, accuracy or specificity of the qPCR fcDNA test. Conclusion: If validated in larger studies, PicoGreen quantitation of fcDNA could serve as a simple method to aid in prostate cancer diagnosis.
- Prostate cancer
- cell-free DNA
- biomarker
- screening
- quantitative PCR
- PicoGreen
Prostate cancer is the most commonly diagnosed cancer in the United States, with an estimated 241,740 new cases and 28,170 prostate cancer-specific deaths in 2012 (1). Serum prostate specific antigen (PSA) levels and digital rectal exam (DRE) are currently used in prostate cancer screening. Men with elevated PSA levels (>4 ng/ml) or abnormal DRE are suspected to have prostate cancer and undergo prostate biopsy. Although PSA screening is highly sensitive, it lacks specificity. Only 25-35% of patients with elevated PSA levels (4.1-9.9 ng/ml) undergoing prostate biopsy are diagnosed with prostate cancer, indicating that two-thirds to three-quarters of patients are subjected to unnecessary biopsies (2). Moreover, the prostate biopsy procedure is expensive and painful. A blood-based test that can accurately predict the presence of prostate cancer may greatly help prostate cancer screening by eliminating unnecessary prostate biopsies.
In recent years, measurement of free circulating DNA (fcDNA) has evolved as a non-invasive, rapid and sensitive biomarker for molecular diagnosis, prognosis and monitoring treatment response in various types of cancers including prostate cancer (3-11). As with most blood-based tests, choosing a simple, reliable and efficient method of fcDNA quantitation is a crucial step prior to clinical application of fcDNA as a cancer biomarker. A number of sensitive methods of fcDNA quantitation in serum/plasma have been described (12). Radioimmunoassay (13-15) and direct radiolabeling of purified DNA by nick translation (16, 17) are fairly sensitive and can detect DNA concentrations as low as 25 ng/ml and 1.6 ng/ml respectively. DNA-interacting dyes such as Hoechst, Sybr Green and Gelstar nucleic acid gel stain have also been used (18), but lack sensitivity to detect small amounts of DNA in circulation. The DNA dipstick method has been shown to detect DNA amounts between 0.1 and 10 ng. Additionally, quantitative polymerase chain reaction (qPCR) has also been widely used to quantitate fcDNA amounts. It is a highly sensitive method which can detect DNA concentrations as low as 10 pg/ml (19-21). Detection of circulating nucleosomal DNA by enzyme-linked immunosorbent assay (ELISA) has been reported to show high concordance with qPCR (22), however, this method excludes nucleosome-free DNA and the results are expressed in arbitrary units that make it difficult to determine the sensitivity of this method. So far, the most simple and sensitive method is fluorometric quantitation using PicoGreen, a fluorescent dye that binds to double-stranded DNA. This method requires as little as 25 pg/ml of double-stranded DNA (23-25).
Previously, we have demonstrated that serum fcDNA levels increase the specificity of the PSA test in prostate cancer diagnosis (20). For that study, we used the standard method of fcDNA quantitation, by qPCR. Although this method is sensitive, accurate and highly reproducible, it requires extensive optimization of the PCR reaction conditions, expensive reagents and instruments, and can only be carried out in sophisticated laboratories. These factors limit the utility and acceptability of fcDNA quantitation by qPCR in the clinical setting. Spectrophotometric and fluorescence-based quantification of total fcDNA offer simple and cost effective alternatives to qPCR. To date, there have been few studies comparing other methods of fcDNA analysis to that of the standard qPCR method. Szpechcinski et al. compared plasma fcDNA quantitation by use of the PicoGreen assay and qPCR amplification in 10 patients with lung cancer (26). They found a high level of correlation between the two methods. However, the study was limited by its small sample size. Our study aimed at identifying a rapid, accurate and inexpensive method of quantification of fcDNA quantitation. We compared spectrophotometric and fluorescence-based quantitation of total fcDNA to that of amplifiable DNA levels determined by qPCR in a large patient cohort representing a typical prostate cancer screening setting.
Materials and Methods
Study patients and DNA samples. The patient group consisted of 241 men with PSA levels >4 ng/ml and/or abnormal DRE, undergoing prostate biopsy at the Urology Clinic of the University of Miami/Jackson Memorial Hospitals, between 2004 and 2008 under Institutional Review Board protocols (eprost# 20030736 and 20043200). Blood was collected prior to patients undergoing prostate biopsy. Serum DNA was extracted from 1 ml serum using QIAamp UltraSens virus kit (Qiagen, Valencia, CA, USA) following the manufacturer's protocol. DNA samples remaining after qPCR analysis of fcDNA levels were stored at −20°C.
Spectrophotometric quantitation of serum DNA. Absorbance at 260 nm was measured using a multitask Synergy HT plate reader equipped with a Take3 multivolume plate (BioTek, Seattle, WA, USA). This procedure uses 2-4 μl of DNA sample. Standard curves were generated using known DNA concentrations from 1 μg/ml to 1000 μg/ml to determine the range of detection. Only those values that fell within the standard curve were used for analysis.
PicoGreen quantitation of serum DNA. Quantitation of serum fcDNA were performed using PicoGreen dsDNA kit (Life Technologies, Carlsbad, CA, USA). Briefly, 2.5 μl aliquots of standard or unknown sample were mixed with the diluted working solution of PicoGreen reagent. From this mixture, 4 μl was then loaded to each microspot of the Take3 plate. The blank consisted of 2.5 μl of Tris EDTA (TE) buffer reacted with 2.5 μl of PicoGreen working reagent which was then applied to appropriate microspots of the Take3 plate. After closing the lid of the Take3 plate, it was incubated in the dark for 5 minutes at room-temperature (~22°C), and fluorescence (480 Ex/520 Em) was measured in a Biotek Synergy HT multitask plate reader using Gen5™ Software (Biotek). Standard curves were generated using known DNA concentrations ranging between 10 and 1000 ng/ml. Only those values that fell within the standard curve were used for analysis.
Statistical analysis. Statistical analysis was conducted using SAS version 9.2. We compared patient groups with respect to the distribution of potentially important covariates using the chi-square test for categorical data. Continuous data were analyzed using analysis of variance (ANOVA) followed by Fisher's least-significant-difference test for pairwise mean comparison. Data on the fcDNA were log base10-transformed to stabilize estimates of variance and improve the fit to the normal distribution. Pairwise correlations between fcDNA measurements by the three methods (UV absorbance, PicoGreen, and qPCR) were assessed overall and by patient group (85 prostate cancer cases and 156 controls). Univariate and multivariate logistic regression analyses were used to assess predictivity of serum fcDNA by each method and of other covariates for risk of prostate cancer. Logistic models evaluated fcDNA and PSA as continuous or categorical variables. Odds ratio (OR) estimates with corresponding 95% confidence interval (95% CI) and area under the curve (AUC) of the receiver operating characteristic (ROC) curve for fitted models, as well as estimates of sensitivity, specificity, and accuracy derived from selected models are reported.
Results
Patients' characteristics. Characteristics of patients grouped according to prostate biopsy are reported in Table I. Prostate cancer was diagnosed in 35.3% of the patients. The mean age was 65.5 years for those with prostate cancer, 63.4 for those with prostatitis, and 62.9 for those with benign prostatic hyperplasia (BPH). The prostate cancer group had a significantly higher percentage of blacks (47.1%) than did the prostatitis (18.2%) and BPH (34.7%) groups. The majority of blacks (74.1%) were non-Hispanic and the majority of whites (95.5%) were Hispanic. Comparison of log base2-transformed PSA (log2PSA) in prostate cancer versus BPH and prostate cancer versus benign (BPH+prostatitis) showed there to be statistically significant differences in means, while there was no significant difference in means of log2 PSA between BPH and prostatitis. A similar pattern was observed when patients were categorized according to levels of PSA: ≤4, >4-10 and >10 ng/ml.
Correlation of serum fcDNA levels measured by qPCR, PicoGreen and UV absorbance. Previously, we presented data of serum fcDNA quantitation by qPCR in 252 patients. We have now analyzed fcDNA concentration in serum samples by PicoGreen and by UV absorbance in 241 of these patients. We compared the performance of qPCR, PicoGreen and UV absorbance in these 241 patients. The values of serum fcDNA concentrations measured by qPCR ranged between 0.1 and 2798.6 ng/ml, with a median concentration of 107.1 ng/ml; by PicoGreen between 0.7 and 951.8 ng/ml, with a median concentration of 32 ng/ml; and by UV absorbance between 19.6 and 3900.1 ng/ml, with a median concentration of 315.2 ng/ml. The median serum fcDNA concentrations in the prostate cancer and benign groups were 149.4 and 81.8 ng/ml measured by qPCR, 47.6 and 27 ng/ml measured by PicoGreen, and 328.2 and 282.0 ng/ml, as measured by UV absorbance. The serum fcDNA concentrations determined by UV absorbance were highest, followed by those measured by PCR and PicoGreen.
Characteristics of male patients by prostate gland biopsy outcome.
Despite extensive overlap of fcDNA values between patients with cancer and those with benign disease, levels of fcDNA were observed to be elevated in patients with cancer. Means were compared by t-test, after data transformation (log base-10) to compensate for right-skewed distributions. The difference between cancer and benign groups was statistically significant for fcDNA measured by PCR (p=0.056) and by PicoGreen (p=0.043) but not by UV (p=0.378). Similar results were obtained in analysis of untransformed data using the non-parametric Wilcoxon test for differences in location. Serum fcDNA levels obtained by the PicoGreen assay correlated strongly with that determined by qPCR (r=0.8552; p<0.0001). There was a weak correlation between serum fcDNA levels determined by UV absorbance with that of qPCR (r=0.2274; p=0.0004) and with PicoGreen fluorescence (r=0.2376; p=0.0002) (Figure 1). The correlation between fcDNA levels measured by PicoGreen and by qPCR remained strong when patients were stratified by PSA (≤4, >4 to 10, >10, r=0.7413; p=0.0006, 0.9026; p<0.0001, 0.7345; p<0.0001 respectively). Based on these results, further analysis was carried out using data only from fcDNA levels measured by qPCR and PicoGreen.
Analysis of distribution of fcDNA by PCR and PicoGreen and predictivity of prostate cancer in the group with intermediate prostate cancer risk. Univariate logistic regression analysis, considering log10-transformed fcDNA data as a continuous variable, confirmed the association between risk of prostate cancer and fcDNA as measured by qPCR (OR=1.422, p=0.048) and by PicoGreen (OR=1.687, p=0.045). Since a simpler risk classification of patients into distinct risk groups is desirable, we searched for cut-off points for fcDNA measured by PicoGreen. Sensitivity, specificity, accuracy, OR and its p-value for each observed value of fcDNA measured by PicoGreen were calculated between the 25% and 75% percentiles and potential cut-off points identified were further tested (data not shown). The best discrimination between prostate cancer and benign groups using fcDNA by PicoGreen was found to be at cut-off point of 53.1 ng/ml. In univariate logistic regression models for binary outcome (prostate cancer vs. benign), patients with fcDNA >53.1 ng/ml were at increased risk of prostate cancer compared to those with fcDNA ≤53.1 ng/ml (OR=1.884, 95% CI=1.095-3.242, p=0.022). This was similar to the model including fcDNA measured by qPCR in which we found that patients with fcDNA >180 ng/ml were at increased risk of prostate cancer compared to those with fcDNA ≤180 ng/ml (OR=2.125, 95% CI=1.222-3.695, p=0.008) (Table I, models 1 and 2). Next we performed multivariate analysis including age, race, PSA, fcDNA measured by either qPCR or PicoGreen and tested for interactions. The interaction between fcDNA by qPCR and PSA was significant (p=0.012), while the interaction fcDNA by PicoGreen and PSA and was not significant (p=0.299). ORs derived under these two multivariate models including the fcDNA×PSA interaction are reported in Table II. The effect of fcDNA by either qPCR or by PicoGreen was only significant in the group with PSA >4 to 10 ng/ml. In this PSA group, patients with fcDNA (qPCR) >180 ng/ml were at increased risk for prostate cancer compared to those with fcDNA ≤180 ng/ml (OR: 5.002, 95% CI=2.083-12.014, p<0.001). Likewise, patients with fcDNA (PicoGreen) >53.1 ng/ml were at increased risk for prostate cancer compared to those with fcDNA ≤53.1 ng/ml (OR: 3.197, 95% CI=1.375-7.435, p=0.007) (Table II, models 4 and 5).
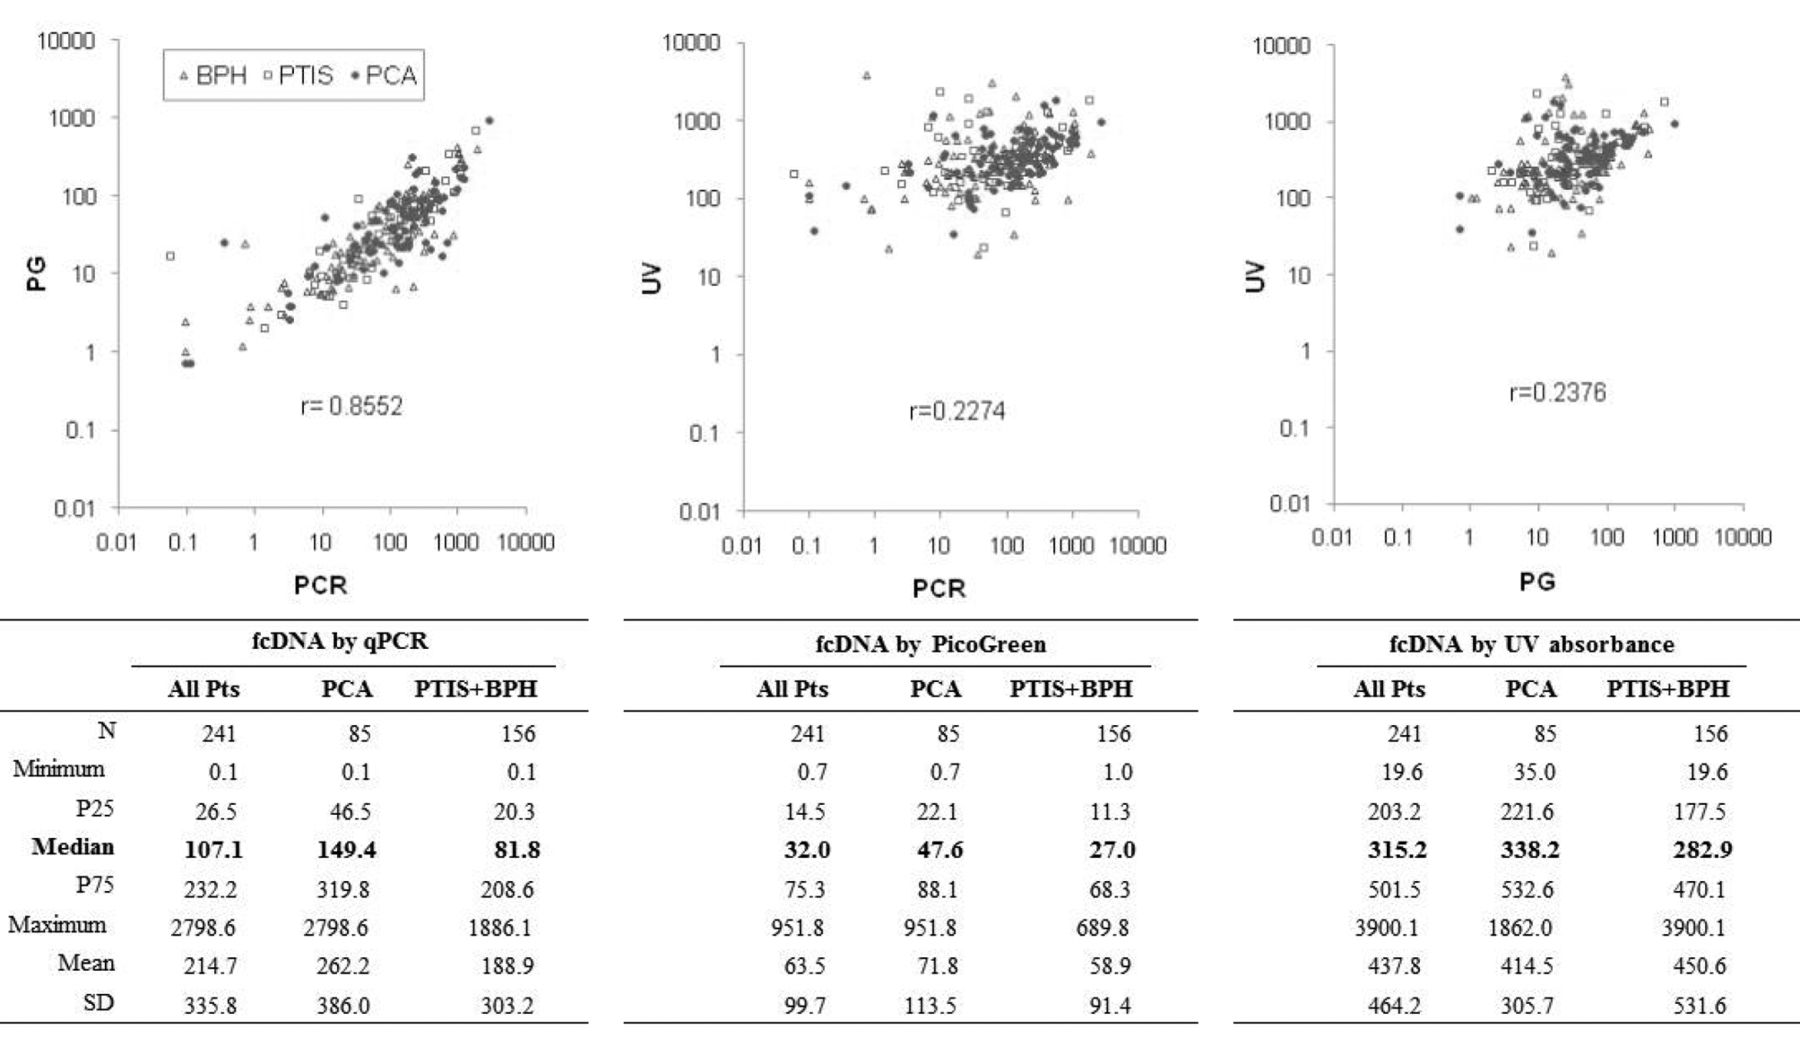
Correlation among three methods for measuring free circulating DNA (fcDNA). Pairwise correlations between fcDNA measurements by the three methods [ultraviolet (UV) absorbance, PicoGreen (PG), and quantitative polymerase chain reaction (qPCR)] were assessed overall and by patient group (85 with prostate cancer (PCA) and 156 benign controls). Results on correlations by group were very similar and are therefore not reported. PTIS, Prostatitis; BPH, benign prostatic hyperplasia; r: Pearson's correlation coefficient considering all patients; P25 and P75: 25th and 75th percentiles respectively; and SD: standard deviation.
In the subset analysis of the 124 patients with PSA >4 to 10 ng/ml, we confirmed that predictivity was improved in multivariate models including fcDNA by PCR or by PicoGreen in addition to race and age. After adjustment for age and race, patients in the intermediate prostate cancer risk group (PSA >4 to 10 ng/ml) with fcDNA (qPCR) >180 ng/ml were at increased risk for prostate cancer compared to those with fcDNA ≤180 ng/ml (OR: 4.369, 95% CI=1.824-10.464, p<0.001). Likewise, after adjustment for age and race, patients in the intermediate prostate cancer risk group (PSA >4 to 10) with fcDNA (PicoGreen) >53.1 ng/ml were at increased risk for prostate cancer compared to those with fcDNA ≤53.1 ng/ml (odds ratio: 3.096, 95% CI, 1.328-7.220, p=0.009) (Table II, models 6 and 7). Similar results were obtained from analysis including PSA as a continuous variable (Table II, models 8 to 12).
Univariate and multivariate estimated effect of free circulating DNA (fcDNA) and other prognostic factors on risk of prostate cancer vs. prostatitis (PTIS)+benign prostatic hyperplasia (BPH).

Receiver operating curves (ROC) from fitted logistic regression models. Logistic regression models for probability of prostate cancer (PCA) including free circulating DNA (fcDNA) measured by quantitative polymerase chain reaction (qPCR) (>180 vs. ≤180 ng/ml) or PicoGreen (PG) (>53.1 vs. ≤53.1 ng/ml), prostate specific antigen (PSA) in three categories (≤4, >4 to 10, ≤10 ng/ml) (A) or as a continuous variable (C), fcDNA×PSA interaction, race (black vs. white), and age (continuous). B and D: Subset analysis of 124 patients in the intermediate prostate cancer risk group with PSA >4 to 10 ng/ml. qPCR and PG models include fcDNA by qPCR or by PG, race, and age, and PSA in three categories (B) or as a continuous variable (D). Ref: Reference model, includes PSA + race + age. AUC: Area under the ROC curve; PP: Predicted probability; Se: Sensitivity; Sp: Specificity; PPV: Positive predictive value; NPV: Negative Predictive Value; ACC: Accuracy.
Comparison of ROCs from fitted logistic regression models. When comparing model AUCs, a statistically significant improvement in predictivity was observed by adding fcDNA by qPCR (>180 vs. ≤180 ng/ml) and its interaction with PSA (≤4, 4 to ≤10 and >10 ng/ml) to the reference model with PSA, race, and age (AUCs: 0.741 vs. 0.681, p=0.024). However, there was no significant improvement at the 5% level by adding fcDNA by PicoGreen (> 53.1 v. ≤53.1 ng/ml) and its interaction with PSA compared to the reference (AUCs: 0.715 vs. 0.681, p=0.130). When considering PSA as a continuous variable, the AUC for the model including fcDNA by PCR (0.755) was similar to that for the model including fcDNA by PicoGreen (0.742, p=0.601), and these were significantly better than AUC=0.703 compared to the reference (0.755 vs. 0.703, p=0.041; 0.742 vs. 0.703, p=0.052).
In the subset analysis of 124 patients with PSA >4 to 10 ng/ml, given the small sample size, there was no significant difference between corresponding AUCs (PCR vs. reference: 0.706 vs. 0.584, p=0.095; PicoGreen vs. reference: 0.654 vs. 0.584, p=0.232; PCR vs. PicoGreen: 0.706 vs. 0.654, p=0.373). Similar results were obtained when including PSA as a continuous variable (AUCs: PCR vs. reference: 0.703 vs. 0.593, p=0.081; PicoGreen vs. reference: 0.672 vs. 0.593, p=0.178; PCR vs. PicoGreen: 0.703 vs. 0.672, p=0.525).
Although in terms of AUC the overall gain is modest, there is considerable gain in specificity at cut-off points defining high sensitivity, including fcDNA measured by qPCR, as well as PicoGreen. Figure 2 shows the ROCs for logistic regression models including fcDNA measured by qPCR (>180 vs. ≤180ng/ml) and PicoGreen (>53.1 vs. ≤53.1 ng/ml), PSA (≤4, >4 to 10 and ≤10 ng/ml), fcDNA×PSA interaction, race (black vs. white), and age (continuous) compared to the reference model (PSA + race + age). Based on the model including fcDNA measured by qPCR and PSA, interaction of fcDNA and PSA, race and age, a predicted probability ≥0.176 yields sensitivity and specificity of 94.1% and 35.9%, respectively. These values are similar to the model including fcDNA measured by PicoGreen and PSA, interaction of fcDNA and PSA, race and age, in which a predicted probability ≥0.188 yields sensitivity and specificity of 94.1% and 27.6%, respectively. Both these models show a gain in specificity over the model without fcDNA at a predictive probability ≥0.181 which yields a similar sensitivity of 94.1%, but a much smaller specificity of 8.3%. Furthermore, we observed a considerable increase in negative predictive value (NPV) in the models including fcDNA measured by both PCR (NPV=91.9%) and by PicoGreen (NPV=89.6%), compared to the model without fcDNA (NPV=72.2%). We also observed an increase in accuracy in both models including fcDNA, by PCR (56.4%) and by PicoGreen (51.0%), compared to the model without fcDNA (38.4%).
Analysis of 124 patients belonging to the intermediate risk group of PSA >4 to 10 ng/ml, in the same manner, showed similar improvements in specificity, NPV and accuracy. Based on the model including fcDNA measured by qPCR, PSA, race and age, a predicted probability ≥0.144 as cut-off point for prostate cancer yields sensitivity and specificity of 84.8% and 42.9%, respectively. These values are similar to those obtained in the model including fcDNA measured by PicoGreen, PSA, race and age, where a predicted probability ≥0.142 yields sensitivity and specificity of 84.8% and 36.3%, respectively. Both these models in the subset analysis show a gain in specificity over the model without fcDNA at a predictive probability ≥0.215 which yields similar sensitivity of 84.8%, but a much lower specificity of 8.8%. We also observed a considerable increase in NPV in the models including free circulating DNA measured by both qPCR (NPV=88.6%) and by PicoGreen (NPV=86.8%) compared to the model without fcDNA (NPV=61.5%). Moreover, we observed an increase in accuracy in the models including fcDNA measured by qPCR (54.0%) or that including fcDNA measured by PicoGreen (49.2%) compared to the model without fcDNA (29.0%). Comparable results were found when including PSA as a continuous variable instead of as a variable with three categories (Figure 2, lower panel).
Discussion
This study was designed with the aim of identifying a simpler method of prostate cancer diagnosis by comparing spectrophotometric and fluorescence-based quantitation of total fcDNA to that of amplifiable fcDNA levels determined by qPCR in a large patient cohort representing a typical prostate cancer screening setting. Previously we had published results of fcDNA by qPCR in serum of 252 patients (20). In the present study, we determined serum fcDNA levels in 241 out of the same 252 patients by two additional methods: (i) spectrophotometric measurement of absorbance at 260 nm and (ii) fluorescent PicoGreen staining. The fcDNA levels measured by these two methods were then compared with those measured by qPCR in the same patients. We found that levels of fcDNA measured by PicoGreen correlated well with those measured by qPCR. There was a significant increase in prostate cancer risk with fcDNA levels above the cut-off points as measured by qPCR and PicoGreen, compared to those with fcDNA levels below or equal to the cut-off points. Moreover, we found considerable increases in specificity, NPV and accuracy in models including fcDNA measurements using both qPCR and PicoGreen over the reference model without fcDNA. These results were true for the entire set of 241 patients, as well as for the subset of patients with PSA >4 to 10 ng/ml, which is the intermediate prostate cancer risk group. These data show that fcDNA levels measured by qPCR and PicoGreen produced similar results upon analysis. Moreover, the results obtained based on PicoGreen measurements of fcDNA levels validate our previously published results on the usefulness of fcDNA as a biomarker to distinguish benign versus malignant prostate disease. Our results indicate that while PicoGreen may be a promising simple alternative to the more sophisticated and labor-intensive qPCR, further studies with a larger set of patients are required to prove the usefulness of PicoGreen analysis of fcDNA in the clinical setting.
To date, there has been a limited number of reports that compare different fcDNA measurement techniques with respect to clinical significance. Szpechcinski et al. (26) compared the applicability and efficacy of PicoGreen and qPCR in monitoring the fcDNA levels in blood of 10 patients with resectable non-small cell lung cancer. They observed a high degree of correlation with both SybrGreen (r=0.87, p<0.0001) and TaqMan probe PCR quantitation (r=0.94, p<0.0001). The authors observed that the total DNA content measured by PicoGreen was several-fold higher than that determined by both qPCR methods. We recorded lower levels of fcDNA using PicoGreen quantitation method (median=107.1 ng/ml) compared to that of qPCR (median=32.0 ng/ml). This is also reflected in the determined cut-off value of 180 ng/ml by PCR and 53.1 ng/ml by PicoGreen. We attribute this discrepancy to the differences between the two methods. Although PicoGreen fluorescence measures total DNA while qPCR measures only the amplifiable fragment, qPCR has been shown to be a more sensitive technique for fcDNA quantitation (10 pg/ml) compared to PicoGreen, which has a sensitivity of 25 pg/ml. Since the target sequence for PCR amplification is <100 bp, we presume that there may also not be significant differences in levels of amplifiable fcDNA compared to that of total fcDNA.
Our study is, as far as we know, the first to compare fcDNA quantitation methods in a large set of patients. In addition, our study population represents the typical distribution of patients referred for prostate biopsy on the basis of elevated PSA levels and/or abnormal DRE. In our patient cohort, 35% of patients were diagnosed with prostate cancer, similar to results obtained in other studies (2). Our results show the significance of fcDNA analysis in the intermediate prostate cancer risk group with PSA >4 to 10 ng/ml. This is of importance because 65-75% of patients belonging to this group are subject to unnecessary biopsies. A test which improves the specificity and NPV of the current PSA test is highly desirable for prostate cancer screening and detection so that men who can forgo biopsy and be spared the discomforts of prostate biopsy can be identified. Our results show that with a high NPV of 86.8%, including fcDNA measured by PicoGreen can spare 36% of patients with PSA >4 to 10 ng/ml of unnecessary biopsies. This shows that measuring fcDNA levels by PicoGreen does not compromise the NPV, accuracy or specificity of the fcDNA test. If validated in large independent studies, PicoGreen quantitation could provide a simple method of fcDNA quantitation in prostate cancer diagnosis.
Acknowledgements
This work was supported by funding by Women's Cancer Association, University of Miami to RS and KR.
Footnotes
-
* These Authors contributed equally to this work.
- Received July 27, 2013.
- Revision received August 2, 2013.
- Accepted August 6, 2013.
- Copyright© 2013 International Institute of Anticancer Research (Dr. John G. Delinassios), All rights reserved