

Abstract
E-Cadherin and vimentin protein expression was assessed in late stage non-small cell lung cancer tumors from the placebo controlled clinical trial, NCIC-CTG BR.21, to determine if these markers had the potential to predict outcome of erlotinib therapy. E-Cadherin and vimentin protein expression levels were assessed in tumors from 95 patients, who were representative of the overall population, using semi-quantitative immunohistochemistry. The percentage of tumor cells with grades 0, 1, 2, or 3 membrane staining of E-cadherin and cytoplasmic staining of vimentin was measured. Three scoring methods and multiple cut-offs were explored to determine if these markers were able to divide patients into groups with different overall survival (OS). A cut-off point for E-cadherin of ≥40% tumor cells with staining of +2 and +3 and a cut-off for vimentin of ≥10% of tumors cell with any staining provided the optimal stratification. The OS hazard ratio (HR) for E-cadherin+ versus E-cadherin− in the erlotinib-treated patients was 0.68 (0.35-1.33) compared with 1.48 (0.69-3.15) in the placebo patients and the OS (HR) for erlotinib versus placebo was 0.47 (0.26-0.88) in E-cadherin+ patients compared with 1.12 (0.52-2.44) in the E-cadherin− patients. The OS (HR) for vimentin+ versus vimentin− in the erlotinib-treated patients was 0.65 (0.31-1.38) compared to 2.32 (1.09-4.94) in the placebo-treated patients and the OS (HR) for erlotinib versus placebo was 0.26 (0.11-0.63) in vimentin+ compared to 0.99 (0.55-1.76) in the vimentin− patients. Similar trends were observed for progression-free survival and response rate. E-Cadherin and vimentin are biomarkers worthy of additional study as predictive markers of outcome of erlotinib therapy.
- E-Cadherin
- vimentin
- erlotinib
- EMT
- non-small cell lung cancer
Epidermal growth factor receptor (EGFR) is expressed in a number of human malignancies (1-6), and its associated tyrosine kinase is the target for erlotinib (Tarceva®; OSI Pharmaceuticals LLC, Farmingdale NY, USA), a small-molecule tyrosine kinase inhibitor (TKI) approved for non-small cell lung cancer (NSCLC) and pancreatic cancer. Not all patients respond to erlotinib, so there is intense interest in finding molecular markers for predicting outcome and guiding treatment. EGFR-activating mutations increase sensitivity to gefitinib (7) and EGFR mutational status has been shown to strongly predict for outcome to erlotinib (8) and may currently be the best marker for EGFR TKIs (9). However, the number of NSCLC patients with these mutations in the Western population is small, and the marker does not provide guidance on alternative therapies. Therefore, additional markers that predict outcome need to be identified and evaluated, especially in the EGFR wild-type population.
Wild-type EGFR-containing NSCLC cells and xenograft tumor models show a range of sensitivities to erlotinib depending on the degree to which they have undergone an epithelial to mesenchymal transition (EMT), as characterized by the loss of E-cadherin and gain of vimentin expression (10-13). Similar results have been observed using gene expression and proteomic profiling suggesting EMT may be a general biological switch that renders NSCLC and pancreatic tumors sensitive or insensitive to EGFR inhibition (14, 15).
Clinically, the TRIBUTE trial demonstrated E-cadherin to be both prognostic and predictive of erlotinib treatment outcomes, and a marker that identified a subset of patients different from those who have increased EGFR protein expression and EGFR copy number (12). These findings suggested E-cadherin plays a mechanistic role in defining sensitivity to erlotinib, as well as providing a biomarker that may define NSCLC tumors most likely to respond to erlotinib treatment. The TRIBUTE trial compared erlotinib plus chemotherapy with chemotherapy alone, however, so interactions between E-cadherin and chemotherapy cannot be ruled out. A clinical trial that compares E-cadherin and vimentin expression with outcomes in erlotinib-treated versus untreated patients offers a more rigorous dataset for evaluating the predictive and prognostic value of these markers.
Patient characteristics.
The NCIC-CTG BR.21 study demonstrated the effectiveness of erlotinib as second- and third-line therapy for NSCLC patients compared with an untreated (placebo control) population (16). Biomarker analyses of tumor samples from this study, including EGFR protein expression, EGFR copy number, EGFR mutation, and KRAS mutation, have been conducted and published (17, 18). The analyses described here explored the potential of E-cadherin and vimentin protein expression, assessed by semi-quantitative immunohistochemistry, to serve as predictive and prognostic markers of overall survival (OS), progression-free survival (PFS), and tumor response (RR) in NSCLC patients following treatment with and without erlotinib.
Progression-free survival (PFS) and overall survival (OS) cut-off point analysis of E-cadherin staining of intensity 2 plus 3: comparing E-cadherin positive (P) versus negative (N) groups within treatment arms.
Materials and Methods
Patient samples. Tumor tissues from the NCIC-CTG BR21 trial were collected primarily at the time of diagnosis using standard histological processes for fixation and the production of slides for tissue acquisition. The use of the tissue for this research was approved by the NCIC-CTG Lung Cancer site's Correlative Science and Tumor Biology (CSTB) Working Group and by the Queen's Hospital Research Ethics Board (Queen's University, Kingston ON, Canada). Slides and blocks were kept at ambient room conditions before use.
Immunohistochemistry (IHC). IHC was used to detect and quantify E-cadherin and vimentin protein expression on the formalin-fixed paraffin-embedded tissue sections. The staining was conducted using the antibodies and staining procedures outlined below. These antibodies were selected after rigorous screening of six commercially available E-cadherin and vimentin antibodies based on several criteria including, the ability to reliably stain appropriate tissues in NSCLC. The procedures used followed established standard operating procedures. Tissues were initially treated with a retrieval method to maximize availability of epitopes (Target Retrieval Solution [10×] [S1699] pH 6, mixed 1:10 with deionized water; Dako, Carpinteria, CA, USA). Separate slides were then treated with either biotinylated anti-E-cadherin (1:50 clone 24E10; Cell Signaling, Danvers, MA, USA) or anti-vimentin (1:100 clone V9; Dako) primary antibodies following the manufacture's instructions. Specificity of each antibody for its epitope was established by the manufacturer, although quantitative relationships between the amounts of epitope in a tissue section determined by IHC and by other methods have not been established. Excess antibody was removed by rinsing, and the presence of the antibody was visualized using the avidin-biotin peroxidase complex technique (Vectastain Elite ABC kit; Vector Laboratories, Burlingame, CA, USA) with secondary and tertiary antibody steps to label the antibodies with horseradish peroxidase (HRP), and using 3,3’-diaminobenzidine (DAB) as the HRP substrate. Slides were counter-stained with Gill's hematoxylin.
Quantification of immunostaining and analysis. Using light microscopy, the relative intensity of the brown oxidized DAB in each of a given number of the epithelial NSCLC tumor cells, defined using established histologic criteria, was visually assessed and then recorded by a trained pathologist for each E-cadherin and vimentin stained tissue. In this manual evaluation of tumor specimens, the pathologist used the whole tissue section to make an evaluation and generate a score. All viable epithelial NSCLC tumor cells were included in the scoring as the intensities were based on a percentage of the total tumor population and not random or preselected fields of view. The assessment of tissues was conducted at a variety of microscopic magnifications with the pathologist often rotating between magnifications to make the assessment. Magnifications of 2-40 were commonly used in making a final assessment of IHC staining intensities and percentages of stained cells. Heterogeneity in NSCLC is a common finding (e.g. IHC staining intensities can vary throughout the tumor) and therefore all areas of the tumor were evaluated in order to avoid a biased selection of more or less intense staining areas. Thus the number of cells evaluated in each tissue differed depending on the amount of evaluable tissue/cells available. Four intensity levels were used in scoring: 0 for no staining, +1 for weak or minimal staining, +2 for moderate staining, and +3 for strong staining. The percentage of tumor cells that expressed either E-cadherin or vimentin at each intensity level was recorded. These data were used in the exploratory cut off analyses described below. Examples of staining and scoring are provided in Figure (1a-d).
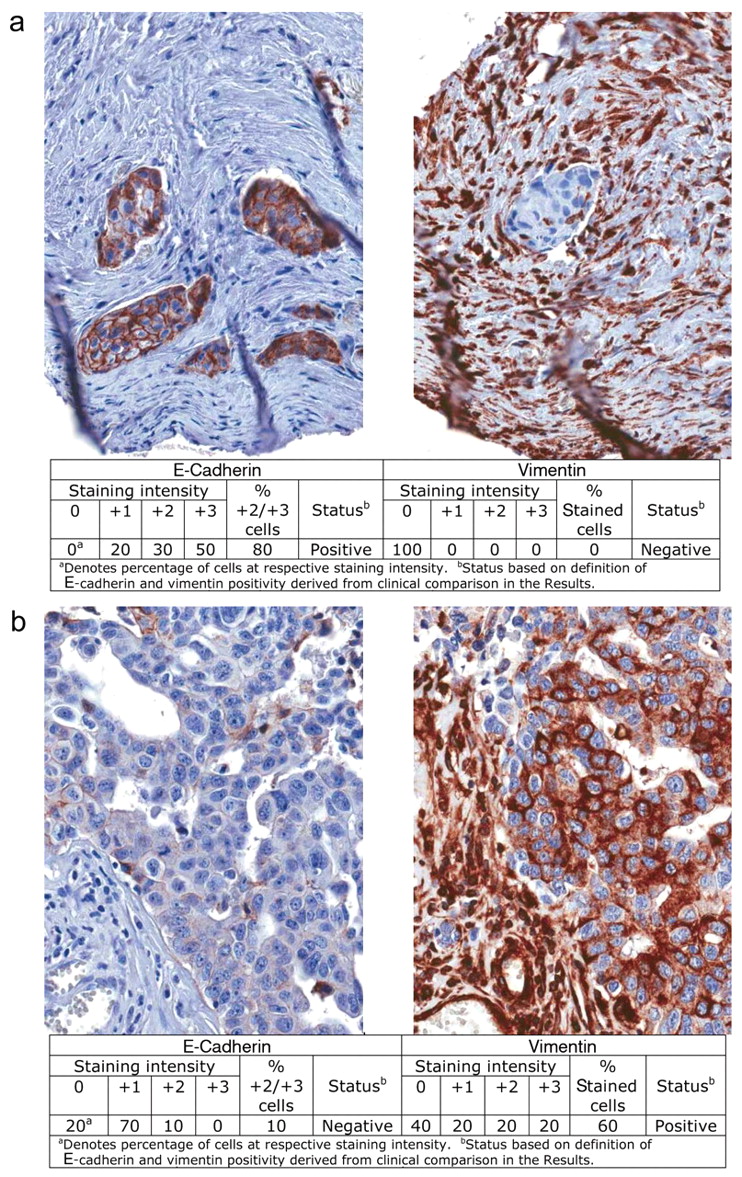

Examples of the four classifications of E-cadherin and vimentin status in epithelial NSCLC tumor cells based on the criteria described in the Results. a: E-Cadherin+/vimentin−; b: E-cadherin−/vimentin+; c: E-cadherin+/vimentin+, d: E-cadherin−/vimentin−.

Example of an NSCLC tumor in which identical tumor cells stain positively for E-cadherin and vimentin.
Progression-free survival (PFS) and overall survival (OS) cut-off point analysis of E-cadherin staining of intensity 2 plus 3: comparing erlotinib (E) versus placebo (P) groups.
Progression-free survival (PFS) and overall survival (OS) cut-off point analysis of vimentin staining of any intensitya: comparing vimentin-positive (P) and vimentin-negative (N) groups within treatment arms
Statistical analysis. Treatment groups as randomized interferon to treat [(ITT) population] were analyzed using all patients with evaluable tissue. Disease progression as assessed by the investigator was used for PFS analysis. Potential predictive benefits of E-cadherin or vimentin expression were assessed by log-rank analyses to compare trends in the hazard ratios (HRs). Multivariate Cox models were used to assess the interaction of treatment and biomarker effect.
Using raw data generated as described above and the clinical data on OS and PFS, three scoring methods were compared in sensitivity analyses to determine the optimal cut-off points for E-cadherin and vimentin: (i) percentage of stained of tumor cells regardless of score; (ii) percentage of tumor cell staining of intensity +2 or +3; and (iii) composite H score. The H-score is a sum of the percentage of cells at each intensity multiplied by the intensity. For example, a sample reading: 5% unstained, 35% staining of intensity +1, 45% staining of intensity +2, and 15% staining of intensity +3, would be scored as follows for the three scoring systems: i) 95% any staining; ii) 60% staining of intensity +2 or +3; and iii) a composite H-score of 0(5) + 1(35) + 2(45) + 3(15) = 170. The H-score ranges from 0 to 300. Only those cut-off points resulting in at least ten patients in each subset and with each subset comprising 20-80% of the 95 evaluable patients were considered. The optimal scoring system and cut-off point for each marker was one that provided the greatest significance and the lowest HR in OS comparing erlotinib versus placebo in the respective E-cadherin+ or vimentin+ subgroups while also having an HR in OS of 1 or above in the E-cadherin+ versus E-cadherin− or vimentin+ versus vimentin− placebo subgroups. The OS HRs of erlotinib versus placebo in the E-cadherin− and vimentin− subgroups and the OS HRs for E-cadherin+ versus E-cadherin− and vimentin+ versus vimentin− in the erlotinib-treated group were determined, as well as PFS HRs for these groups.
OS was defined as the time between the date treatment started and the date of death. If the patient received study treatment but was still alive or a death date was unavailable, OS was calculated as the difference between the study treatment start date and the last date the patient was known to be alive. PFS was defined as the time from the study treatment start date to the documented date of disease progression or death. As with OS, if no progression/death date was available, the PFS was calculated as the time from the study treatment start date to the last documented tumor assessment date, and was noted as being censored.
Cell culture and treatments. NCI-H358 (H358) cells were cultured and treated as described elsewhere (11, 19). To induce EMT, cells were plated on glass cover-slips and treated with 10 ng/ml transforming growth factor-β1 (TGFβ1) (EMD-616450; EMD Biosciences, San Diego, CA, USA) for 7 days with one change of medium and ligand at day 3 to 4. After 7 days, cells were treated with 10 μM erlotinib for 24 hours in the continued presence of TGFβ, and then fixed in 4% paraformaldehyde.
Progression-free survival (PFS) and overall survival (OS) cut-off point analysis of vimentin staining of any intensitya: comparing erlotinib (E) versus placebo (P) groups.
Immunofluorescence. After fixation, cells were stained for E-cadherin, vimentin and active caspase-3 following standard immunofluorescence protocols. Primary antibody sources were as follows: E-cadherin sc-21791 (Santa Cruz Biotechnology Inc., Santa Cruz, CA, USA); vimentin AB5733 (Millipore, Billerica, MA, USA); active caspase-3 559565 (BD Pharmingen, BD Biosciences, Franklin Lakes, NJ, USA). Secondary antibodies: AlexaFluor 488 anti-mouse; AlexaFluor 568 anti-chicken, AlexaFluor 633 anti-rabbit antibodies were from Invitrogen Corp., Carlsbad, CA, USA. Cells were mounted in ProLong Gold plus 4’,6-diamidino-2-phenylindole (DAPI) (Invitrogen). Images were captured on using AxioVision software on a Zeiss AxioObserver microscope and camera with the Apotome accessory for visualization of fluorescence. E-Cadherin, vimentin and active caspase-3 staining were evaluated in each cell, A cell was scored as positive for the marker if staining was visible in the image of the cell. At least 400 cells were scored per treatment. Results were presented according to the E-cadherin/ vimentin status and according to the number of cells in each category that was positive for active caspase-3. The experiment was repeated twice with similar results.
Results
Evaluation and scoring of E-cadherin and vimentin in tumor sections. Of the 325 patient biopsy tissues obtained in the BR21 study, 95 were suitable for E-cadherin/vimentin evaluation. The reduction in usable tissue was due to depletion of tissue for previous biomarker analyses or unacceptable quality of the some of the remaining tissue. In this study, an aggressive approach was made to evaluate as many acceptable tissue specimens as possible, scoring all viable epithelial NSCLC cells in the entire tumor section. The majority of the 95 evaluable tumors were large sections with more than 100 tumor cells scored. Only four of the tumor sections were too small to allow scoring of at least 100 cells. The number of cells evaluated in these four tumor sections was between 60-100 cells. Retrospective analyses suggested a direct relationship between tissue size and score for E-cadherin but not for vimentin in this study (data not shown). The demographic characteristics of these 95 patients were comparable with the entire 731 patients enrolled in the study (Table I). Similarly, the overall OS and PFS of these 95 patients were similar to the overall study population (OS HR=0.76 in the overall population versus HR=0.69 in the E-cadherin/vimentin evaluable subset; and PFS HR=0.64 in the overall population versus HR=0.72 in E-cadherin/vimentin evaluable subgroup).
Overall survival (OS) by E-cadherin and vimentin groups.
Overall survival (OS) by E-cadherin or vimentin within treatment groups.
Progression-free survival (PFS) by E-cadherin or vimentin by treatment groups.
Progression-free survival (PFS) by E-cadherin or vimentin within treatment groups.

Kaplan-Meier curves for overall survival (OS) of subsets of patients based on E-cadherin status as defined in the Results. Comparisons are: a: E-cadherin+ versus E-cadherin− for placebo-treated patients; b: E-cadherin+ versus E-cadherin− for erlotinib-treated patients; c: erlotinib versus placebo for E-cadherin− patients; d: erlotinib versus placebo for E-cadherin+ patients.
E-Cadherin and vimentin staining in these samples was robust and a range of scoring intensities and percentages of tumor cells stained were recorded. Dual expression of E-cadherin and vimentin in the same tumor cells was observed in some samples (Figure 2)
Comparison of E-cadherin and vimentin expression and OS. Three scoring systems with multiple cut-off points were separately correlated with OS. These sensitivity analyses optimized the HRs and significance for erlotinib versus placebo-treated subsets. The resultant optimized scoring system and cut-off defined the breakpoint between an E-cadherin+/E-cadherin− or a vimentin+/vimentin− tumor. The cut-off point analyses for the optimal scoring system are provided in Tables II, III, IV and V. An E-cadherin+ tumor was defined as a tumor in which ≥40% of the tumor cells had staining intensities of +2 or +3. Using this cut-off point, 63% of the 95 tumors were classified as E-cadherin+ and 37% were classified as E-cadherin− (data not shown). Similarly, a vimentin+ tumor was defined as a tumor with ≥10% of tumor cells with cytoplasmic staining intensity >0. Using this cut-off point, 29% of the 95 tumors were classified as vimentin+ and 71% were classified as vimentin−,16% of the samples were E-cadherin+ and vimentin+, 14% were E-cadherin− and vimentin+, 47% were E-cadherin+ and vimentin−; 23% were E-cadherin− and vimentin−. Examples of E-cadherin+/− and vimentin+/− tumors are provided in Figures 1a-d.
The Kaplan-Meier curves for OS and PFS using these cut-off points are presented in Figures 3, 4, 5 and 6. Because the BR21 trial has an untreated placebo group, the prognostic contribution of each marker can be examined. OS HRs (95% CI) of 1.48 (0.69-3.15) in E-cadherin+ versus E-cadherin- and 2.32 (1.09-4.94) for vimentin+ versus vimentin-in the placebo group suggest that positive expression of both of these markers is associated with poor outcome in an untreated population.

Kaplan-Meier curves for overall survival (OS) of subsets of patients based on vimentin status as defined in the Results. Comparisons are: a: vimentin+ versus vimentin− for placebo-treated patients; b: vimentin+ versus vimentin− for erlotinib-treated patients; c: erlotinib versus placebo for vimentin− patients.; d: erlotinib versus placebo for vimentin+ patients.
Positive expression of E-cadherin and positive expression of vimentin were associated with a positive outcome in erlotinib- versus placebo-treated groups with HR=0.47 (0.26-0.88) for E-cadherin+ and OS HR=0.26 (0.11-0.63) for vimentin+. The separation of treatment groups was not apparent for E-cadherin− HR=1.12; (0.52-2.44) and vimentin− HR=0.99 (0.55-1.76) groups. Within the erlotinib-treated group the E-cadherin+ and vimentin+ subsets appeared to gain greater benefit compared to the E-cadherin- and vimentin-subsets. OS HRs for E-cadherin+ versus E-cadherin− were 0.68 (0.35-1.33) and for vimentin+ versus vimentin− were 0.65 (0.31-1.38). Multivariate analysis for interaction between treatment and E-cadherin status showed a similar result but was not significant (p=0.11). Multivariate analysis for interaction between treatment and Vimentin status also showed a similar result and was significant (p=0.02). Median survival results are provided in Tables VI and VII.
Univariate analyses using PFS showed similar trends (Figures 5 and 6) as did multivariate analyses for interaction between treatment and E-cadherin status (p=0.07) and treatment and vimentin status (p=0.002). Median PFS results are provided in Tables VIII and IX. Qualitatively similar results were observed when comparing E-cadherin and vimentin status with response rate based on complete (CR) plus partial (PR) response and based on CR, PR, and stable disease (SD) (Table X).
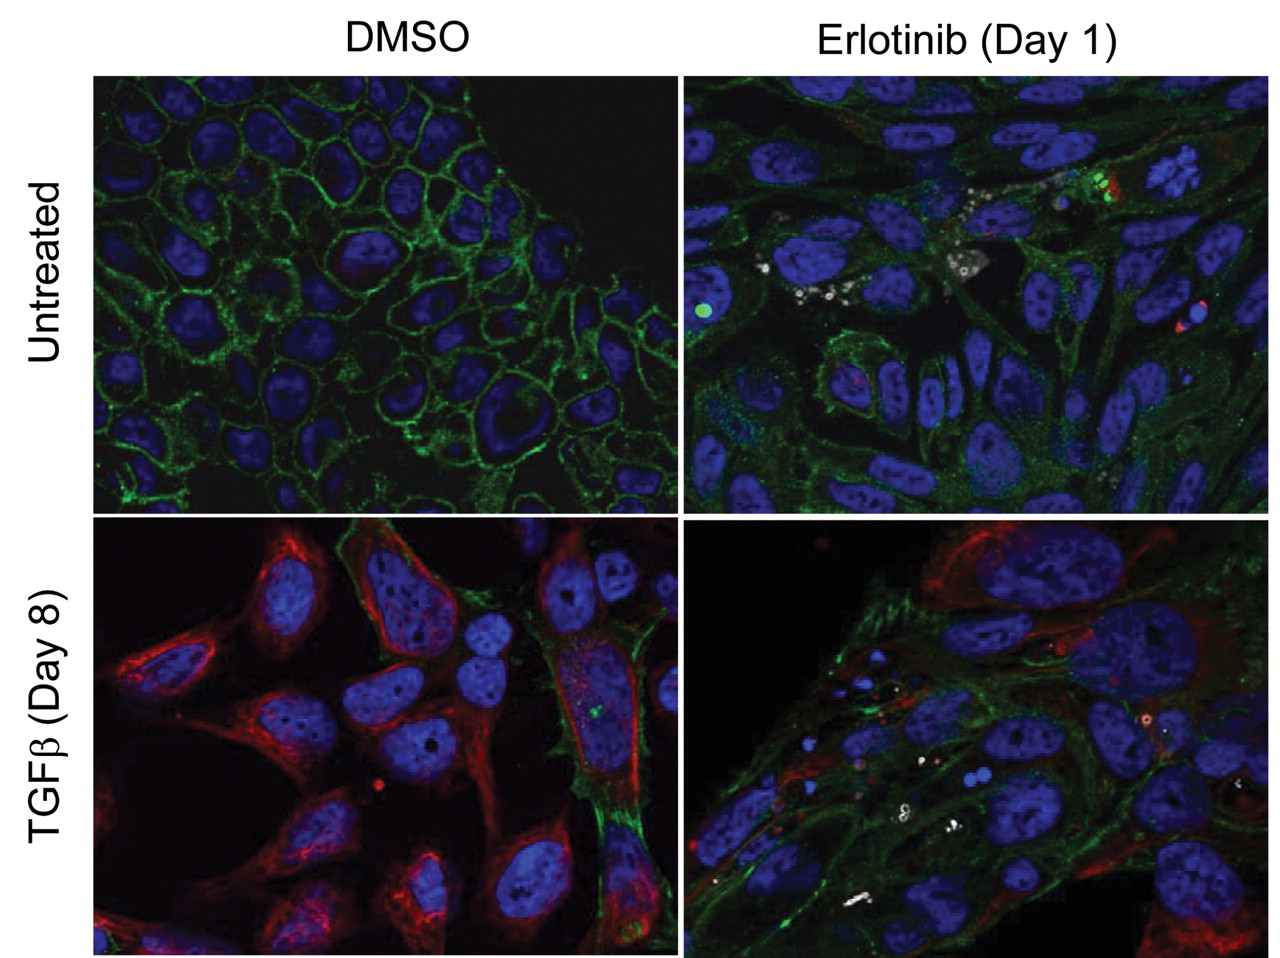
In vitro analysis of erlotinib sensitivity in E-cadherin/vimentin dual positive cells. Previously published work from our group and others has shown low E-cadherin expression and high vimentin expression correlates with reduced sensitivity to erlotinib and other EGFR inhibitors in cultured cell lines (10, 11). We were therefore surprised to see that in this clinical study positive expression of vimentin correlated with better response to erlotinib. To further investigate this association, we examined erlotinib sensitivity in a TGFβ-driven in vitro model of EMT in NCI-H358 NSCLC cells in which naïve cells are sensitive to erlotinib and TGFβ-treated cells have reduced sensitivity (11, 19). In contrast to cell lines that are fixed in the epithelial or mesenchymal states, this metastable or reversible model exhibits a mixed population of cells with some cells classified as E-cadherin+/vimentin−, some as E-cadherin−/vimentin+, and some as E-cadherin+/vimentin+ (Figure 7 and Table XI). This allowed us to examine sensitivity to erlotinib in populations of cells at different positions along the EMT spectrum. After exposing naive and TGFβ-treated H358 cells to erlotinib, we assessed sensitivity using active caspase-3 as a marker for apoptosis. Under these conditions, E-cadherin+/vimentin−, cells were found to be sensitive, and E-cadherin−/vimentin+ cells were insensitive (Table XII), consistent with published work. Interestingly, cells that were E-cadherin+/vimentin+, and therefore considered ‘pre-EMT’ or ‘partial EMT’ cells, were also sensitive to erlotinib, suggesting that co-expression of E-cadherin and vimentin may indicate a still erlotinib-sensitive state of EMT.

Kaplan-Meier curves for progression-free survival (PFS) of subsets of patients based on E-cadherin status as defined in the Results. Comparisons are: a: E-cadherin+ versus E-cadherin− for placebo-treated patients; b: E-cadherin+ versus E-cadherin− for erlotinib-treated patients; c: erlotinib versus placebo for E-cadherin− patients; d: erlotinib versus placebo for E-cadherin+ patients.
Discussion
Tissue samples from study BR.21 offered the opportunity to conduct exploratory analyses which evaluated the predictive and prognostic potential of E-cadherin and vimentin expression on OS and PFS.
A positive expression of either E-cadherin or vimentin appeared to forecast a better clinical outcome with erlotinib in this patient population. Based on previous preclinical and clinical data, as well as a biological link between EGFR and E-cadherin, the positive correlation between E-cadherin staining and positive outcome to erlotinib was not surprising (11, 12). Similar results were observed in a small study with the EGFR TKI inhibitor gefitinib (20). Careful analysis of biomarker data requires evaluation of possible confounding factors, including the presence of EGFR mutations, that may skew biomarker results. Due to the small numbers of patients in this study, it is difficult to thoroughly assess the impact of these factors. That said, we did find 11 patients in this study with EGFR mutations but did not find an association between the presence of these mutations and E-cadherin- or vimentin-positive status (data not shown). Comparing clinical outcomes to E-cadherin status in the placebo group suggested that E-cadherin positivity is prognostic for poor OS and RR, but not PFS, in contrast to previous studies that evaluated prognostic potential in early- and late-stage NSCLC (21, 22).

Kaplan-Meier curves for progression-free survival (PFS) of subsets of patients based on vimentin status as defined in the Results. Comparisons are: a: vimentin+ versus vimentin− for placebo-treated patients; b: vimentin+ versus vimentin− for erlotinib-treated patients; c: erlotinib versus placebo for vimentin−patients; d: erlotinib versus placebo for vimentin+ patients.
The correlation between a positive clinical outcome from erlotinib therapy and positive vimentin expression within the tumor bed suggests that in the earliest stages of EMT (prior to loss of cell–cell junctions), cells may retain EGFR dependence. This was not anticipated based on previous in vitro analyses, which demonstrated that fully mesenchymal cells that are E-cadherin−/vimentin+ do not respond to erlotinib as well as cells not expressing vimentin (11-13). Additional analysis of our data based on RR suggested that a patient with an E-cadherin+/vimentin+ tumor may derive the most benefit, while a patient with an E-cadherin−/vimentin− tumor would derive the least benefit. This result is supported by our in vitro model of EMT where E-cadherin+/vimentin+ cells showed higher rates of apoptosis than did E-cadherin+/vimentin− cells. The reason for this finding is not known but several possibilities should be considered. Unlike E-cadherin, the biological link between vimentin and EGFR, and thus a mechanistic link between vimentin, treatment outcome, and erlotinib, is less clear. Therefore in the case of vimentin, it may not be appropriate to directly extrapolate from in vitro to more complex in vivo systems. Secondly, it can be postulated that the method of scoring the BR21 samples may have produced results inconsistent with the original hypothesis. This study did not assess tumor cells in the stromal compartments, and inflammatory and stromal cells were excluded. A possible prognostic effect of vimentin, where patients with tumors of low vimentin expression appeared to have better OS, was observed, consistent with a previous report (24). Whether changing the scoring methods for vimentin to include cells that may appear more mesenchymal in nature, and/ or whether the use of multiple markers for evaluation of mesenchymal properties would alter the overall results is not known. However, it is clear that using the scoring system reported here, a strongly positive association between vimentin positivity and positive clinical outcome of erlotinib therapy was observed, an association not observed for the placebo group. As with E-cadherin, a preliminary analysis suggested that vimentin positivity did not co-segregate with other demographic, histologic, or molecular factors, and the small interaction between smoking and vimentin status did not appear to be sufficient to drive the relationship between vimentin status and clinical outcome. As such, expression of vimentin, or co-expression of E-cadherin and vimentin may also prove to be useful classifiers to identify patients that benefit from erlotinib therapy. Further research on larger datasets would provide additional clarification regarding these observations.
Immunofluoresence of NCI-H358 cells treated to induce epithelial to mesenchymal transition (EMT) and stained for E-cadherin, vimentin and active caspase-3. Naive or transforming growth factor-β pretreated NCI-H358 cells were exposed to erlotinib or vehicle (DMSO) for 24 hours. Cells were stained for E-cadherin (green) and vimentin (red) to evaluate EMT status (Table II) and active caspase-3 (white) to evaluate sensitivity to erlotinib (Table III). Cells were counterstained with 4’,6-diamidino-2-phenylindole (DAPI) to visualize nuclei (blue).
In conclusion, this exploratory analysis of residual tissue samples from the NCIC–CTG BR21 study demonstrated that E-cadherin and vimentin protein expression can identify subsets of patients that appear to gain greater benefit than the overall population from erlotinib treatment. While encouraging, the analyses were conducted retrospectively and the data were derived from a small, although representative subset of the overall population. It is hoped that these findings will spur interest in analyses of these markers in other clinical trials in order to further evaluate their utility in guiding treatment with erlotinib and possibly other EGFR inhibitors.
Complete response (CR), partial response (PR) and stable disease (SD) in patients with measurable disease by E-cadherin and vimentin.
Population heterogeneity in transforming growth factor-β1 (TGFβ1)-driven metastable model of epithelial to mesenchymal transition. Figures indicate the number and proportion of total NCI-H358 cells counted that fall within the indicated marker status.
Sensitivity of E-cadherin/vimentin subpopulations to erlotinib treatment. Figures indicate the number and proportion of active caspase-3-positive NCI-H358 cells within the indicated populations after erlotinib treatment.
Acknowledgements
We thank the NCIC-CTG, Dr. Frances Shepherd and Dr. Leslie Seymour for guidance and support; Ms. Beth Johnson (OSI/Astellas) and Mr. Andrew Gearhart (OSI/Astellas) for technical assistance in tissue preparation and sample collection, and Dr. John Haley (OSI/Astellas) for intellectual support in the writing of the manuscript.
- Received August 18, 2011.
- Revision received December 13, 2011.
- Accepted December 14, 2011.
- Copyright© 2012 International Institute of Anticancer Research (Dr. John G. Delinassios), All rights reserved