

Abstract
Background: P150, a 150 kDa protein, was isolated from virally and oncogene-transformed mouse cell lines, partially purified and cloned. P150 is part of the large subunit of the eukaryotic translation initiation factor 3 with sequence homology to centrosomin A. A significant correlation between p150 expression and malignancy in breast, cervical and esophageal cancer have recently been demonstrated. Materials and Methods: Here, 110 colorectal carcinomas of different grades and stages, including lymph node and liver metastases were compared to adjacent normal mucosa by immunohistochemistry of P150. Western blot analysis of selected cases confirmed the expression levels determined by immunohistochemistry. Additionally, immuno-electron and laser scanning microscopy (LSM) was performed. Results: All investigated carcinomas revealed high levels of p150 protein compared to normal adjacent mucosa. The staining intensity was slightly heterogeneous, and positivity was correlated to the tumor grade with statistically significant differences of p150 expression between normal and neoplastic mucosa (p<0.0001, Kruskal-Wallis test). Western blots confirmed higher expression levels of p150 in the tumor. Immunogold labelling and LSM investigation showed high expression levels of p150 on the rough endoplasmic reticulum and polyribosomes, indicating that p150 is translationally active in these tumors. Conclusion: Thus, we propose that p150 plays an important role in development and growth of colorectal carcinomas. Furthermore, p150 expression might provide us with reliable information on the biological behaviour of tumors and the clinical course of the disease.
- Histochemistry
- actin
- tubulin
- electron microscopy
Tumorigenesis is a multistep process in which genetic alterations, such as gene amplifications, deletions, translocations and other mutations, gradually accumulate in cells (1). These genetic alterations often affect the growth and proliferation of malignant cells. Non-neoplastic cells are growth-arrested in G0, and they only enter the S/G1 stages of the cell cycle in response to particular stimuli, whereas malignant cells proliferate independently of these growth stimuli. The regulation of cell growth and proliferation is strictly correlated to the level of protein synthesis (43). Periods of active cell growth are associated with high levels of protein synthesis, whereas periods of low cell growth are associated with suppressed protein synthesis. Accordingly, several studies have reported overexpression of translation initiation factors in tumor tissues (29, 40, 44, 51) which can transform cells in tissue culture.
Eukaryotic protein synthesis requires the participation of numerous translation initiation factors (eIFs) (43), which assist in several important functions during the initiation phase of protein translation, including 5′ cap recognition (during cap-dependent translation), 5′untranslated region (UTR) scanning, ATG (adenine, guanine, thymine) recognition, and the onset of elongation. Among the eIFs, eIF3 is the largest, composed of at least eight different subunits (19, 38, 49) and having a total mass of 550-700 kDa. eIF3 has several proposed functions during translation initiation, including dissociation of the 80S ribosomal subunit into 40 and 60S subunits (3, 16), acting as an anti-association factor in combination with eIF6 (4). It also prevents dissociation of the Met-tRNAi-eIF2GTP ternary complex upon start codon recognition. Additionally, eIF3 appears to interact with the 5′ cap-binding complex via several of the eIF4s (26, 31, 36). In general, it seems that a 150 kDa protein, P150 plays a key role in all functions mediated by the eIF3 complex that results in formation of the 43S mRNA complex (3). A significant correlation between p150 expression and malignancy in breast, cervical and esophageal cancer have recently been demonstrated (3).
In this study, p150 expression in colorectal tumors and adjacent healthy mucosa was assessed in correlation to the clinicopathological parameters of tumor differentiation and tumor stage.
Materials and Methods
Tissue samples from 110 hemicolectomies performed at the Department of Surgery, University Hospital Innsbruck, were routinely processed. Representative samples of tumor and normal colonic mucosa of 110 patients were collected. In addition, 13 samples were stored at −70°C and prepared for Western blot analysis as previously described (2). Tumor grades and stages according to the TNM system are shown in Table I (52). Tumor samples from all parts of colon and rectum were collected.
Histological diagnosis was assessed by light microscopy according to the UICC criteria (52). Immunohistochemistry was performed on formalin-fixed paraffin embedded tissues using a polyclonal anti-p150 chicken antibody diluted 1:2000 (2). Goat anti-chicken antibody was used 1:2000 as second antibody (DAKO, Copenhagen, Denmark), and diaminobenzidine (DAB) was used as chromogen in all experiments (Sigma Chemical Co, St. Louis, IL, USA). Immunohistochemical reactions were evaluated independently by three experienced observers (CE, JH and PO). Staining area and intensity were quantified for each individual sample. For each specimen, ten fields at 200-fold magnification were evaluated. Scoring was performed in continuous 10%-steps from 0% to 100%. Staining area was measured visually from 0% (no single cell stained) up to 100% (every cell stained). To quantify the staining intensity, sections were scored from 0% (no visible staining, and therefore 0) up to 100% (and therefore 3) (dark brown to black staining). No staining was considered as 0, staining of % as 1, as 2 and as 3. An intensity of 50% was considered optimal intensity for subsequent analysis.
Electron microscopy. Colon cancer samples and healthy control colon tissue was fixed overnight at 4°C in 4% paraformaldehyde (PFA) and 0.5% glutaraldehyde in 0.1 M phosphate buffer (pH 7.2). After rinsing in buffer for 2-24 hours, specimens were postfixed in 1% osmium tetroxide and 1.25% potassium ferrocyanide in 0.1 M cacodylate buffer (pH 7.2) for 1-2 hours, rinsed in buffer for 1 hour, dehydrated in a standard ethanol series and embedded in Spurr's low viscosity resin (48). HRT-18 cells were kindly provided by Albert Amberger. They were cultured in flasks with RPMI-1640 in a humidified incubator with 5% CO2 for 5 days and fixed in 2.5% glutaraldehyde in 0.1 M cacodylate buffer pH 7.2 overnight. After rinsing in buffer, cells were postfixed in 1% osmium tetroxyde for 30 minutes, followed by 1% tannic acid in 0.1% cacodylate buffer (pH=7.2) for 5 minutes, rinsed in buffer for 5 minutes, dehydrated in a standard ethanol series and embedded in polybed 812 (Electron Microscopy Sciences, Hatfield, USA). Ultrathin sections were cut with a diamond knife on a Leica UCT ultramicrotome (Vienna, Austria) and stained with uranyl acetate and lead citrate. Sections were then imaged using a Zeiss EM 902 microscope.
Statistical data with p150 score (%).
Immuno electron microscopy. Fixed colon cancer and healthy control colon tissue was embedded in Spurr's low viscosity resin and polymerized at 60°C, or embedded in Lowicryl K4M and polymerized under UV radiation. Ultrathin sections were mounted on pioloform coated gold grids. Immunolabelling was performed according to a previously published protocol (33), using a final dilution of 1:800 to 1:12800 of a chicken polyclonal antibody against p150 protein. A rabbit anti chicken (British Biocell, Cardiff, UK) 10 nm gold-conjugated antibody diluted 1:40 was used as a secondary antibody. Sections were stained with uranyl acetate and lead citrate and imaged using a Zeiss EM 902 microscope. Staining in the absence of the primary antibody was performed as a negative control.
Immunocytochemistry. Cell cultures of HRT-18 colon cancer cells were fixed in 4% PFA in 0.1 M phosphate buffer, or Stefanini's fluid (2% formaldehyde and 15% picric acid in 0.1 M phosphate buffer) overnight at 4°C. After extensive rinsing with buffer, cells were permeabilized in 1% bovine serum albumin (BSA) containing 0.1% triton X-100 (BSA-T). For p150 protein detection, a polyclonal antibody raised in chicken was used at a dilution of 1:200 or 1:400 in BSA-T. Mouse antibodies against alpha- and gamma-tubulin (Sigma Chemicals) were used at a dilution of 1:100 in BSA-T. Incubation time for primary antibodies was overnight at 4°C. After extensive rinsing with buffer, cells were stained with an FITC-conjugated anti-chicken secondary antibody (Sigma Biosciences, St. Louis, IL, USA) diluted 1:100, and a TRITC-conjugated anti-mouse antibody (DAKO) diluted 1:100 for 1 hour at room temperature was used for single- and double-labelling. Actin staining was performed with TRITC-conjugated phalloidin (Molecular Probes, Invitrogen, Karlsruhe, Germany) at a dilution of 1:40 for 45 minutes at room temperature. Omission of the primary antibody comprised the negative control. Slides were then imaged using a Zeiss 510 laser scan microscope.

A and B: Immunoreactivity for P150 in normal colonic mucosa adjacent to the tumor with mature absorptive columnar cells and undifferentiated stem cells showing a weak, inhomogenous, positive staining. Most of the goblet cells show no expression. The mononuclear cells of the lamina propria, separating the colonic crypts, reveal a positive expression (original magnification ×100). C and D: High power view presenting P150 expression in the basal cell parts (original magnification ×200).
Results
Immunohistochemistry. Heterogenous P150 expression was observed in normal colonic mucosa, restricted mainly to the basal parts of the crypts and in hyperplastic apical cells (Figure 1 A-D). All analyzed carcinomas exhibited positive immuno-reactivity in tumor cells (Figure 2 A-D). p150 protein expression appeared to be diffusely distributed in the cytoplasm of the tumor cells. The relationship between p150 expression and histopathological criteria, such as grade, stage lymph node status is shown in Table I. Statistically significant correlations were found in tumors with dedifferentiation (GI-GIII, p<0.0001), tumor stage (pT1 to pT4, p<0.0001), and lymph node metastasis (N0-N1, p<0.0001). For cases with liver metastases, no significant difference could be observed (p<0.025) (Figure 3).
Immunoblot analysis. The immunohistochemical data correlated well with p150 expression as analyzed by Western blotting (Figure 4). All tumors investigated expressed higher levels of p150 protein than adjacent normal colonic mucosa. The band with an apparent molecular weight of 120 kDa might represent a degradation product. Moreover, lymph node metastases also expressed high levels of p150 expression (data not shown).
LSM and electron microscopy. In order to determine the cellular localization of p150 in normal and malignant colon tissue, ultrastructural analysis was performed. Immunogold reaction in electron microscopy revealed an enrichment of gold closely localized to the rough endoplasmic reticulum (ER) and polyribosomes in normal mucosa (Figure 5 A-B). Colon cancer specimens showed a diffusely arranged ER with increased number of ribosomes (Figure 5 C-E). The strong cytoplasmic immunohistochemical expression led us to investigate the co-expression with structural proteins such as actin and tubulin. Therefore, laser scanning microscopy of HRT-18 cells was performed, which revealed a diffuse perinuclear, cytoplasmic expression with lower intensity in the periphery (Figure 6 A). A slight overlap of actin (Figure 6 B), and of α-tubulin and γ-tubulin with structural proteins in HRT-18 cells was observed (Figure 6 C-D),

A-D: Immunoreactivity for P150 in colon cancer. Higher magnifications of neoplastic cells show a strong cytoplasmic reaction with a slight heterogenous pattern. Note a positive nuclear signal in few luminal cells.
Expression profile, Kaplan-Meier curves and prognostic value. P150 expression in normal colon mucosa was found in the basal parts of the crypts. This is an undifferentiated part of the colon, mainly consisting of stem cells with high regeneration potential. In single benign cells, p150 was detected in the basal part of the cytoplasm (Figure 1 A-D) near the basal membrane around the nucleus. In neoplastic cells, p150 was found throughout the entire cytoplasm (Figure 2 A-D). P150 was overexpressed in all malignant tumors in correlation to dedifferentiation, continuously increasing from normal mucosa over hyperplastic, to neoplastic transformation (GI to GIII, p<0.0001). Moreover, high p150 protein levels were detected in advanced tumors (pT1-pT4, p<0.0001), especially in tumors with regional lymph node and liver metastasis, indicating aggressiveness and metastatic cancer potential. These findings were supported by the highest p150 protein expression at the cancer invasion frontline.
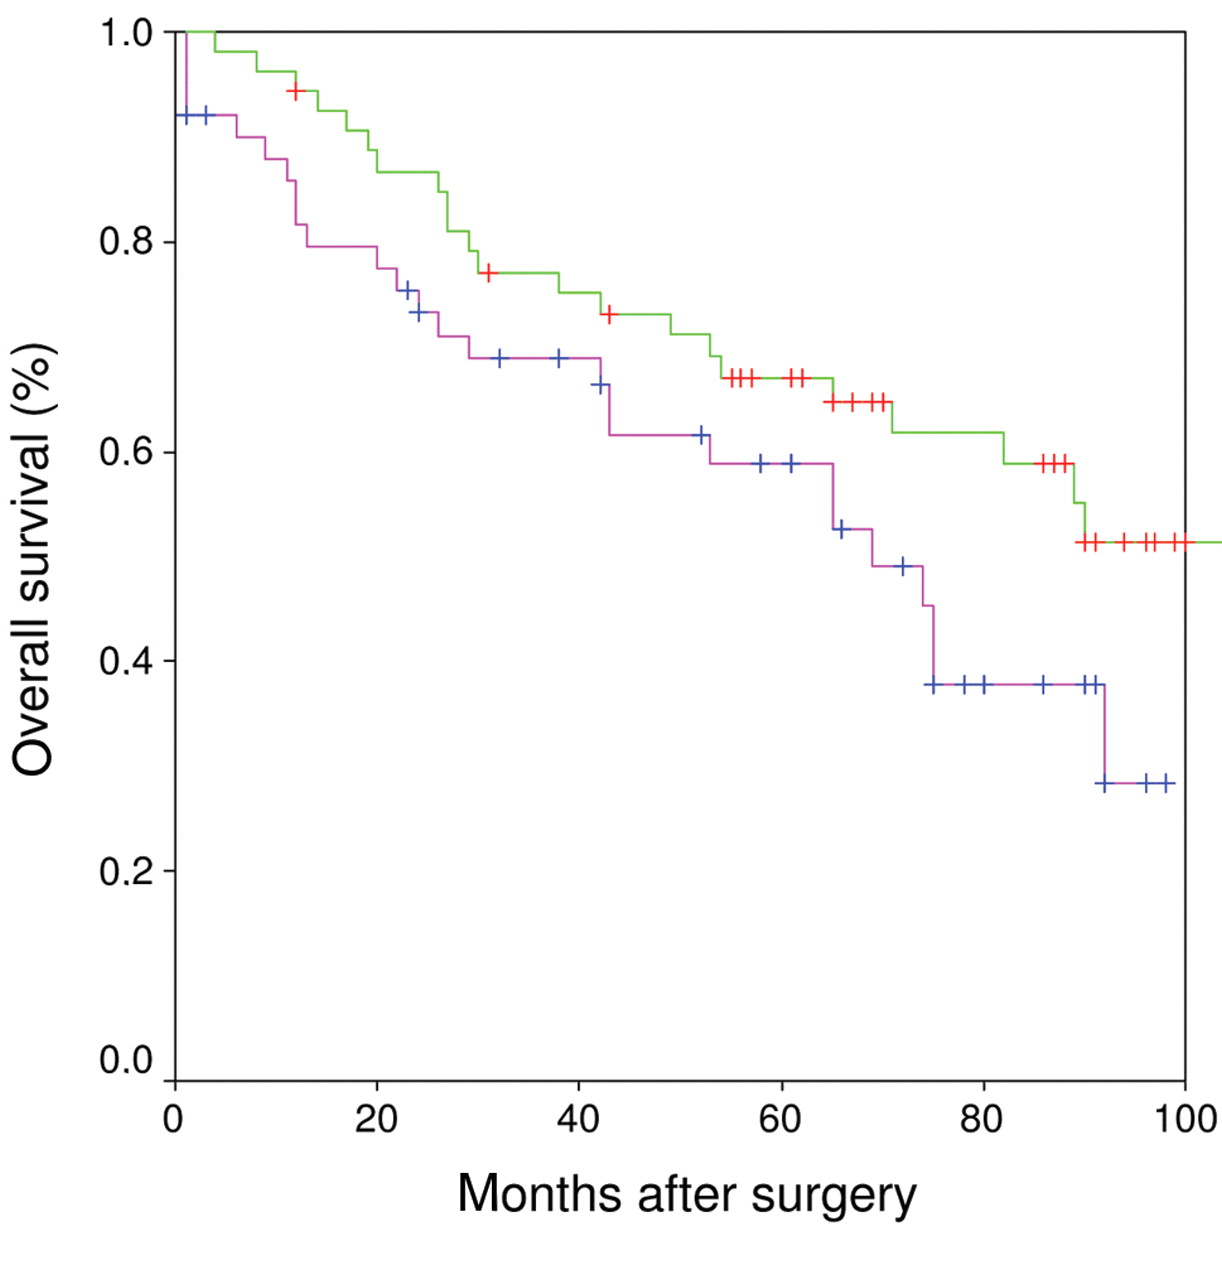
Kaplan-Meier curve: P150 was overexpressed in all malignant tumors and p150 overexpresion was accompanied by poor prognosis as indicated by the lower survival curve reflecting a shorter life expectancy.
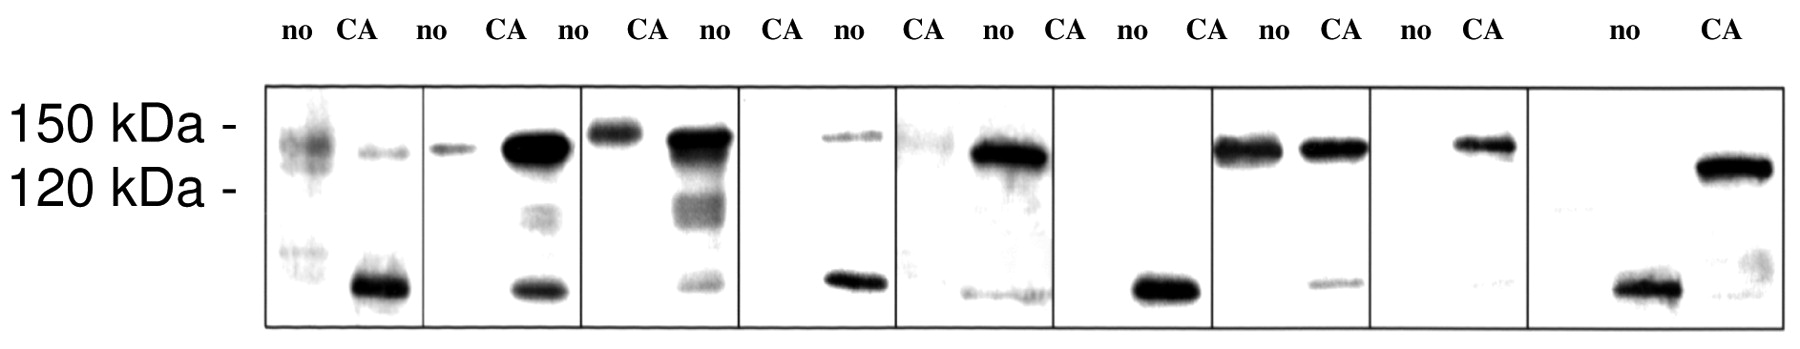
Western blot analysis of matched colon cancer samples (CA) and unaffected mucosal tissue samples (no) for p150 expression; 120 and 150 kDa blots are indicated.

Immunogold labelling of p150: Benign colon mucosa cell. The antigen is related to ribosomes (arrow). Note absence of immunolabelling in the mucous granules (asterisk) (bar: 200 μm). A: Colon cancer cell (GII). The antigen (p150) is located on the ribosomes and the RER. Note the increased staining in comparison to normal mucosa cells. B: Filaments (f) (bar: 200 μm). HRT-18 colon cancer cells. The antigen is closely localized to ribosomes. Note the positive reaction in the heterochromatin and lack of reaction on the filaments (f) (bar: 175 μm). C: Immunogold electron micrograph presenting an overview on filaments and mitochondria. Note the labelling of ribrosomes and the lack of reaction on filaments (f) and mitochondria (bar: 200 μm). D: Higher magnification of HRT-18 colon cancer cell with a reaction closely located to ribosomes (bar: 0.90 μm).
Similar results were found for the expression pattern in the HRT-18 cell line. These results are consistent with observations in breast cancer (own unpublished data), indicating a central role of the p150 subunit in the eIF3 complex during the process of neoplastic transformation of cells and development of malignant tumors.
Discussion
In eukaryotic cells, the most tightly regulated stage of protein synthesis is initiation. eIF3 is a multi-subunit complex that plays an essential role in the first steps of the translation initiation pathway (19, 20). The large subunit of eIF3 (21), which includes p150, is regarded as a key player in translation initiation. It mediates many activities, including binding to the 40S subunit, preventing the association with the 60S subunit, promotion of the 48S pre-initiation complex by interacting with the ternary complex eIF2-GTP-Met-tRNAi and by recruiting the mRNA-eIF4 complex.

Laser scanning microscopy (LSM) with overexpression of p150 in HRT-18 colon cancer cells (FITC). HRT-18 colon cancer cells with perinuclear antigen reaction with thread-like cytoplasm projections A; P150 (FITC) and actin (TRITC) double staining of HRT-18 displaying co-expression in colon cancer cells; B: P150 (FITC) and α-tubulin (TRITC) of HRT-18 cells; C: P150 (FITC) and γ-tubulin (TRITC) of HRT-18 cells; D: Scale bar as indicated.
It is likely that failure of the translational machinery in certain cases might lead to accumulation of mutations in proteins important for the accuracy of DNA replication. As a consequence, these accumulated mutations could render the cells more independent of growth control mechanisms and therefore sustain neoplastic transformation.
We hypothesize p150 protein overexpression functioning similar to an oncogene by increasing normally translationally repressed proteins. GCD10, a further RNA-binding subunit of eIF3, has been shown to be a translational repressor of GCN4 (general amino acid control), which is involved in regulating over 40 genes in Saccharomyces cerevisiae as transcriptional activator. The translation of GCN4 is stimulated by a protein kinase (GCN2) by phosphorylation of the α-subunit of eIF2 (8, 9). In this way, the level of the GTP-bound form of eIF2 is reduced and cannot deliver Met-tRNAi to the pre-initiation complex, leading to an inhibition of translation initiation. GCD10 mutations on the one hand reduce the ability of eIF3 to bind to the ternary complex and, on the other hand, mimic the effects of eIF2α-phosphorylation in derepressing the translation of GCN4 mRNA. In this way, the initiation of total protein synthesis is highly reduced, leading to an accumulation of eIF3 subunits such as p150. Overexpression of part of the large subunit was found in breast (2), cervical (7) and esophageal (5) cancer. In general, these findings were supported by our data of p150 protein expression in colon cancer.
In normal intestinal goblet cells, the nucleus and rough ER are located in the basal parts, with the supranuclear region containing Golgi complex and condensing vacuoles and apical granules located above. Neoplastic transformation involves morphological and complete structural changes, including abnormal microtubule assembly and an increase in polyribosomes. The microtubular disorganization in invasive tumor cells is associated with the loss of tissue architecture, cell polarity and asymmetry of cell shape.
In contrast to p150 expression in cervical cancer, which revealed a statistically significant increase of p150 expression in low-grade cervical intraepithelial neoplasia (CIN) with a decrease in high-grade CIN, squamous carcinomas showed heterogenous expression (7). The differences between CIN and invasive squamous cell carcinoma are due to the degree of differentiation, which therefore corresponds to the expression of p150 in the membrane of ribosomes. The same results were shown in esophageal cancer (5), where p150 expression was also heterogeneous in cancer tissues and no correlation with dedifferentiation was found. Both of these studies investigated squamous epithelium, tissue with little rough ER and few ribosomes, and its neoplastic transformation. In contrast, breast and colon tissues contain epithelium consisting of secretory glands and widely dispersed rough ER with conjugated ribosomes. Therefore, this observation might explain the differences found in the two types of epithelial tissues. Moreover, neoplastic transformation in breast and colon tissues correlates with an increase in ribosomes, which also results in an increase of p150 expression (Figure 5 A-E).
eIF3 subunits have numerous interactions with other initiation factors. In at least four of the eIF3 subunits, namely TIF34 (50), p33 (TIF35) (18), PRT1 (34) and GCD10 (15), RNA-binding domains were detected, further suggesting a very complex system of interactions especially between eIF3 subunits and part of the eIF4F and eIF4B complex (26, 35). Due to its tight functional association with the eIF4 subunits, it seems possible that an overexpression of p150 in the neoplastic pathway functions in an oncogene-like manner by up-regulating normally translationally repressed proteins.
For eIF4E, mitogenic or oncogenic potential is observed when it is expressed constitutively in mammalian cells (27, 28). Similar to overexpression of eIF4E in breast (29) and colon cancer (44), we hypothesize that p150 overexpression leads to a selective increase of cell cycle-influencing proteins, such as cyclin D1, in the same manner (44, 45). eIF4E increases expression of several growth-promoting proteins, including fibroblast growth factor (FGF), proteins responsible for tumor angiogenesis (vascular permeability factor,) and metastasis (V6 splice variant of cd44 surface glycoprotein) (23, 24, 47). Moreover, eIF4E was linked to an up-regulation of proto-oncogenes such as c-Myc (46). Very recently, the up-regulation of this pathway was reported as an early event during colon carcinogenesis via adenomatous polyposis coli gene (APC) inactivation with subsequent eIF4E increase (44). Similar to the p150 experiments on several de- and re-differentiated cell lines, it was possible to show reversal of a T24-ras oncogene-mediated transformation (17) of cloned rat embryo fibroblasts and HeLa cells by regulation of the expression levels of eIF4E.
These proteins are closely functionally connected to each other as regulators of proliferation. Lack of one of factors such as TIF34 (50) or PRT1 (34) results in a halt in proliferation of the affected cells. These factors are essential for the passage of cells through G1 and G2/M phases, but are not required in the S phase once DNA replication is initiated.
The 5.1 kb cDNA encoding p150 showed homology to the recently cloned centrosomins and similarities with egl-45, a Caenorhabditis elegans gene, and open reading frames from yeast and tobacco. P150 is homologous to centrosomin A and B (22, 41), which appear to be involved in the organization of the spindle apparatus consisting mainly of microtubules. They represent at least a part of the cytocentre, organizing the three dimensional structure of the cells, and function as the control unit for intracellular reactions to outside stimuli (32). In this respect, p150 could be involved in interactions with tubulin or associated molecules (2). In LSM and electron microscopy, a clear co-localization of p150 expression with actin (Figure 6B) and tubulins (α- and γ-tubulin) in colon tissues was found (Figure 6C-D).
The eIF3 multiprotein complex is highly conserved throughout eukaryotes (25). These findings indicate a central role for p150 in protein synthesis, cell cycle and proliferation, which are essential for cell survival during evolution.
It was proposed that decreased eIF3A expression may be a pre-requisite for intestinal epithelial cell differentiation (30). Previously, it was shown that eIF3A may function as a proto-oncogene and the suppression of eIF3A expression was able to reverse the malignant phenotype of lung and breast cancer cells (10). Currently, the mechanism of eIF3A involvement in development and differentiation is not clear. However, the finding that eIF3A may function as a regulator of the translation of a subset of mRNAs (11, 12), suggests that the expression of proteins important for development and differentiation may be under eIF3A control. Mammalian eIF3A has also been reported to play roles in phagocytosis of late apoptotic cells (37). Although initiation factors are known to play important roles in oncogenesis (13, 14). The importance of translational regulation in oncogenesis at a molecular level remains ill-defined. eIF3A overexpression has been reported in numerous cancer cell lines and tissues. Bachmann et al. first identified elevated eIF3A levels in breast cancer tissues compared to paired normal mammary tissues (2). Increased eIF3a expression has also been found in lung cancer (42). Recently, additional functions of p170, the large subunit of the translation initiation factor 3, have been described (6). Apart from their role in translation, eukaryotic transcription factors and/or their individual subunits may also regulate nuclear processes, as well. Primary structure analysis revealed four nuclear localization signals in the human eIF3 large subunit, p170.
In a recent study, an association of phosphorylated mammalian target of rapamycin (p-mTOR) with peIF4E associated with increased overall survival in ovarian cancer patients was demonstrated (39). Moreover, it has been suggested that increased expression of eIF5A2 in ovarian carcinoma may represent an acquired malignant phenotypic feature of tumor cells, and that the overexpression of eIF-5A2, as detected by immunohistochemistry, is an independent molecular marker for shortened survival time of patients with ovarian carcinoma (53).
The mechanism of malignant transformation induced by production of eIF3A is currently still unknown and will be the aim of further investigations. It will be interesting to answer this question by using additional cell culture system as well as appropriate animal models. Therefore we believe that this study could be the basis for a better understanding of eIFs and their impact on carcinogenesis, not only in the gastrointestinal tract.
Acknowledgements
We thank Mrs. Ines Tschörner and Inge Jehart for their excellent technical assistance.
Footnotes
- Received December 1, 2009.
- Revision received March 14, 2010.
- Accepted March 16, 2010.
- Copyright© 2010 International Institute of Anticancer Research (Dr. John G. Delinassios), All rights reserved