


Abstract
Background/Aim: Central nervous system cancer is still a major public health issue. The effectiveness of treatments is limited and varies depending on the severity of disease. Therefore, there is a demand for the development of novel therapies. Static magnetic stimulation (SMS) emerges as a new therapeutic option. The aim of this study was to evaluate the SMS effects on neuroblastoma cells in culture. Materials and Methods: SH-SY5Y neuroblastoma cells were exposed to 0.3T SMS for 6, 12, 24, 36, 72 h, and 6 days. Cell viability (MTT), cell death (annexin-V/PI staining) and cell cycle (DNA content), cell proliferation (CFSE), autophagy (acridine orange), and total mitochondrial mass (MitoTracker™ Red) were analyzed to establish the cellular response to SMS. Results: The viability of SH-SY5Y cells was reduced after exposure to SMS for 24 h and 6 days (p<0.05), without differences for the other times (p>0.05); however, this effect was not related to cell death or cell cycle arrest (p>0.05). In contrast, the viability of human malignant melanoma (HMV-II) cells, used as a tumoral control, was not affected. In addition, stimulated SH-SY5Y cells presented a decrease in mitochondrial mass at both exposure times and a reduction in autophagy and cell proliferation after 6 days (p<0.05). Conclusion: SMS application appears to be a promising adjuvant therapy for the treatment of neuroblastoma since it decreases the survival of SH-SY5Y neuroblastoma cells.
Cancer of the central nervous system is the thirteenth most common cancer in males and the sixteenth most common in women worldwide (1). The highest incidence rates of central nervous system (CNS) cancer are seen in North Central European countries in men and in Southern Europe and North America in women (2). Among CNS tumors, neuroblastoma (NB) is the most common pediatric extracranial malignant solid tumor, which derives from neural crest cells. Although its incidence is only 7% to 8%, it contributes to 15% of all pediatric cancer mortality. Survival of children older than one year with advanced NB is poor (only 34%), despite aggressive treatments (3, 4). Despite multi-modality therapies, drug resistance is a barrier in the treatment of high-risk patients with NB (5), emphasizing the need to search for new therapies.
Regarding the treatments available, the success of therapies varies according to the severity of the disease. The treatments used are multiagent chemotherapy with doxorubicin, cyclophosphamide, a platinum drug, and etoposide. The number of chemotherapy cycles is based on clinical and biological tumor risk factors and response to therapy (6). In more severe cases, this includes chemotherapy, surgery, radiotherapy, myeloablative therapy, and often stem cell transplantation (7). High-risk patients still have a very poor prognosis and existing treatments are associated with several adverse effects, despite advances in molecular biology and general knowledge about the disease and treatment options (8). Only a small portion of patients have complete remission, thus new therapeutic approaches need to be explored.
A recent literature review showed that the use of magnetic fields has antitumor effects by inhibiting cell proliferation and inducing cell cycle arrest, apoptosis, and autophagy (9). Some experiments also revealed that, alongside drugs, static magnetic stimulation (SMS) alters the cell membrane characteristics and increases the number of cytoplasmic vacuoles. Cell cycle analysis showed that the proportion of cells in the G2/M phase increases, while the cell number in the S phase decreases significantly (10).
A previous study by our research group demonstrated that SMS, when applied to neuroblastoma cells in culture, can reduce the proliferation of this cell type, and this effect was observed neither in fibroblasts nor in HMV-II cells, indicating that SMS acts in a cell- and state-specific manner (11). This time, the effects of SMS in a cell model of neuroblastoma are evaluated for the search, development, and application of different stimulatory methodologies with therapeutic potential for cancer treatment. Furthermore, the need to elucidate the pathways involved in these modulatory processes in vitro using SMS substantiates conducting preclinical studies evaluating the effects of this approach. Therefore, the aim of this study was to evaluate the effect of SMS on death, cell cycle, proliferation, autophagy, and mitochondrial mass in neuroblastoma cells in culture.
Materials and Methods
Cell culture. The human neuroblastoma cell line SH-SY5Y, obtained from ATCC (American Type Culture Collection) (RRID:CVCL_0019), was maintained in 1:1 Ham’s F12 and Dulbecco’s Modified Eagle Medium (DMEM Low) (GIBCOTM, Waltham, MA, USA) supplemented with 10% heat-inactivated fetal bovine serum (FBS) (GIBCOTM), and 1% penicillin/streptomycin (GIBCOTM), 5% CO2 at 37°C. The HMV-II (RRID:CVCL_1282) cell line, a tumoral cell control, was maintained in Roswell Park Memorial Institute Medium (GIBCOTM) supplemented with 10% heat-inactivated FBS and 1% penicillin/streptomycin (GIBCOTM), 5% CO2 at 37°C. The cells were seeded in 24-well plates, at the density of 1×10⁶ cells per well and all magnetic stimulations were performed when cells were 75% confluent.
Static magnetic stimulation. A custom-made stand for attaching 24-well standard plates was used for SMS stimulation. Six cylindrical NdFeB (neodymium-iron-boron) magnets with dimensions of 12 mm in diameter and 6 mm in height make up each stand, which are spaced apart to prevent magnetic field interactions (11). Magnets are distributed so that they are precisely coupled to 6 wells of a 24-well plate. Each 24-well plate, therefore, was seeded in only 6 wells. To ensure the strength of the magnetic field, the distance between the culture plate and the stand was adjusted. The magnetic field travels across layers or many layers of cells in the same way; hence, the density or grouping of cells had no effect on the magnetic field’s strength. The magnetic field was adjusted using a specifically adapted screw, which was measured using a Hall Effect Gaussmeter (Wuntronic GmbH, Munich, BY, DE), that was available at the Hospital de Clínicas de Porto Alegre Biomedical Engineering Laboratory. The stimulation was performed at various intervals after plating and at a 0.3 Tesla (T) intensity. The control cells were not stimulated in any way.
MTT assay. MTT was performed to evaluate the cell viability after 6, 12, 24, 36, and 72 h, and 6 days of SMS exposure of SH-SY5Y cells and in HMV-II cells used as a tumoral cell control. The MTT assay was performed using 3-(4,5-dimethylthiazol-2-yl)-2,5-diphenyltetrazolium bromide (MTT) (Sigma Aldrich, Barueri, SP, Brazil); it is a colorimetric assay that reflects cell viability. At respective times after SMS exposure, cells were incubated with MTT in saline (132 mM NaCl, 4 mM KCI, 1 mM CaCl2, 6 mM glucose, 10 mM HEPES, pH 7.4). Without removing the medium from the cells, 0.75 mg/ml MTT was added, incubated for 1 h at 37°C and dimethyl sulfoxide (DMSO) was added for cell disruption. The absorbance was determined at a wavelength of 570 nm, using a wavelength of 620 nm as a reference, in a spectrophotometer Spectra Max (Gemini™, Sunnyvale, CA, USA). Cell viability was expressed as a percentage relative to the absorbance determined in the control cells.
Cell death (Annexin-V/PI staining). Annexin V-FITC and propidium iodide (PI) staining (Santa Cruz Biotechnology, Santa Cruz, CA, USA) was performed to evaluate SH-SY5Y cell death after 24 h and 6 days of SMS exposure, according to the manufacturer’s protocol. In the early stages of apoptosis, the cell membrane remains intact (healthy) and it is impermeable to the DNA marker (PI). At this stage, the phosphatidylserine externalization allows the binding of Annexin V-FITC. However, during necrosis cells take up PI because the cell membrane is disrupted. The samples were incubated in PI solution (2 μg/ml), an additional fluorescent marker, in Annexin-V Binding Buffer 1X for 5 min at 4°C protected from light. The samples were immediately analyzed by flow cytometry using the Attune® Acoustic Focusing Cytometer (Thermo Fisher Scientific, Waltham, MA, USA). As an experimental death control, apoptosis was induced using 20% DMSO for 15 min and necrotic cells were obtained by heating the cells at 70°C for 15 min.
Cell cycle. Treated cells were resuspended in 100 μl of PBS and 900 μl of ice-cold 70% ethanol was added and incubated for 1 h at 4°C. Samples were centrifuged at 2516 g for 10 min and the pellet was washed three times in PBS 1X and resuspended in a standard staining solution (0.1% Triton X-100, 100 μg/ml PI, and 50 μg/ml DNAse-free RNAse) for 15 min at 37°C, protected from light. Samples were resuspended in PBS for immediate flow cytometry analysis using the Attune® Acoustic Focusing Cytometer (Thermo Fisher Scientific). The cell cycle was evaluated in SH-SY5Y cells after 24 h and 6 days of SMS exposure duration.
Cell proliferation. The cells were rinsed three times in PBS and incubated with 5 μM Crystal Field Stabilization Energy (CFSE) (Thermo Fisher Scientific) for 20 min at 37°C protected from light. The samples were washed once in PBS and a complete culture medium was added. Following 24 h and 6-day treatments, the cells were trypsinized and taken to the cytometer. Cells treated with 10 μM Colchicine were used as an experimental control. Samples were resuspended in PBS for immediate flow cytometry analysis using the BD FACSMelody™ Cell Sorter (BD Biosciences, La Jolla, CA, USA). Cell proliferation was evaluated in SH-SY5Y cells after 24 h and 6 days of SMS exposure.
Autophagy. Acridine orange (AO) is a marker of acidic vesicular organelles that fluoresces green in the whole cell (cytoplasm and nucleus), but in acidic compartments (mainly late autophagosomes), is protonated, accumulates, and emits red fluorescence. Thus, AO has been used as an indirect marker of the formation of autolysosomes (late autophagy) for the initial screening of autophagy levels (12). To perform the AO experiments, cells were treated with SMS and incubated with AO (1 μg/ml) for 15 min at 37°C protected from light. The cells were washed and resuspended in PBS for flow cytometry analysis using BD FACSMelody™ Cell Sorter (BD Biosciences, La Jolla, CA, USA). Data are presented as the percentage of AO-positive cells. The size and complexity of the SH-SY5Y cells were evaluated after 24 h and 6 days of SMS exposure duration.
Mitochondria. MitoTracker™ Red is widely used to stain the mitochondria of live cells depending on the oxidative activity (mitochondrial membrane potential). The probe is retained inside the mitochondria, regardless of its functionality. Thus, we used flow cytometry to assess the mitochondrial mass in SH-SY5Y cells after 24 h and 6 days of SMS exposure. SH-SY5Y cells were washed with PBS and harvested using trypsin. Then, cells were resuspended and incubated for 20 min in the dark with 200 nM of MitoTracker™ Red that was diluted in PBS. The cellular fluorescence was measured using BD FACSMelody™ Cell Sorter (BD Biosciences).
Ethics approval. The present study has been registered on Plataforma Brasil under #CAAE: 86002318.2.0000.5327. All procedures were reviewed and approved by the institutional Research Ethics Committee of the Hospital de Clínicas de Porto Alegre (GPPG/HCPA 2018.0026).
Statistical analysis. The first analyses were normality and lognormality to choose between a parametric and a non-parametric test. For parametric samples, data are presented as mean±SD and analyzed using Student’s t-test. For non-parametric samples, data are presented as median (interquartile 25; interquartile 75) and analyzed using Kruskal–Wallis followed by Mann–Whitney test. Values of p<0.05 were considered to indicate significant differences. All analyses were performed using the statistical software GraphPad Prism 8 (GraphPad Software, La Jolla, CA, USA).
Results
Cell viability and proliferation after 6, 12, 24, 36, and 72 h, and 6 days of SMS exposure of SH-SY5Y cells and HMV-II cells as a tumoral cell control. There was no difference between groups in SH-SY5Y after 6, 12, 36, and 72 h of SMS exposure (Student’s t-test, p>0.05; Figure 1A); in contrast, there was a significant decrease in viability after 24 h and 6 days of SMS exposure compared to the non-stimulated control group (Student’s t-test, p<0.05, Figure 1B). HMV-II cells showed no difference in viability after SMS exposure compared to the non-stimulated group (Student’s t-test, p>0.05; Figure 1C).

Viability and proliferation after static magnetic stimulation (SMS) exposure of SH-SY5Y cells and HMV-II cells as a tumoral cell control. Data are presented as the number of viable cells and expressed as a percentage of the control group (mean±SD). (A) Viability of SH-SY5Y cells exposed to SMS treatment for 6, 12, 24, 36, and 72 h, and 6 days. (B) Viability of SH-SY5Y cells exposed to SMS treatment for 24 h and 6 days. (C) Viability of HMV-II cells (tumoral control cell line) exposed to SMS treatment for 24 h and 6 days. Panels B and C: C24h=24 h control (non-stimulated cells); S24h=24 h of SMS (stimulated cells). C6d=6 days control (non-stimulated cells); S6d=6 days of SMS (stimulated cells). *Significant difference when compared to the respective non-stimulated control group (Student’s t-test, p<0.05). Error bars represent SD.
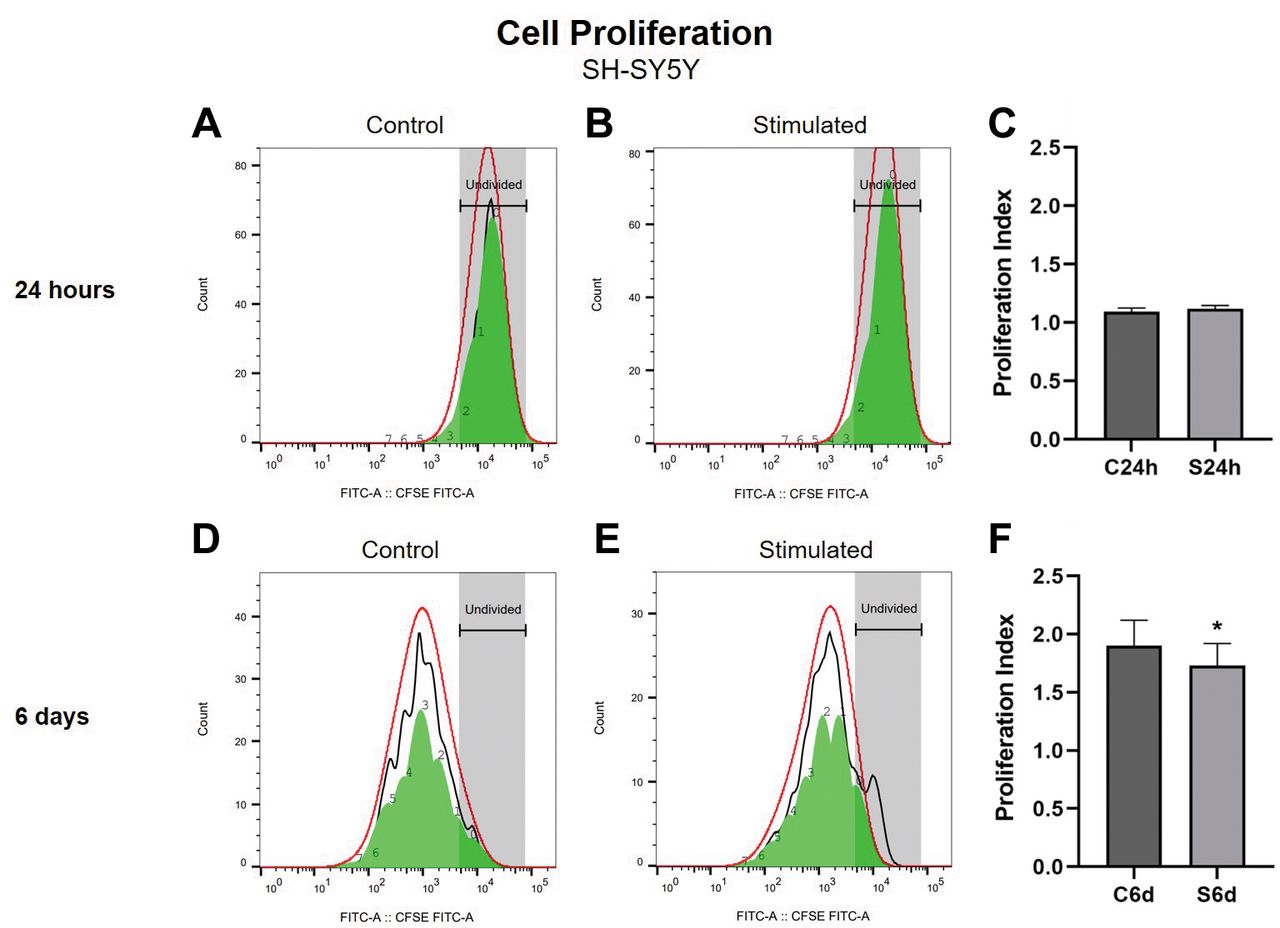
Cell proliferation 24 h and 6 days after SMS exposure of SH-SY5Y cells. The CFSE analysis of proliferation of SH-SY5Y cells exposed to SMS for 24 h showed no difference between the groups (Student’s t-test, p>0.05; Figure 2C). There was a significant decrease in SH-SY5Y cell proliferation after 6 days of SMS exposure compared to the non-stimulated control group (Student’s t-test, p<0.05; Figure 2F). Figure 2A and B shows representative histograms of fluorescence intensity after 24 h of treatment of control and stimulated cells, respectively; Figure 2D and E shows representative histograms of fluorescence intensity after 6 days of treatment of control and stimulated cells, respectively.

Proliferation of SH-SY5Y cells exposed to static magnetic stimulation (SMS) treatment for 24 h and 6 days. Data in Panels C and F are expressed as mean±SD of proliferation index. (A) Representative histogram of fluorescence intensity at 24 h in non-stimulated control cells. (B) Representative histogram of fluorescence intensity at 24 h in stimulated cells. (C) Cell proliferation analysis of SH-SY5Y cells evaluated using CFSE, after 24 h of SMS exposure. (D) Representative histogram of fluorescence intensity at 6 days in non-stimulated control cells. (E) Representative histogram of fluorescence intensity at 6 days in stimulated cells. (F) Proliferation analysis of SH-SY5Y cells using CFSE, after 6 days of SMS exposure. C24h=24 h control (non-stimulated cells); S24h=24 h of SMS (stimulated cells). C6d=6 days control (non-stimulated cells); S6d=6 days of SMS (stimulated cells). CFSE=Crystal Field Stabilization Energy. *Significant difference when compared to the non-stimulated control group (Student’s t-test, p<0.05). Error bars represent SD.
Cell death and cell cycle distribution of SH-SY5Y exposed for 6 days to SMS treatment. Annexin-V/PI evaluation of cell death showed no significant difference between groups after 6 days of SMS exposure (Figure 3C). Cell cycle analysis of SH-SY5Y cells showed no difference between groups in the percentage of cells in sub-G1, G1, S, G2, and >4N phases after SMS (Figure 3F) (Student’s t-test, p>0.05). Figure 3A and B shows dot plots of non-stimulated cells (6 d Control group) and stimulated cells (6 d stimulated group) for cell death, respectively; Figure 3D and E shows representative histograms of fluorescence intensity after 6 days of treatment of control and stimulated cells, respectively.

Cell death and cell cycle distribution of SH-SY5Y after 6 days of static magnetic stimulation (SMS) treatment. Data of panels A, B, C are presented as a percentage of the mean of cell death, and data of panels D, E, and F are presented as the percentage of the number of cells in each phase of cell cycle. (A) Dot Plot of non-stimulated control cells (6d) for cell death. (B) Dot Plot of stimulated cells (6 days) for cell death. (C) Death of SH-SY5Y cells evaluated using Annexin-V/PI staining, after 6 days of SMS exposure. Live cells (Annex-/PI–); Apoptotic cells (Annex+/PI–); Double-positive cells (Annex+/PI+); Necrotic cells (Annex-/PI+). (D) Representative histogram of fluorescence intensity at 6 days in non-stimulated control cells for cell cycle analysis. (E) Representative histogram of fluorescence intensity at 6 days in stimulated cells for cell cycle analysis. (F) Cell cycle distribution of SH-SY5Y cells evaluated using PI staining, 6 days after SMS exposure. C6d=6 days control (non-stimulated cells); S6d=6 days of SMS (stimulated cells). There was no difference between the SMS and control groups (Student’s t-test, p>0.05). Error bars represent SD.
Autophagy of SH-SY5Y exposed to SMS treatment for 24 h and 6 days. After staining the cells with AO, we analyzed the size and complexity of the SH-SY5Y cells exposed to SMS treatment for 24 h and 6 days (Figure 4 and Figure 5). At both duration times, the cells were not different from the non-stimulated controls. When autophagy was analyzed, the group exposed for 24 h showed no statistically significant difference, and the group that was stimulated for 6 days showed a decrease in autophagy (Student’s t-test, p<0.05) (Figure 5).

Size and complexity of SH-SY5Y cells after static magnetic stimulation (SMS) exposure. Data are expressed as mean±SD of the size and complexity of SH-SY5Y cells. (A) Dot plot of cytometry in the non-stimulated cells (C24h). (B) Dot plot of cytometry after 24 h of SMS exposure (S24h). (C) Dot plot of cytometry in the non-stimulated cells (C6d). (D) Dot plot of cytometry after 6 days of SMS exposure (S6d). (E) Size of SH-SY5Y cells after SMS exposure. (F) Intracellular complexity of SH-SY5Y cells after SMS exposure. C24h=24 h control (non-stimulated cells); S24h=24 h of SMS (stimulated cells). C6d=6 days Control (non-stimulated cells); S6d=6 days of SMS (stimulated cells). There was no difference between groups (Student’s t-test, p>0.05). Error bars represent SD.
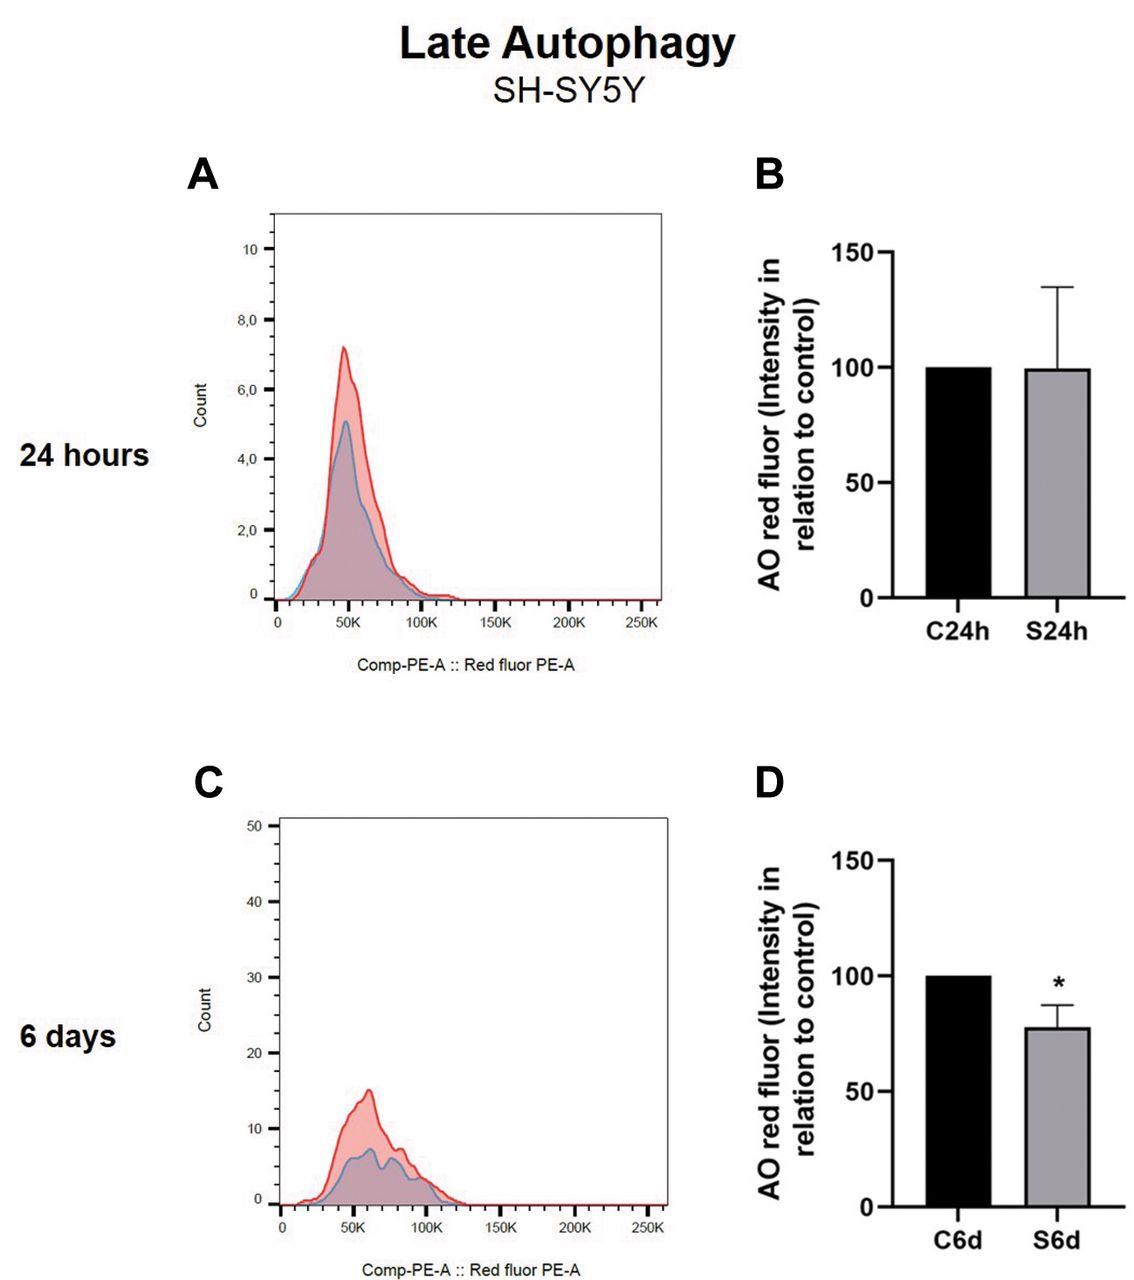
Autophagy of SH-SY5Y exposed to static magnetic stimulation (SMS) treatment for 24 h and 6 days. Data are expressed as the mean±SD of Red-to-green fluorescence intensity in relation to the percentage of the control group. (A) Representative histogram of fluorescence intensity at 24 h in control and stimulated cells. (B) Acridine Orange analysis of SH-SY5Y cells 24 h after SMS exposure. (C) Representative histogram of fluorescence intensity at 6 days in control non-stimulated and stimulated cells. (D) Acridine Orange analysis of SH-SY5Y cells at 6 days after SMS exposure. C24h=24 h control (non-stimulated cells); S24h=24 h of SMS (stimulated cells). C6d=6 days control (non-stimulated cells); S6d=6 days of SMS (stimulated cells). *Significant difference when compared to the control group (Student’s t-test, p<0.05). Error bars represent SD.
Analysis of mitochondrial mass. Cells were stained with Mitotracker and the red fluorescence intensity of the cell population was assessed to determine the total mitochondrial mass using flow cytometry. Data are expressed as the mean±SD of red fluorescence intensity of the cell population in relation to the control group. A decrease in mitochondrial mass was found after 24 h and 6 days of SMS treatment (Student’s t-test, p<0.05); however, a more pronounced difference was observed after 6 days of exposure to SMS treatment (Student’s t-test, p=0.01) (Figure 6A, B, C, and D).

Mitochondrial mass. Data are expressed as the mean±SD of relative mean of captured fluorescence intensity. (A) Representative histogram of control and static magnetic stimulation (SMS) groups for 24 h (LOG scale). (B) Mitochondrial analysis of SH-SY5Y cells evaluated using MitoTracker Red A, 24 h after SMS exposure. (C) Representative histogram of control and SMS groups for 6 days (LOG scale). (D) Mitochondrial analysis of SH-SY5Y cells evaluated using MitoTracker Red A, 6 days after SMS exposure. C24h=24 h control (non-stimulated cells); S24h=24 h of SMS (stimulated cells). C6d=6 days control (non-stimulated cells); S6d=6 days of SMS (stimulated cells). *Significant difference when compared to the control group (Student’s t-test, p<0.05). **Significant difference (Student’s t-test, p=0.01). Error bars represent SD.
Discussion
The current study demonstrates that exposure to 0.3 T SMS reduces cell viability (24 h and 6 days), cell proliferation, autophagy (6 days), and mitochondrial mass (24 h and 6 days) in SH-SY5Y neuroblastoma cells. Furthermore, these effects were not related to cell death or cell cycle arrest alterations at both times investigated. This is the first study that evaluated the kinetics of cellular responses in neuroblastoma after treatment for 24 h and 6 days with SMS.
Exposure to SMS may affect neither cell cycle dynamics nor trigger cell death. However, SMS exposure for 24 h and 6 days decreased cell viability, while exposure for 6 days decreased cell proliferation. Corroborating our data, a study on neuroblastoma cell lines, using magnetic stimulation, found that exposure to the combination of 1 mT static magnetic field and 50 Hz radiofrequency (extremely low radio frequency field) affected proliferation, but did not induce apoptosis (13). Another study found similar results in human breast adenocarcinoma cells, with a decrease in tumor cell viability and proliferation after 24 and 48 h of exposure to SMS, using intensities of 5, 10, 15, and 20 mT (14). Furthermore, a study using an intensity of 1 T of SMS for two days, showed a reduction in the number of cancer cells compared to human non-cancer cells (15).
In the present study, the cycle analysis of SH-SY5Y cells shows that the percentage of cells in sub-G1, G1, S, G2, and >4N phases was not different between the SMS-stimulated and the control groups, suggesting that this protocol of SMS treatment does not change the cell cycle distribution. These data corroborate a recent study by our research group, which obtained the same results, besides an increase in necrotic SH-SY5Y cells exposed to SMS for 24 h (11).
The reduction in cell viability was observed through two assays, MTT and flow cytometry, which also showed a decrease in cell proliferation, as discussed above. The reduction of cell viability triggered by SMS, demonstrated here, is corroborated by a previous study that observed a decrease of approximately 30% in cell viability in SH-SY5Y cells, using neodymium permanent magnets (NdFeB) to generate a static magnetic field, along with the use of cisplatin (16). The MTT assay evaluates functional cell damage through mitochondrial activity; it evaluates the activity of mitochondrial enzymes (mitochondrial enzyme reductase) and their redox potential (17). Surprisingly, in the current study, the decrease in cell viability, evaluated by MTT, was not observed in HMV-II cells, suggesting that the SMS effect may be cell line-dependent.
Cells may respond to magnetic stimulation through several mechanisms, including autophagy, which is a homeostatic degradative process responsible for maintaining cell stability (18). The autophagy role in cancer development is still questionable since there are studies that indicate mechanisms of cancer suppression (19) and others show that autophagy defects favor cancer development (20). On the other hand, another study showed that autophagy benefits cancer by increasing cancer cell survival by limiting stress responses (21). Here, we used acridine orange, as an indirect marker for the initial screening of autophagy levels. While no difference was observed between the control and the SMS-stimulated groups after 24 h, 6 days of SMS exposure decreased the autolysosome mass (late autophagy). This result is corroborated by a previous study showing that low frequency-magnetic fields (LF-MFs) can modulate the autophagic process and delay the progression of neurodegenerative disease (22). In addition, it has been demonstrated that LF-MFs induce autophagic cell death in vivo and in vitro, leading also to a reduction in cell proliferation (18). Furthermore, it is important to highlight that genetic and pharmacologic autophagy inhibition overcame molecularly distinct resistance mechanisms, inhibiting tumor cell growth (18, 23). Autophagy is associated with chemoresistance in neuroblastoma and its therapy-induced inhibition sensitizes these cells to death (24). For example, in pancreatic ductal adenocarcinoma, autophagy is elevated and contributes to aberrant proliferation and growth, even in a nutrient-poor context, demonstrating the importance of modulating autophagy (25).
The mitochondrial network is essential for cell viability and homeostasis maintenance (26). Here, we showed that SH-SY5Y cells presented a small decrease in mitochondrial mass after 24 h of SMS exposure, whereas 6 days of stimulation induced a more marked reduction. It is interesting to emphasize that mitochondrial depolarization is essential to autophagy (27) and mitochondrial dysfunction plays an important role in the autophagy cascade, decreasing this process. In this way, it was hypothesized that the reduction in viability and proliferation, observed in SH-SY5Y cells in the current study, may be a result of having fewer mitochondria. However, it is difficult to define what is the cause and the consequence in the crosstalk between mitochondrial mass and levels of late autophagy, as having a lower mitochondrial mass can lead to a lower need for autophagy (i.e., with fewer mitochondria there is a reduction in viability and cell proliferation). Considering that this is an innovative work, there are still no studies that can be used to compare the results found here in relation to mitochondrial mass and late autophagy. These results suggest that when dealing with a neoplastic environment, the decrease in autophagy may promote tumor regression; however, more studies are necessary for a better understanding of the SMS actions, for example, evaluation of senescence and tumor markers.
Lastly, neuroblastoma is a cancer type that is very resistant to pharmacological therapies. Besides, the use of chemotherapy drugs for its treatment is limited due to neurotoxicity. Thus, the cellular mechanisms involved in tumor resistance to these therapies are under investigation. These factors increase the importance of understanding the mechanisms involved in the response to SMS. According to a recent study, the application of static magnets to the central nervous system is a newly developed non-invasive neuromodulation technology that may provide a straightforward, affordable, and reversible form of treatment (28). Corroborating these data, the current study showed that SMS can reduce cell viability (0.3 T/24 h and 6 days), cell proliferation and autophagy (0.3T/6 days), as well as the mitochondrial mass (0.3 T/24 h and 6 days) in SH-SY5Y cells, a neuroblastoma cell line. The translation of these results to the clinical context grants SMS as a safe and promising therapeutic approach as an adjuvant in the treatment of neuroblastoma.
Conclusion
The application of static magnetic stimulation on SH-SY5Y neuroblastoma cells reduced the viability, proliferation, and autophagy, as well as the mitochondrial mass in these cells. SMS application appears to be a promising adjuvant therapy for the treatment of neuroblastoma since it decreases the survival of SH-SY5Y neuroblastoma cells.
Acknowledgements
The Authors would like to thank the Funding Agencies that supported this study: Conselho Nacional de Desenvolvimento Científico e Tecnológico - CNPq (Dr. ILS Torres; Dr. W Caumo); Coordenação de Aperfeiçoamento de Pessoal de Nível Superior - CAPES (88882.346191/2019-01, Dr D. J. Stein); Graduate Research Group and Research Incentive Fund of Hospital de Clínicas de Porto Alegre, FIPE/HCPA (ILS Torres, Grant 2018.0026), Projeto 0261/18 CHAMADA PÚBLICA MCTIC/FINEP/CT-INFRA 04/2018.
Footnotes
Authors’ Contributions
All Authors contributed to the study conception and design. Medeiros, H.R: Conceptualization; Data curation; Formal analysis; Methodology; Data Analysis; Roles/Writing – original draft; Writing – review & editing. Assumpção, J.A.F.: Investigation; Methodology; Data analysis. Stein, D.J: Roles/Writing – original draft; Data analysis; Writing – review & editing. Fillipi-Chiela, E.C.: Investigation; Methodology; Data analysis. Fregni, F.: Validation; Visualization. Caumo, W.: Validation; Visualization. Sanches, P.R.S: Conceptualization; Methodology. Torres I.L.S: Conceptualization; Data curation; Formal analysis; Data analysis; Project administration; Roles/Writing - original draft; Writing - review & editing. All Authors revised and edited the manuscript, approving the final version.
Conflicts of Interest
The Authors have no relevant financial or non-financial interests to disclose.
Funding
This study was supported by the following Brazilian funding agencies: Conselho Nacional de Desenvolvimento Científico e Tecnológico - CNPq (Dr. ILS Torres; Dr. W Caumo); Coordenação de Aperfeiçoamento de Pessoal de Nível Superior - CAPES (88882.346191/2019-01, Dr D. J. Stein); Graduate Research Group of Hospital de Clínicas de Porto Alegre, GPPG-HCPA (ILS Torres, Grant 2018.0026), Projeto 0261/18 CHAMADA PÚBLICA MCTIC/FINEP/CT-INFRA 04/2018.
- Received December 14, 2022.
- Revision received January 30, 2023.
- Accepted February 1, 2023.
- Copyright © 2023 International Institute of Anticancer Research (Dr. George J. Delinasios), All rights reserved.
This article is an open access article distributed under the terms and conditions of the Creative Commons Attribution (CC BY-NC-ND) 4.0 international license (https://creativecommons.org/licenses/by-nc-nd/4.0).
References
In this issue


Jump to section
Related Articles
Cited By...
- No citing articles found.