
Main menu

  • Home
  • Current Issue
  • Archive
  • Info for
    • Authors
    • Subscribers
    • Advertisers
    • Editorial Board
  • Other Publications
    • In Vivo
    • Cancer Genomics & Proteomics
    • Cancer Diagnosis & Prognosis
  • More
    • IIAR
    • Conferences
    • 2008 Nobel Laureates
  • About Us
    • General Policy
    • Contact
  • Other Publications
    • Anticancer Research
    • In Vivo
    • Cancer Genomics & Proteomics

User menu

  • Register
  • Subscribe
  • My alerts
  • Log in
  • My Cart

Search

  • Advanced search
Anticancer Research
  • Other Publications
    • Anticancer Research
    • In Vivo
    • Cancer Genomics & Proteomics
  • Register
  • Subscribe
  • My alerts
  • Log in
  • My Cart
Anticancer Research

Advanced Search

  • Home
  • Current Issue
  • Archive
  • Info for
    • Authors
    • Subscribers
    • Advertisers
    • Editorial Board
  • Other Publications
    • In Vivo
    • Cancer Genomics & Proteomics
    • Cancer Diagnosis & Prognosis
  • More
    • IIAR
    • Conferences
    • 2008 Nobel Laureates
  • About Us
    • General Policy
    • Contact
  • Visit us on Facebook
  • Follow us on Linkedin
Research ArticleExperimental Studies
Open Access

The MDM2 and CDKN2A Copy-number-variation Influence the TP53-signature-score in Wild-type TP53 Luminal Type Breast Cancer

MIN HAN, SHIGEO YAMAGUCHI, MAI ONISHI, TOMOAKI FUJII, MASAKI HOSOYA, XUAN WEN, HIDENORI KIDO and SHUNSUKE KATO
Anticancer Research May 2022, 42 (5) 2277-2288; DOI: https://doi.org/10.21873/anticanres.15707
MIN HAN
Department of Clinical Oncology, Juntendo University Graduate School of Medicine, Tokyo, Japan
  • Find this author on Google Scholar
  • Find this author on PubMed
  • Search for this author on this site
SHIGEO YAMAGUCHI
Department of Clinical Oncology, Juntendo University Graduate School of Medicine, Tokyo, Japan
  • Find this author on Google Scholar
  • Find this author on PubMed
  • Search for this author on this site
MAI ONISHI
Department of Clinical Oncology, Juntendo University Graduate School of Medicine, Tokyo, Japan
  • Find this author on Google Scholar
  • Find this author on PubMed
  • Search for this author on this site
TOMOAKI FUJII
Department of Clinical Oncology, Juntendo University Graduate School of Medicine, Tokyo, Japan
  • Find this author on Google Scholar
  • Find this author on PubMed
  • Search for this author on this site
MASAKI HOSOYA
Department of Clinical Oncology, Juntendo University Graduate School of Medicine, Tokyo, Japan
  • Find this author on Google Scholar
  • Find this author on PubMed
  • Search for this author on this site
XUAN WEN
Department of Clinical Oncology, Juntendo University Graduate School of Medicine, Tokyo, Japan
  • Find this author on Google Scholar
  • Find this author on PubMed
  • Search for this author on this site
HIDENORI KIDO
Department of Clinical Oncology, Juntendo University Graduate School of Medicine, Tokyo, Japan
  • Find this author on Google Scholar
  • Find this author on PubMed
  • Search for this author on this site
SHUNSUKE KATO
Department of Clinical Oncology, Juntendo University Graduate School of Medicine, Tokyo, Japan
  • Find this author on Google Scholar
  • Find this author on PubMed
  • Search for this author on this site
  • For correspondence: katoshun@juntendo.ac.jp
  • Article
  • Figures & Data
  • Info & Metrics
  • PDF
Loading

Abstract

Background/Aim: The TP53-signature is a multi-gene signature that can predict TP53 structural mutations. It has presented remarkable ability to predict the prognosis of early-stage breast cancer. However, some samples presented discordance with the signature status and structure status. We aimed to investigate whether the mRNA expression levels or copy number variation (CNV) of MDM2 and CDKN2A influence the TP53-signature-score, subtype classification, and prognosis prediction in TP53 wild-type, luminal type early-stage breast cancer samples. Materials and Methods: We selected TP53 wild-type, luminal type early-stage breast cancer samples from The Cancer Genome Atlas (TCGA) and Molecular Taxonomy of Breast Cancer International Consortium (METABRIC) cohorts. Then, we analyzed the correlation between the TP53-signature-score and mRNA expression levels or CNV of MDM2 and CDKN2A. Results: The samples with MDM2 copy number (CN) amplification or those with CDKN2A CN deep deletion presented higher TP53-signature-score. Moreover, samples with MDM2 CN amplification or those with CDKN2A CN deep deletion had more characteristics of the luminal B type. In addition, they showed lower estrogen response early score, which correlated with response to endocrine therapy in breast cancer. However, MDM2 and CDKN2A mRNA expression did not present the same tendency. Furthermore, samples with MDM2 CN amplification or those with CDKN2A CN deep deletion had a worse prognosis in METABRIC cohort. Conclusion: The MDM2 or CDKN2A CNV may be useful for classifying subtypes and predicting prognosis more accurately in TP53 wild-type, luminal type early-stage breast cancer patients.

Key Words:
  • TP53
  • MDM2
  • CDKN2A
  • breast Cancer
  • copy number alteration

Breast cancer is the most common occurring cancer among women worldwide. The subtype classification of breast cancer plays a pivotal role in its treatment and the prediction of prognosis.

Breast cancer can be divided into luminal, human epidermal growth factor receptor 2 (HER2)-like, and Basal-like subtypes based on the immunohistochemical (IHC) status of estrogen receptor (ER), progesterone receptor (PgR), HER2, and Ki-67 clinically (1). Luminal type can be further divided into luminal A and luminal B. Luminal A type is both ER and PgR positive, HER2-negative, with low expression levels of the protein Ki-67. On the other hand, luminal B type is ER-positive, either PgR- and HER2-positive or -negative, with high expression levels of Ki-67 (1).

Several multi-gene signatures have been developed to predict prognosis and classify the breast cancer subtypes more accurately, like OncotypeDX, MammaPrint, and PAM50 (2-4). Among them, PAM50 can divide breast cancer into Luminal A, Luminal B, Normal-like, HER2-enriched, and Basal-like, five intrinsic subtypes with fifty genes, more accurately than IHC classification (5).

Luminal type patients are treated mainly with endocrine therapy clinically, and have a better prognosis than patients with other subtypes (6). However, luminal B type has a worse prognosis and is less sensitive to endocrine therapy than luminal A type (7, 8).

TP53 is a tumor suppressor gene, which encodes the p53 protein. p53 can regulate the expression of various downstream genes to maintain genomic stability (9). Mutations in TP53 can be found in the majority of solid tumors, and are correlated with tumorigenesis, tumor progression, and poor prognosis (10). The TP53-signature was constituted by differentially expressed genes (DEGs), which can predict the TP53 structural mutation in the breast cancer cohort (11).

Yamaguchi et al. demonstrated that the TP53-signature-score had a remarkable ability to predict the prognosis of early-stage breast cancer compared to other pre-existing multi-gene signatures (12). They indicated that TP53 structure mutated samples presented higher TP53-signature-score and defined them as TP53-signature mutant type. Interestingly, some patients presented with TP53-signature mutant type, although their TP53 structure was wild type. This discordance was mainly observed in luminal B type samples, which were classified using PAM50, and in some patients who had MDM2 mRNA over-expression.

MDM2 encodes an E3 ubiquitin ligase, MDM2 protein, which plays a critical role in regulating the normal function of p53 (13). It has been well studied that MDM2 and p53 form a negative feedback loop (14).

CDKN2A encodes p14ARF and p16INK4A proteins. Among them, p14ARF has been reported to bind to MDM2 and suppress its E3 ubiquitin ligase function, thereby stabilizing p53 (15). In addition, CDKN2A copy number (CN) loss and MDM2 CN amplification are mutually exclusive (16).

Although MDM2 and p14ARF can modulate the activity of p53, the relationship between the TP53-signature and MDM2 or CDKN2A remains unknown, because not all genes in the TP53-signature are downstream genes of p53.

In this study, we aimed to analyze whether MDM2 or CDKN2A mRNA expression levels or CNV influence the TP53-signature, and whether MDM2 or CDKN2A mRNA expression levels or CNV influence the features of luminal types and prognosis in The Cancer Genome Atlas (TCGA) and Molecular Taxonomy of Breast Cancer International Consortium (METABRIC) cohorts.

Materials and Methods

Clinical and transcriptomic data collection for breast cancer patients. TCGA (17) and METABRIC (18, 19) data were obtained from cBioportal (20, 21). We chose the female breast cancer patients who presented with TP53 structure wild type and early-stage luminal A or luminal B type from TCGA (n=189) and METABRIC (n=596) cohorts (Table I). In the downloaded clinical data, luminal A type and luminal B type were classified using the PAM50 method.

View this table:
  • View inline
  • View popup
  • Download powerpoint
Table I.

Clinical characteristics of the samples analyzed.

Estimation of the TP53-signature-score and estrogen response early score. Expression data of the thirty-one genes comprising the TP53-signature were obtained from TCGA and METABRIC (Supplementary Figure S1). The TP53-signature-score was calculated using a previously described method (12). The estrogen response early score was calculated using the method described before that employed R package “GSVA” (22-24).

Definition of CNV. The CNV in TCGA and METABIC cohorts analyzed were displayed as -2, -1, 0, 1, and 2. Following the instructions in cBioportal, we defined “-2” as deep deletion, “-1” as loss, “0” as diploid, “1” as low-levels gain, and “2” as amplification (25).

Statistical analysis. The Spearman’s rank correlation test was used to compare the relationship between the mRNA expression levels and signature score. The absolute values of rs>0.2 were defined as significantly correlated. Kruskal–Wallis test and Mann–Whitney U-test were used to compare group means. The p-value of the Kaplan– Meier survival curves was calculated using the log-rank test. Fisher’s Exact test was used for statistically analyzing patients’ characteristics except for age. All statistical tests were performed using R software (version 4.0.1) and EZR software (26). All plots were constructed by using the EZR software. A p-value less than 0.05 was considered statistically significant. Statistically significant results are shown in bold in figures and tables.

Results

MDM2 and CDKN2A mRNA expression levels were not significantly correlated with the TP53-signature-score or the features of luminal B type. To determine whether MDM2 or CDKN2A mRNA expression levels influence the TP53-signature-score, we analyzed the correlation between the TP53-signature-score and the mRNA expression levels of MDM2 and CDKN2A. We found that neither MDM2 nor CDKN2A mRNA expression levels showed a significant correlation with the TP53-signature-score (Figure 1A-D).

Figure 1.
  • Download figure
  • Open in new tab
  • Download powerpoint
Figure 1.

Correlation between TP53-sigature-score and the mRNA expression levels of MDM2 and CDKN2A. Correlation plots of the TP53-signature-score with the mRNA expression levels of MDM2 and CDKND2A in TCGA (A, B) and METABRIC (C, D) cohorts. p-Values were calculated using the Spearman’s rank correlation coefficient.

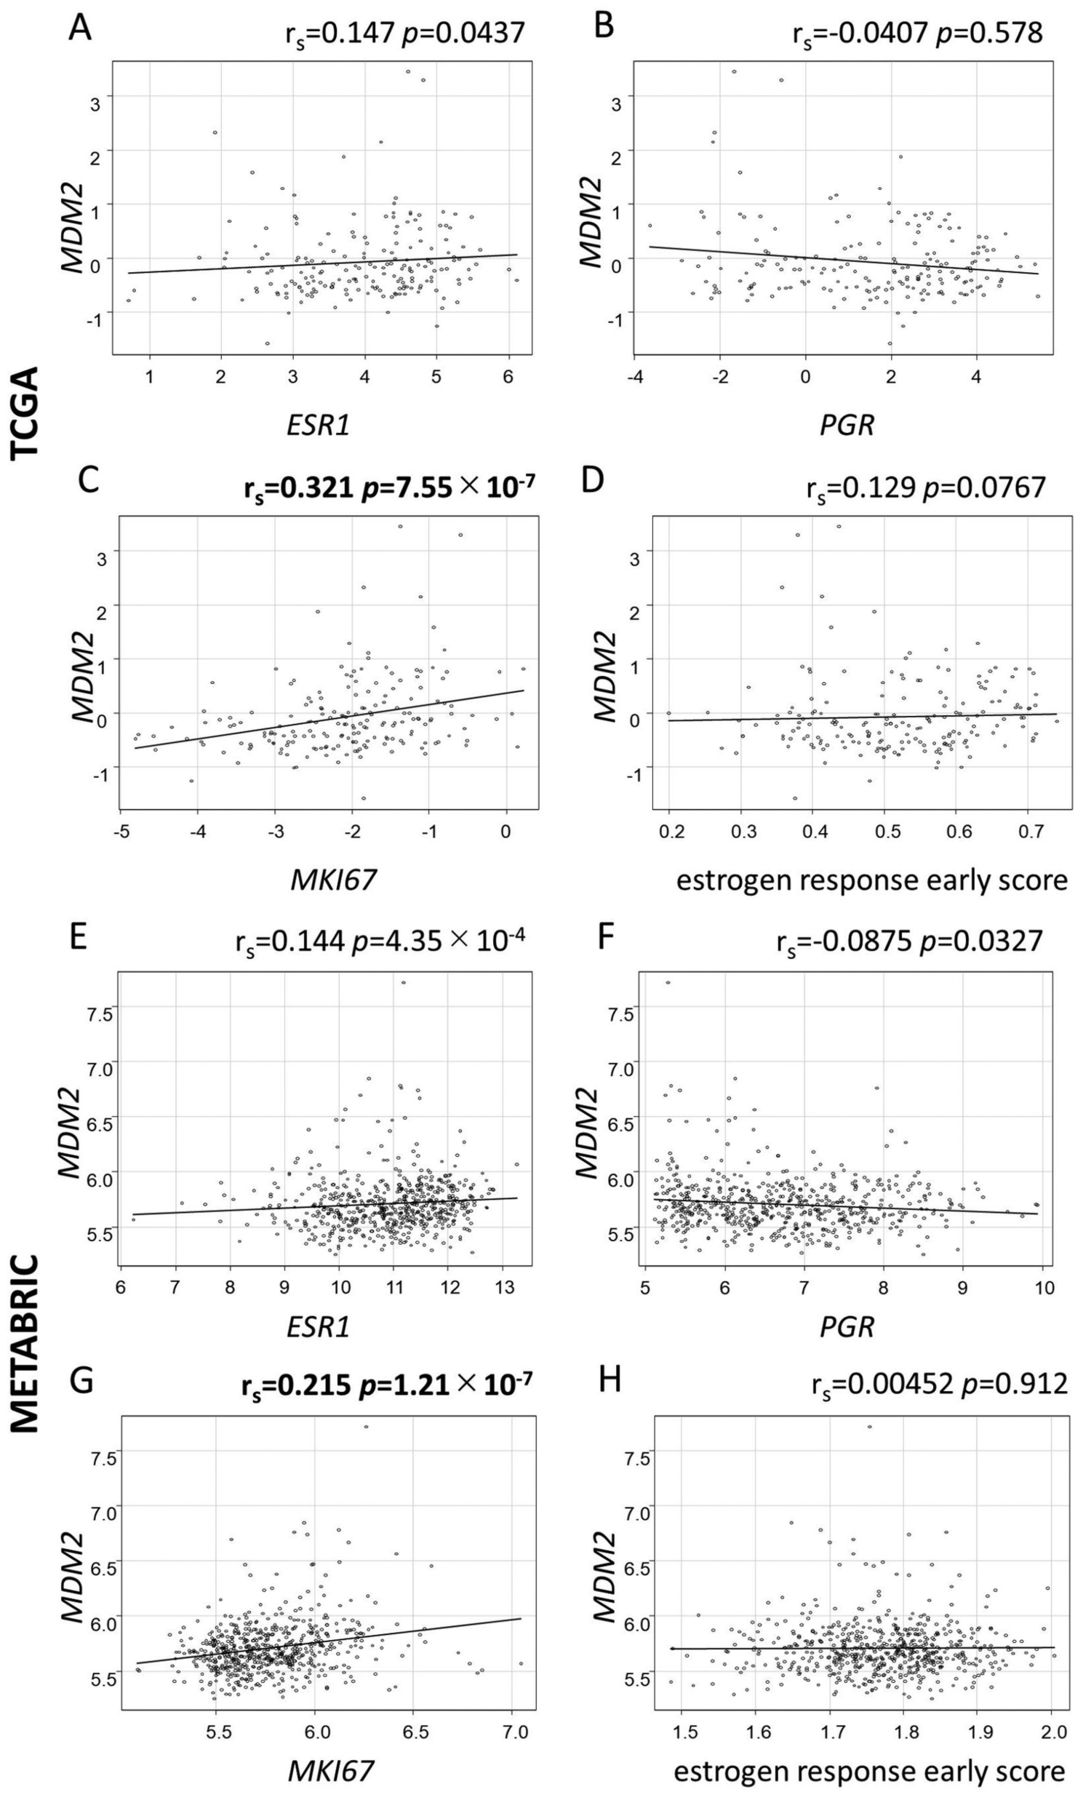
To study whether MDM2 and CDKN2A mRNA expression levels influence the features of luminal B types, we analyzed the correlation between MDM2 or CDKN2A mRNA expression levels and those of ESR1, PGR, and MKI67 mRNA expression levels, which encode ERα, PgR, and Ki-67, respectively (27). We found that MDM2 mRNA expression levels were not correlated with those of ESR1 or PGR mRNA expression levels (Figure 2A, B, E and F). However, MDM2 mRNA expression levels had a weak, positive correlation with those of MKI67 mRNA expression levels (Figure 2C and G). We also analyzed the relationship between the MDM2 mRNA expression levels and estrogen response early score, as it has been previously reported that a lower score may indicate resistance to endocrine therapy (20). We found that MDM2 mRNA expression levels were not significantly correlated with estrogen response early score (Figure 2D and H).

Figure 2.
  • Download figure
  • Open in new tab
  • Download powerpoint
Figure 2.

Correlation between MDM2 mRNA expression levels and the mRNA expression levels of ESR1, PGR, MKI67, and estrogen response early score. (A-C, E-G) Plots showing correlations between MDM2 mRNA expression levels and those of typical genes for luminal type (ESR1, PGR, MKI67) in both TCGA and METABRIC cohorts. (D, H) Plots showing correlations between MDM2 mRNA expression levels and the estrogen response early score. p-Values were calculated using Spearman’s rank correlation coefficient.

In TCGA cohort, CDKN2A mRNA expression levels presented a weak, negative relationship with those of ESR1 mRNA expression levels, but not in METABRIC cohort (Figure 3A and E). In addition, CDKN2A mRNA expression levels were not correlated with those of PGR or MKI67 mRNA expression levels (Figure 3B, C, F and G). CDKN2A mRNA expression levels were not correlated with estrogen response early score in neither TCGA nor METABRIC cohorts either (Figure 3D and H).

Figure 3.
  • Download figure
  • Open in new tab
  • Download powerpoint
Figure 3.

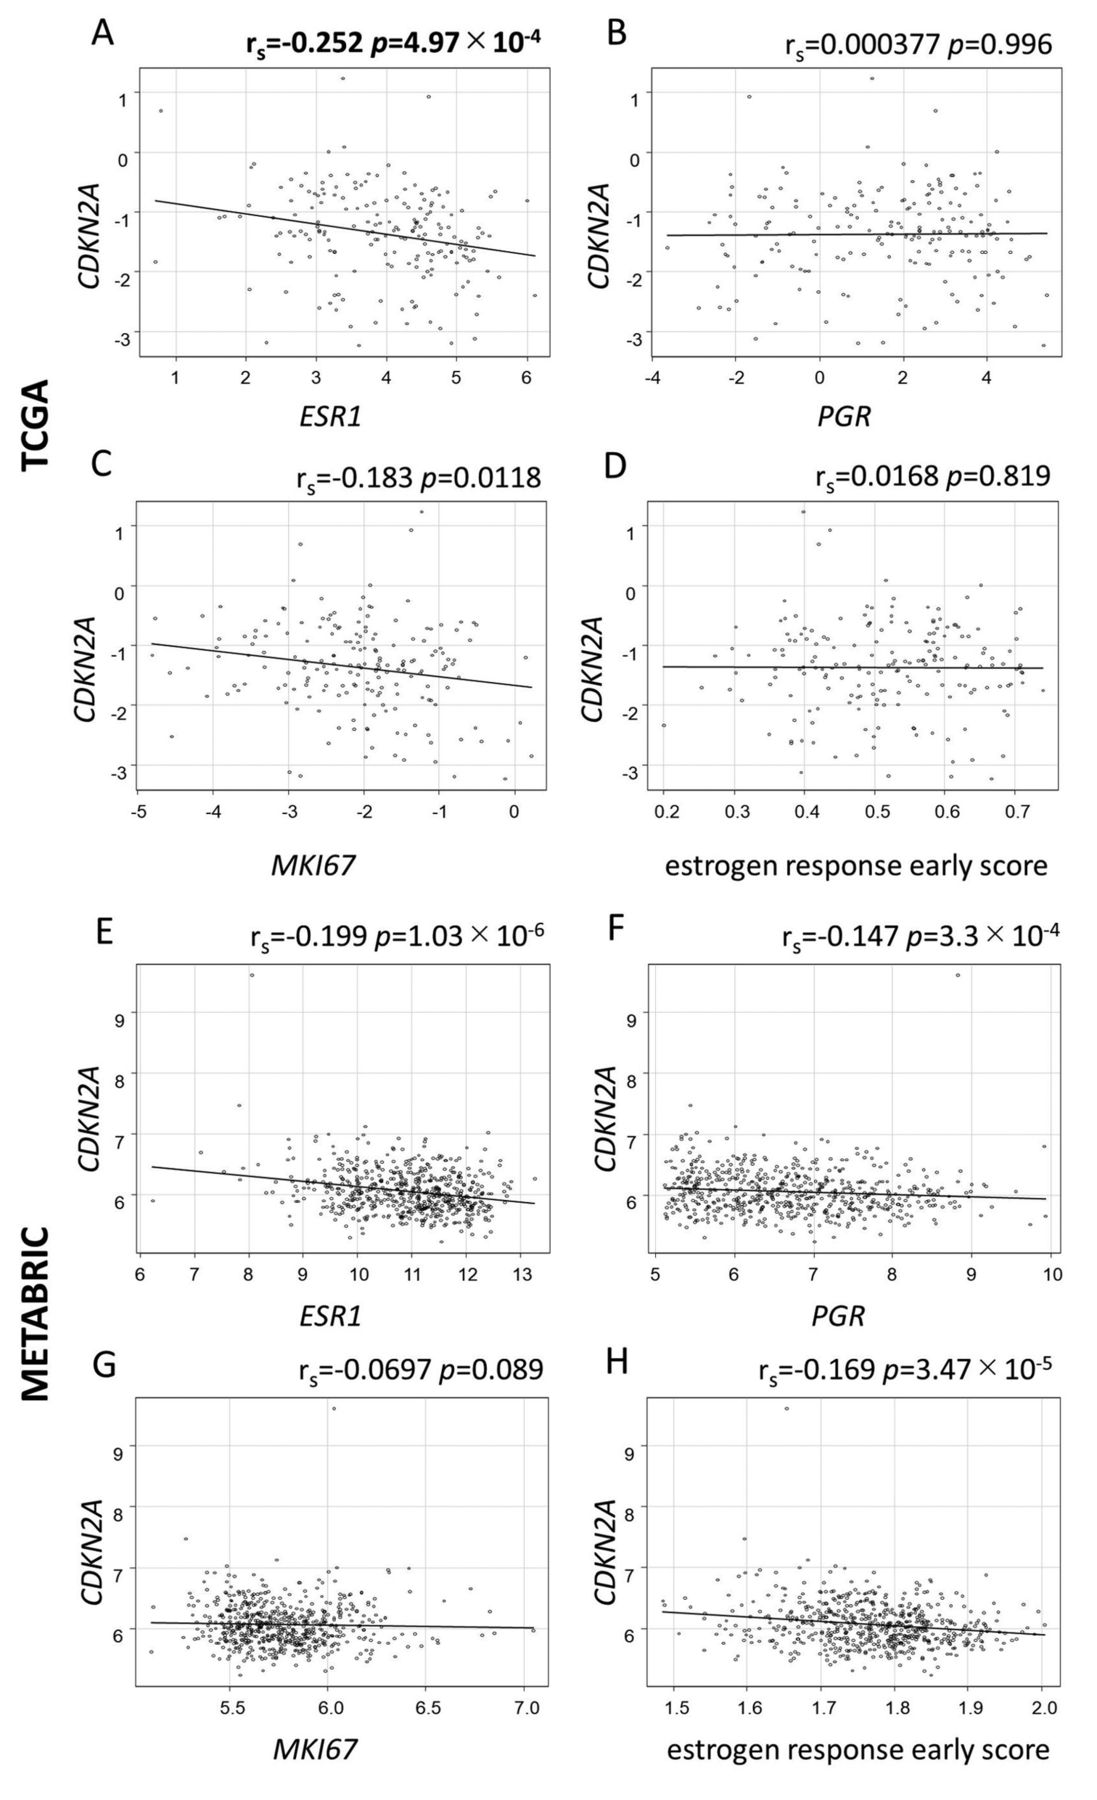
Correlation between CDKN2A mRNA expression levels and the mRNA expression levels of ESR1, PGR, MKI67, and estrogen response early score. (A-C, E-G) Plots showing correlations between CDKN2A mRNA expression levels and those of typical genes for luminal type (ESR1, PGR, MKI67) in both TCGA and METABRIC cohorts. (D, H) Plots showing the correlations between CDKN2A mRNA expression levels and the estrogen response early score in both TCGA and METABRIC cohorts. p-Values were calculated using Spearman’s rank correlation coefficient.

MDM2 and CDKN2A CNV were correlated with the TP53-signature-score and the features of luminal B type. We analyzed whether MDM2 and CDKN2A CNV influence the TP53-signature-score. In our results, samples with MDM2 CN amplification or those with CDKN2A CN deep deletion presented higher TP53-signature-score than other CNV samples (Figure 4A-D).

Figure 4.
  • Download figure
  • Open in new tab
  • Download powerpoint
Figure 4.

The TP53-signature-score is associated with the CNV of MDM2 and CDKN2A. (A, C) Boxplots of the comparison of the TP53-signature-score with the MDM2 CNV [(2) amplified, (1) gain, (-1, 0) not amplified] in both TCGA and METABRIC cohorts. (B, D) Boxplots of the comparison of the TP53-signature-score with the CDKN2A CNV [(-2) deep deletion, (-1) loss, (0, 1, 2) not deleted] in both TCGA and METABRIC cohorts. p-values were calculated using Kruskal–Wallis test and Mann–Whitney U-test. CNV: Copy number variation.

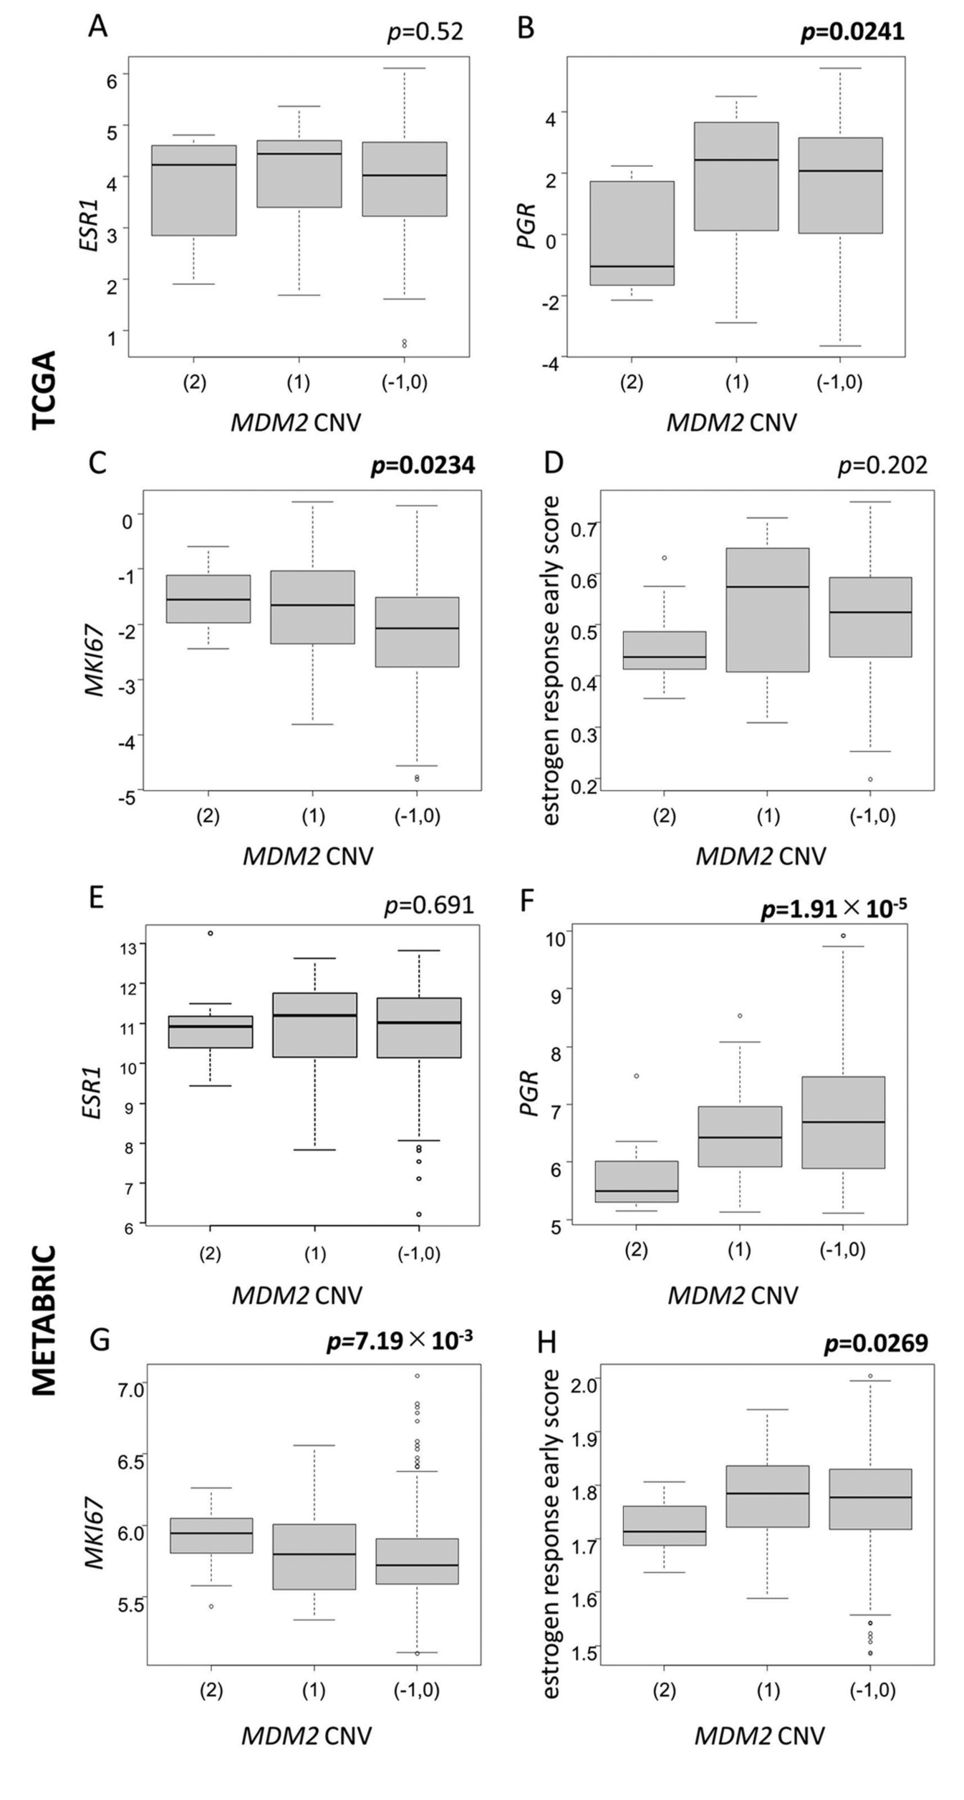
There were no significant differences regarding ESR1 mRNA expression levels (Figure 5A and E). However, the samples with MDM2 CN amplification presented lower PGR mRNA expression levels (Figure 5B and F) and higher MKI67 mRNA expression levels (Figure 5C and G). Estrogen response early score was lower in the samples with MDM2 CN amplification in both TCGA and METABRIC cohorts, and was statistically significant in the METABRIC cohort (Figure 5D and H).

Figure 5.
  • Download figure
  • Open in new tab
  • Download powerpoint
Figure 5.

The association between the MDM2 CNV and the mRNA expression levels of ESR1, PGR, MKI67, and estrogen response early score. (A-C, E-G) Boxplots of the comparison of typical genes for luminal type (ESR1, PGR, MKI67) with the MDM2 CNV [(2) amplified, (1) gain, (-1, 0) not amplified] in both TCGA and METABRIC cohorts. (D, H) Boxplots of the comparison of the estrogen response early score with the MDM2 CNV [(2) amplified, (1) gain, (-1, 0) not amplified] in both TCGA and METABRIC cohorts. p-Values were calculated using Kruskal–Wallis test and Mann–Whitney U-test. CNV: Copy number variation.

The samples with CDKN2A CN deep deletion presented higher ESR1 mRNA expression levels in TCGA cohort, but not in METABRIC cohort (Figure 6A and E). They also presented lower PGR mRNA expression levels, but not higher MKI67 mRNA expression levels (Figure 6B, C, F and G). The samples with CDKN2A CN deep deletion also presented lower estrogen response early score, but there were no statistically significant differences (Figure 6D and H). These results indicated that samples with MDM2 CN amplification or those with CDKN2A CN deep deletion defines better the luminal B type than their mRNA expression levels. These samples may present resistance to endocrine therapy.

Figure 6.
  • Download figure
  • Open in new tab
  • Download powerpoint
Figure 6.

Association between the CDKN2A CNV and the mRNA expression levels of ESR1, PGR, MKI67, and estrogen response early score. (A-C, E-G) Boxplots of the comparison of typical genes for luminal type (ESR1, PGR, MKI67) with the CDKN2A CNV [(-2) deep deletion, (-1) loss, (0, 1, 2) not deleted] in both TCGA and METABRIC cohorts. (D, H) Boxplots of the comparison of the estrogen response early score with CDKN2A CNV [(-2) deep deletion, (–1) loss, (0, 1, 2) not deleted] in both TCGA and METABRIC cohorts. p-Values were calculated by Kruskal–Wallis test and Mann–Whitney U-test. CNV: Copy number variation.

Samples with MDM2 CN amplification or those with CDKN2A CN deep deletion had worse prognosis. We compared the overall survival in TCGA and METABRIC cohorts with MDM2 and CDKN2A CNV.

In the METABRIC cohort, the Kaplan–Meier survival curves revealed that samples with MDM2 CN amplification or those with CDKN2A CN deep deletion presented worse prognosis (Figure 7A and B). The results of the samples with MDM2 CN amplification were consistent with those in previous reports (28, 29).

Figure 7.
  • Download figure
  • Open in new tab
  • Download powerpoint
Figure 7.

The Kaplan–Meier survival curves of MDM2 and CDKN2A CNV in METABRIC cohort. (A) Kaplan–Meier survival curves for overall survival between MDM2 CN (2) amplified (black), (1) gain (red), and (-1,0) not amplified (green). (B) Kaplan–Meier survival curves for overall survival between CDKN2A CN (-2) deep deleted (black), (-1) loss (red), and (0, 1, 2) not deleted (green). p-Values were calculated using the log-rank test. CNV: Copy number variation; CN: copy number.

However, there were no statistically significant differences in the median cut-off values of MDM2 and CDKN2A mRNA expression levels (Supplementary Figure S2A-D). About 10% of the samples had MDM2 CN gain and amplification in the METABRIC cohort, and 15% in the TCGA cohort (Supplementary Table S1 and Table S2). Therefore, we defined the samples with the top 10% and 15% of high MDM2 mRNA expression as the high group and the others as the low group, and then compared their overall survival. However, no significant differences were found (Supplementary Figure S3A-D). Regarding the inconsistent results of MDM2 mRNA expression levels and CNV, we found that some samples presented higher mRNA expression levels with CN not amplified, however, MDM2 mRNA expression levels were comparable with the CNV in most of the samples (Supplementary Figure S4A, B).

About 15% of the samples had CDKN2A CN loss and deep deletion in the METABRIC cohort, and 20% in TCGA cohort (Supplementary Table S1 and Table S2). Therefore, we defined the samples with the bottom 15% and 20% of low CDKN2A mRNA expression as the low group and the others as the high group, and then compared overall survival between these two groups. There were no statistically significant differences in TCGA cohort (Supplementary Figure S5A, C). However, the low group presented poor prognosis in METABRIC cohort (Supplementary Figure S5B, D).

Discussion

In this study, we demonstrated that the CNV of MDM2 or CDKN2A, but not their mRNA expression levels were correlated with the TP53-signature-score.

We also demonstrated that the samples with MDM2 CN amplification or those with CDKN2A CN deep deletion presented more characteristic of luminal B type than their mRNA expression levels. Especially, the samples with MDM2 CN amplification presented statistical significantly lower estrogen response early score in METABRIC cohort. A previous report demonstrated that MDM2 can degrade ERα (30). According to this relationship between MDM2 and ERα, we assumed that the amplified functional MDM2 destroys the ERα and results in a decrease in the dependency of the ER signal.

In regards to the inconsistent results of MDM2 mRNA expression levels and CNV, the splice variants of MDM2 were considered. It has been reported that MDM2 has several types of splice variants, and some of them have distinct functions from full-length MDM2 (31-33). However, many MDM2 splice variants functions are still not yet completely understood. Therefore, further research is required.

In contrast to MDM2, the CDKN2A mRNA expression levels presented the same tendency with their CNV to some extent. However, these results indicate that it is exceedingly difficult to set a common cut-off value for mRNA expression levels in clinical settings with different cohorts.

As this was a retrospective study, there are also some limitations. The major limitation was that we analyzed only two big cohorts. Moreover, the proportion of the samples that presented MDM2 CN amplification or CDKN2A CN deep deletion was less than 5%, therefore, the available data were limited.

Despite the small number of samples with MDM2 CN amplification or CDKN2A CN deep deletion, they are still worth measuring. Especially samples with MDM2 CN amplification have been reported to be correlated with a worse outcome after immune checkpoint inhibitor treatment in a pan-cancer analysis (34). We believe that they should be one of the indicators for considering a treatment plan more accurately.

In conclusion, our results demonstrated that the MDM2 or CDKN2A CNV may be more useful than their mRNA expression levels for classifying the subtypes and predicting the prognosis more accurately in TP53 wild-type, luminal type early-stage breast cancer patients.

Acknowledgements

This work was carried out (in part) at the Intractable Disease Research Center, Juntendo University, Tokyo, Japan. The Authors thank the Laboratory of Molecular and Biochemical Research, Biomedical Research Core Facilities, Juntendo University Graduate School of Medicine, Tokyo, Japan for technical assistance.

Footnotes

  • Authors’ Contributions

    Min Han: Conceptualization, Data curation, Formal analysis, Investigation, Methodology, Software, Validation, Visualization, Writing - original draft; Shigeo Yamaguchi: Conceptualization, Data curation, Formal analysis, Methodology, Software, Writing – review & editing; Mai Onishi: Formal analysis, Software, Writing – review & editing; Tomoaki Fujii: Methodology, Resource, Writing – review & editing; Masaki Hosoya: Formal analysis, Writing – review & editing; Xuan Wen: Writing – review & editing; Hidenori Kido: Writing – review & editing; Shunsuke Kato: Conceptualization, Project administration, Writing – review & editing.

  • Supplementary Material

    Supplementary material can be obtained at: <https://www.dropbox.com/sh/ndv7g89vuxnw0hs/AABkq7LPZUU-bOxJ2GQ7DvDoa?dl=0>

  • Conflicts of Interest

    The Authors declare no conflicts of interest in relation to this study.

  • Received February 25, 2022.
  • Revision received March 16, 2022.
  • Accepted March 18, 2022.
  • Copyright © 2022 International Institute of Anticancer Research (Dr. George J. Delinasios), All rights reserved.

This article is an open access article distributed under the terms and conditions of the Creative Commons Attribution (CC BY-NC-ND) 4.0 international license (https://creativecommons.org/licenses/by-nc-nd/4.0).

References

  1. ↵
    1. Inwald EC,
    2. Koller M,
    3. Klinkhammer-Schalke M,
    4. Zeman F,
    5. Hofstädter F,
    6. Gerstenhauer M,
    7. Brockhoff G and
    8. Ortmann O
    : 4-IHC classification of breast cancer subtypes in a large cohort of a clinical cancer registry: use in clinical routine for therapeutic decisions and its effect on survival. Breast Cancer Res Treat 153(3): 647-658, 2015. PMID: 26369534. DOI: 10.1007/s10549-015-3572-3
    OpenUrlCrossRefPubMed
  2. ↵
    1. van de Vijver MJ,
    2. He YD,
    3. van’t Veer LJ,
    4. Dai H,
    5. Hart AA,
    6. Voskuil DW,
    7. Schreiber GJ,
    8. Peterse JL,
    9. Roberts C,
    10. Marton MJ,
    11. Parrish M,
    12. Atsma D,
    13. Witteveen A,
    14. Glas A,
    15. Delahaye L,
    16. van der Velde T,
    17. Bartelink H,
    18. Rodenhuis S,
    19. Rutgers ET,
    20. Friend SH and
    21. Bernards R
    : A gene-expression signature as a predictor of survival in breast cancer. N Engl J Med 347(25): 1999-2009, 2002. PMID: 12490681. DOI: 10.1056/NEJMoa021967
    OpenUrlCrossRefPubMed
    1. Paik S,
    2. Shak S,
    3. Tang G,
    4. Kim C,
    5. Baker J,
    6. Cronin M,
    7. Baehner FL,
    8. Walker MG,
    9. Watson D,
    10. Park T,
    11. Hiller W,
    12. Fisher ER,
    13. Wickerham DL,
    14. Bryant J and
    15. Wolmark N
    : A multigene assay to predict recurrence of tamoxifen-treated, node-negative breast cancer. N Engl J Med 351(27): 2817-2826, 2004. PMID: 15591335. DOI: 10.1056/NEJMoa041588
    OpenUrlCrossRefPubMed
  3. ↵
    1. Parker JS,
    2. Mullins M,
    3. Cheang MC,
    4. Leung S,
    5. Voduc D,
    6. Vickery T,
    7. Davies S,
    8. Fauron C,
    9. He X,
    10. Hu Z,
    11. Quackenbush JF,
    12. Stijleman IJ,
    13. Palazzo J,
    14. Marron JS,
    15. Nobel AB,
    16. Mardis E,
    17. Nielsen TO,
    18. Ellis MJ,
    19. Perou CM and
    20. Bernard PS
    : Supervised risk predictor of breast cancer based on intrinsic subtypes. J Clin Oncol 27(8): 1160-1167, 2009. PMID: 19204204. DOI: 10.1200/JCO.2008.18.1370
    OpenUrlAbstract/FREE Full Text
  4. ↵
    1. Chia SK,
    2. Bramwell VH,
    3. Tu D,
    4. Shepherd LE,
    5. Jiang S,
    6. Vickery T,
    7. Mardis E,
    8. Leung S,
    9. Ung K,
    10. Pritchard KI,
    11. Parker JS,
    12. Bernard PS,
    13. Perou CM,
    14. Ellis MJ and
    15. Nielsen TO
    : A 50-gene intrinsic subtype classifier for prognosis and prediction of benefit from adjuvant tamoxifen. Clin Cancer Res 18(16): 4465-4472, 2012. PMID: 22711706. DOI: 10.1158/1078-0432.CCR-12-0286
    OpenUrlAbstract/FREE Full Text
  5. ↵
    1. Musgrove EA and
    2. Sutherland RL
    : Biological determinants of endocrine resistance in breast cancer. Nat Rev Cancer 9(9): 631-643, 2009. PMID: 19701242. DOI: 10.1038/nrc2713
    OpenUrlCrossRefPubMed
  6. ↵
    1. Tran B and
    2. Bedard PL
    : Luminal-B breast cancer and novel therapeutic targets. Breast Cancer Res 13(6): 221, 2011. PMID: 22217398. DOI: 10.1186/bcr2904
    OpenUrlCrossRefPubMed
  7. ↵
    1. Ades F,
    2. Zardavas D,
    3. Bozovic-Spasojevic I,
    4. Pugliano L,
    5. Fumagalli D,
    6. de Azambuja E,
    7. Viale G,
    8. Sotiriou C and
    9. Piccart M
    : Luminal B breast cancer: molecular characterization, clinical management, and future perspectives. J Clin Oncol 32(25): 2794-2803, 2014. PMID: 25049332. DOI: 10.1200/JCO.2013.54.1870
    OpenUrlAbstract/FREE Full Text
  8. ↵
    1. Levine AJ
    : p53: 800 million years of evolution and 40 years of discovery. Nat Rev Cancer 20(8): 471-480, 2020. PMID: 32404993. DOI: 10.1038/s41568-020-0262-1
    OpenUrlCrossRefPubMed
  9. ↵
    1. Rivlin N,
    2. Brosh R,
    3. Oren M and
    4. Rotter V
    : Mutations in the p53 tumor suppressor gene: important milestones at the various steps of tumorigenesis. Genes Cancer 2(4): 466-474, 2011. PMID: 21779514. DOI: 10.1177/1947601911408889
    OpenUrlCrossRefPubMed
  10. ↵
    1. Takahashi S,
    2. Moriya T,
    3. Ishida T,
    4. Shibata H,
    5. Sasano H,
    6. Ohuchi N and
    7. Ishioka C
    : Prediction of breast cancer prognosis by gene expression profile of TP53 status. Cancer Sci 99(2): 324-332, 2008. PMID: 18271932. DOI: 10.1111/j.1349-7006.2007.00691.x
    OpenUrlCrossRefPubMed
  11. ↵
    1. Yamaguchi S,
    2. Takahashi S,
    3. Mogushi K,
    4. Izumi Y,
    5. Nozaki Y,
    6. Nomizu T,
    7. Kakugawa Y,
    8. Ishida T,
    9. Ohuchi N,
    10. Ishioka C and
    11. Kato S
    : Molecular and clinical features of the TP53 signature gene expression profile in early-stage breast cancer. Oncotarget 9(18): 14193-14206, 2018. PMID: 29581837. DOI: 10.18632/oncotarget.24447
    OpenUrlCrossRefPubMed
  12. ↵
    1. Kubbutat MH,
    2. Jones SN and
    3. Vousden KH
    : Regulation of p53 stability by Mdm2. Nature 387(6630): 299-303, 1997. PMID: 9153396. DOI: 10.1038/387299a0
    OpenUrlCrossRefPubMed
  13. ↵
    1. Moll UM and
    2. Petrenko O
    : The MDM2-p53 interaction. Mol Cancer Res 1(14): 1001-1008, 2003. PMID: 14707283.
    OpenUrlAbstract/FREE Full Text
  14. ↵
    1. Sherr CJ and
    2. Weber JD
    : The ARF/p53 pathway. Curr Opin Genet Dev 10(1): 94-99, 2000. PMID: 10679383. DOI: 10.1016/s0959-437x(99)00038-6
    OpenUrlCrossRefPubMed
  15. ↵
    1. Sanchez-Vega F,
    2. Mina M,
    3. Armenia J,
    4. Chatila WK,
    5. Luna A,
    6. La KC,
    7. Dimitriadoy S,
    8. Liu DL,
    9. Kantheti HS,
    10. Saghafinia S,
    11. Chakravarty D,
    12. Daian F,
    13. Gao Q,
    14. Bailey MH,
    15. Liang WW,
    16. Foltz SM,
    17. Shmulevich I,
    18. Ding L,
    19. Heins Z,
    20. Ochoa A,
    21. Gross B,
    22. Gao J,
    23. Zhang H,
    24. Kundra R,
    25. Kandoth C,
    26. Bahceci I,
    27. Dervishi L,
    28. Dogrusoz U,
    29. Zhou W,
    30. Shen H,
    31. Laird PW,
    32. Way GP,
    33. Greene CS,
    34. Liang H,
    35. Xiao Y,
    36. Wang C,
    37. Iavarone A,
    38. Berger AH,
    39. Bivona TG,
    40. Lazar AJ,
    41. Hammer GD,
    42. Giordano T,
    43. Kwong LN,
    44. McArthur G,
    45. Huang C,
    46. Tward AD,
    47. Frederick MJ,
    48. McCormick F,
    49. Meyerson M, Cancer Genome Atlas Research Network,
    50. Van Allen EM,
    51. Cherniack AD,
    52. Ciriello G,
    53. Sander C and
    54. Schultz N
    : Oncogenic signaling pathways in the Cancer Genome Atlas. Cell 173(2): 321-337.e10, 2018. PMID: 29625050. DOI: 10.1016/j.cell.2018.03.035
    OpenUrlCrossRefPubMed
  16. ↵
    1. Cancer Genome Atlas Network
    : Comprehensive molecular portraits of human breast tumours. Nature 490(7418): 61-70, 2012. PMID: 23000897. DOI: 10.1038/nature11412
    OpenUrlCrossRefPubMed
  17. ↵
    1. Curtis C,
    2. Shah SP,
    3. Chin SF,
    4. Turashvili G,
    5. Rueda OM,
    6. Dunning MJ,
    7. Speed D,
    8. Lynch AG,
    9. Samarajiwa S,
    10. Yuan Y,
    11. Gräf S,
    12. Ha G,
    13. Haffari G,
    14. Bashashati A,
    15. Russell R,
    16. McKinney S, METABRIC Group,
    17. Langerød A,
    18. Green A,
    19. Provenzano E,
    20. Wishart G,
    21. Pinder S,
    22. Watson P,
    23. Markowetz F,
    24. Murphy L,
    25. Ellis I,
    26. Purushotham A,
    27. Børresen-Dale AL,
    28. Brenton JD,
    29. Tavaré S,
    30. Caldas C and
    31. Aparicio S
    : The genomic and transcriptomic architecture of 2,000 breast tumours reveals novel subgroups. Nature 486(7403): 346-352, 2012. PMID: 22522925. DOI: 10.1038/nature10983
    OpenUrlCrossRefPubMed
  18. ↵
    1. Pereira B,
    2. Chin SF,
    3. Rueda OM,
    4. Vollan HK,
    5. Provenzano E,
    6. Bardwell HA,
    7. Pugh M,
    8. Jones L,
    9. Russell R,
    10. Sammut SJ,
    11. Tsui DW,
    12. Liu B,
    13. Dawson SJ,
    14. Abraham J,
    15. Northen H,
    16. Peden JF,
    17. Mukherjee A,
    18. Turashvili G,
    19. Green AR,
    20. McKinney S,
    21. Oloumi A,
    22. Shah S,
    23. Rosenfeld N,
    24. Murphy L,
    25. Bentley DR,
    26. Ellis IO,
    27. Purushotham A,
    28. Pinder SE,
    29. Børresen-Dale AL,
    30. Earl HM,
    31. Pharoah PD,
    32. Ross MT,
    33. Aparicio S and
    34. Caldas C
    : The somatic mutation profiles of 2,433 breast cancers refines their genomic and transcriptomic landscapes. Nat Commun 7: 11479, 2016. PMID: 27161491. DOI: 10.1038/ncomms11479
    OpenUrlCrossRefPubMed
  19. ↵
    1. Gao J,
    2. Aksoy BA,
    3. Dogrusoz U,
    4. Dresdner G,
    5. Gross B,
    6. Sumer SO,
    7. Sun Y,
    8. Jacobsen A,
    9. Sinha R,
    10. Larsson E,
    11. Cerami E,
    12. Sander C and
    13. Schultz N
    : Integrative analysis of complex cancer genomics and clinical profiles using the cBioPortal. Sci Signal 6(269): pl1, 2013. PMID: 23550210. DOI: 10.1126/scisignal.2004088
    OpenUrlAbstract/FREE Full Text
  20. ↵
    1. Cerami E,
    2. Gao J,
    3. Dogrusoz U,
    4. Gross BE,
    5. Sumer SO,
    6. Aksoy BA,
    7. Jacobsen A,
    8. Byrne CJ,
    9. Heuer ML,
    10. Larsson E,
    11. Antipin Y,
    12. Reva B,
    13. Goldberg AP,
    14. Sander C and
    15. Schultz N
    : The cBio cancer genomics portal: an open platform for exploring multidimensional cancer genomics data. Cancer Discov 2(5): 401-404, 2012. PMID: 22588877. DOI: 10.1158/2159-8290.CD-12-0095
    OpenUrlAbstract/FREE Full Text
  21. ↵
    1. Hänzelmann S,
    2. Castelo R and
    3. Guinney J
    : GSVA: gene set variation analysis for microarray and RNA-seq data. BMC Bioinformatics 14: 7, 2013. PMID: 23323831. DOI: 10.1186/1471-2105-14-7
    OpenUrlCrossRefPubMed
    1. Liberzon A,
    2. Birger C,
    3. Thorvaldsdóttir H,
    4. Ghandi M,
    5. Mesirov JP and
    6. Tamayo P
    : The Molecular Signatures Database (MSigDB) hallmark gene set collection. Cell Syst 1(6): 417-425, 2015. PMID: 26771021. DOI: 10.1016/j.cels.2015.12.004
    OpenUrlCrossRefPubMed
  22. ↵
    1. Oshi M,
    2. Tokumaru Y,
    3. Angarita FA,
    4. Yan L,
    5. Matsuyama R,
    6. Endo I and
    7. Takabe K
    : Degree of early estrogen response predict survival after endocrine therapy in primary and metastatic ER-positive breast cancer. Cancers (Basel) 12(12): 3557, 2020. PMID: 33260779. DOI: 10.3390/cancers12123557
    OpenUrlCrossRefPubMed
  23. ↵
    1. Hwang KT,
    2. Kim BH,
    3. Oh S,
    4. Park SY,
    5. Jung J,
    6. Kim J,
    7. Choi IS,
    8. Jeon SY and
    9. Kim WY
    : Prognostic role of KRAS mRNA expression in breast cancer. J Breast Cancer 22(4): 548-561, 2019. PMID: 31897329. DOI: 10.4048/jbc.2019.22.e55
    OpenUrlCrossRefPubMed
  24. ↵
    1. Kanda Y
    : Investigation of the freely available easy-to-use software ‘EZR’ for medical statistics. Bone Marrow Transplant 48(3): 452-458, 2013. PMID: 23208313. DOI: 10.1038/bmt.2012.244
    OpenUrlCrossRefPubMed
  25. ↵
    1. Filipits M,
    2. Rudas M,
    3. Singer CF,
    4. Fitzal F,
    5. Bago-Horvath Z,
    6. Greil R,
    7. Balic M,
    8. Lax SF,
    9. Halper S,
    10. Hulla W,
    11. Wu NC,
    12. Liu X,
    13. Weidler J,
    14. Bates M,
    15. Hlauschek D,
    16. Gnant M and
    17. Dubsky P
    : ESR1, PGR, ERBB2, and MKi67 mRNA expression in postmenopausal women with hormone receptor-positive early breast cancer: results from ABCSG Trial 6. ESMO Open 6(4): 100228, 2021. PMID: 34371382. DOI: 10.1016/j.esmoop.2021.100228
    OpenUrlCrossRefPubMed
  26. ↵
    1. Choschzick M,
    2. Heilenkötter U,
    3. Lebeau A,
    4. Jaenicke F,
    5. Terracciano L,
    6. Bokemeyer C,
    7. Sauter G and
    8. Simon R
    : MDM2 amplification is an independent prognostic feature of node-negative, estrogen receptor-positive early-stage breast cancer. Cancer Biomark 8(2): 53-60, 2010. PMID: 21896991. DOI: 10.3233/DMA-2011-0806
    OpenUrlCrossRefPubMed
  27. ↵
    1. Wege AK,
    2. Rom-Jurek EM,
    3. Jank P,
    4. Denkert C,
    5. Ugocsai P,
    6. Solbach C,
    7. Blohmer JU,
    8. Sinn B,
    9. van Mackelenbergh M,
    10. Möbus V,
    11. Trumpp A,
    12. Marangoni E,
    13. Pfarr N,
    14. Irlbeck C,
    15. Warfsmann J,
    16. Polzer B,
    17. Weber F,
    18. Ortmann O,
    19. Loibl S,
    20. Vladimirova V and
    21. Brockhoff G
    : mdm2 gene amplification is associated with luminal breast cancer progression in humanized PDX mice and a worse outcome of estrogen receptor positive disease. Int J Cancer 150(8): 1357-1372, 2022. PMID: 34927257. DOI: 10.1002/ijc.33911
    OpenUrlCrossRefPubMed
  28. ↵
    1. Duong V,
    2. Boulle N,
    3. Daujat S,
    4. Chauvet J,
    5. Bonnet S,
    6. Neel H and
    7. Cavaillès V
    : Differential regulation of estrogen receptor alpha turnover and transactivation by Mdm2 and stress-inducing agents. Cancer Res 67(11): 5513-5521, 2007. PMID: 17545634. DOI: 10.1158/0008-5472.CAN-07-0967
    OpenUrlAbstract/FREE Full Text
  29. ↵
    1. Volk EL,
    2. Schuster K,
    3. Nemeth KM,
    4. Fan L and
    5. Harris LC
    : MDM2-A, a common Mdm2 splice variant, causes perinatal lethality, reduced longevity and enhanced senescence. Dis Model Mech 2(1-2): 47-55, 2009. PMID: 19132120. DOI: 10.1242/dmm.000992
    OpenUrlAbstract/FREE Full Text
    1. Rosso M,
    2. Okoro DE and
    3. Bargonetti J
    : Splice variants of MDM2 in oncogenesis. Subcell Biochem 85: 247-261, 2014. PMID: 25201199. DOI: 10.1007/978-94-017-9211-0_14
    OpenUrlCrossRefPubMed
  30. ↵
    1. Huun J,
    2. Gansmo LB,
    3. Mannsåker B,
    4. Iversen GT,
    5. Øvrebø JI,
    6. Lønning PE and
    7. Knappskog S
    : Impact of the MDM2 splice-variants MDM2-A, MDM2-B and MDM2-C on cytotoxic stress response in breast cancer cells. BMC Cell Biol 18(1): 17, 2017. PMID: 28415963. DOI: 10.1186/s12860-017-0134-z
    OpenUrlCrossRefPubMed
  31. ↵
    1. Fang W,
    2. Zhou H,
    3. Shen J,
    4. Li J,
    5. Zhang Y,
    6. Hong S and
    7. Zhang L
    : MDM2/4 amplification predicts poor response to immune checkpoint inhibitors: a pan-cancer analysis. ESMO Open 5(1): e000614, 2020. PMID: 33551066. DOI: 10.1136/esmoopen-2019-000614
    OpenUrlFREE Full Text
PreviousNext
Back to top

In this issue

Anticancer Research: 42 (5)
Anticancer Research
Vol. 42, Issue 5
May 2022
  • Table of Contents
  • Table of Contents (PDF)
  • Index by author
  • Back Matter (PDF)
  • Ed Board (PDF)
  • Front Matter (PDF)
Print
Download PDF
Article Alerts
Sign In to Email Alerts with your Email Address
Email Article

Thank you for your interest in spreading the word on Anticancer Research.

NOTE: We only request your email address so that the person you are recommending the page to knows that you wanted them to see it, and that it is not junk mail. We do not capture any email address.

Enter multiple addresses on separate lines or separate them with commas.
The MDM2 and CDKN2A Copy-number-variation Influence the TP53-signature-score in Wild-type TP53 Luminal Type Breast Cancer
(Your Name) has sent you a message from Anticancer Research
(Your Name) thought you would like to see the Anticancer Research web site.
CAPTCHA
This question is for testing whether or not you are a human visitor and to prevent automated spam submissions.
13 + 0 =
Solve this simple math problem and enter the result. E.g. for 1+3, enter 4.
Citation Tools
The MDM2 and CDKN2A Copy-number-variation Influence the TP53-signature-score in Wild-type TP53 Luminal Type Breast Cancer
MIN HAN, SHIGEO YAMAGUCHI, MAI ONISHI, TOMOAKI FUJII, MASAKI HOSOYA, XUAN WEN, HIDENORI KIDO, SHUNSUKE KATO
Anticancer Research May 2022, 42 (5) 2277-2288; DOI: 10.21873/anticanres.15707

Citation Manager Formats

  • BibTeX
  • Bookends
  • EasyBib
  • EndNote (tagged)
  • EndNote 8 (xml)
  • Medlars
  • Mendeley
  • Papers
  • RefWorks Tagged
  • Ref Manager
  • RIS
  • Zotero
Reprints and Permissions
Share
The MDM2 and CDKN2A Copy-number-variation Influence the TP53-signature-score in Wild-type TP53 Luminal Type Breast Cancer
MIN HAN, SHIGEO YAMAGUCHI, MAI ONISHI, TOMOAKI FUJII, MASAKI HOSOYA, XUAN WEN, HIDENORI KIDO, SHUNSUKE KATO
Anticancer Research May 2022, 42 (5) 2277-2288; DOI: 10.21873/anticanres.15707
del.icio.us logo Digg logo Reddit logo Twitter logo Facebook logo Google logo Mendeley logo
  • Tweet Widget
  • Facebook Like
  • Google Plus One

Jump to section

  • Article
    • Abstract
    • Materials and Methods
    • Results
    • Discussion
    • Acknowledgements
    • Footnotes
    • References
  • Figures & Data
  • Info & Metrics
  • PDF

Related Articles

  • No related articles found.
  • PubMed
  • Google Scholar

Cited By...

  • No citing articles found.
  • Google Scholar

More in this TOC Section

  • The Prognostic Significance of p16 and its Role as a Surrogate Marker for Human Papilloma Virus in Oral Squamous Cell Carcinoma: An Analysis of 281 Cases
  • Diagnostic Value of Circulating Cell-free DNA in Patients With Papillary Thyroid Cancer
  • Changes in Lysophospholipid Components in Ulcerative Colitis and Colitis-associated Cancer
Show more Experimental Studies

Similar Articles

Keywords

  • TP53
  • MDM2
  • CDKN2A
  • breast Cancer
  • copy number alteration
Anticancer Research

© 2022 Anticancer Research

Powered by HighWire