


Article Figures & Data
Figures
- Figure 1.
Cytotoxic activity of satraplatin against tumor cell lines of different origin as determined by the area under the dose–response curve (AUC). The median AUC value across all tested cell lines was 2.35. Tumor entities are indicated on the x-axis. Sensitivity of cells of hematopoietic and lymphoid malignancies was significantly higher compared with those from cancer of solid organs (analysis of variance, p=2.3×10⁻⁸).
- Figure 2.
Comparison of cytotoxicity to using satraplatin and cisplatin. The difference in half-maximal inhibitory concentration (IC50) values (cisplatin minus satraplatin; μM) was plotted for each cell line. The origin of each cell line is given in Table I. Enhanced killing of hematopoietic and lymphoid cancer cell lines was noted for satraplatin.
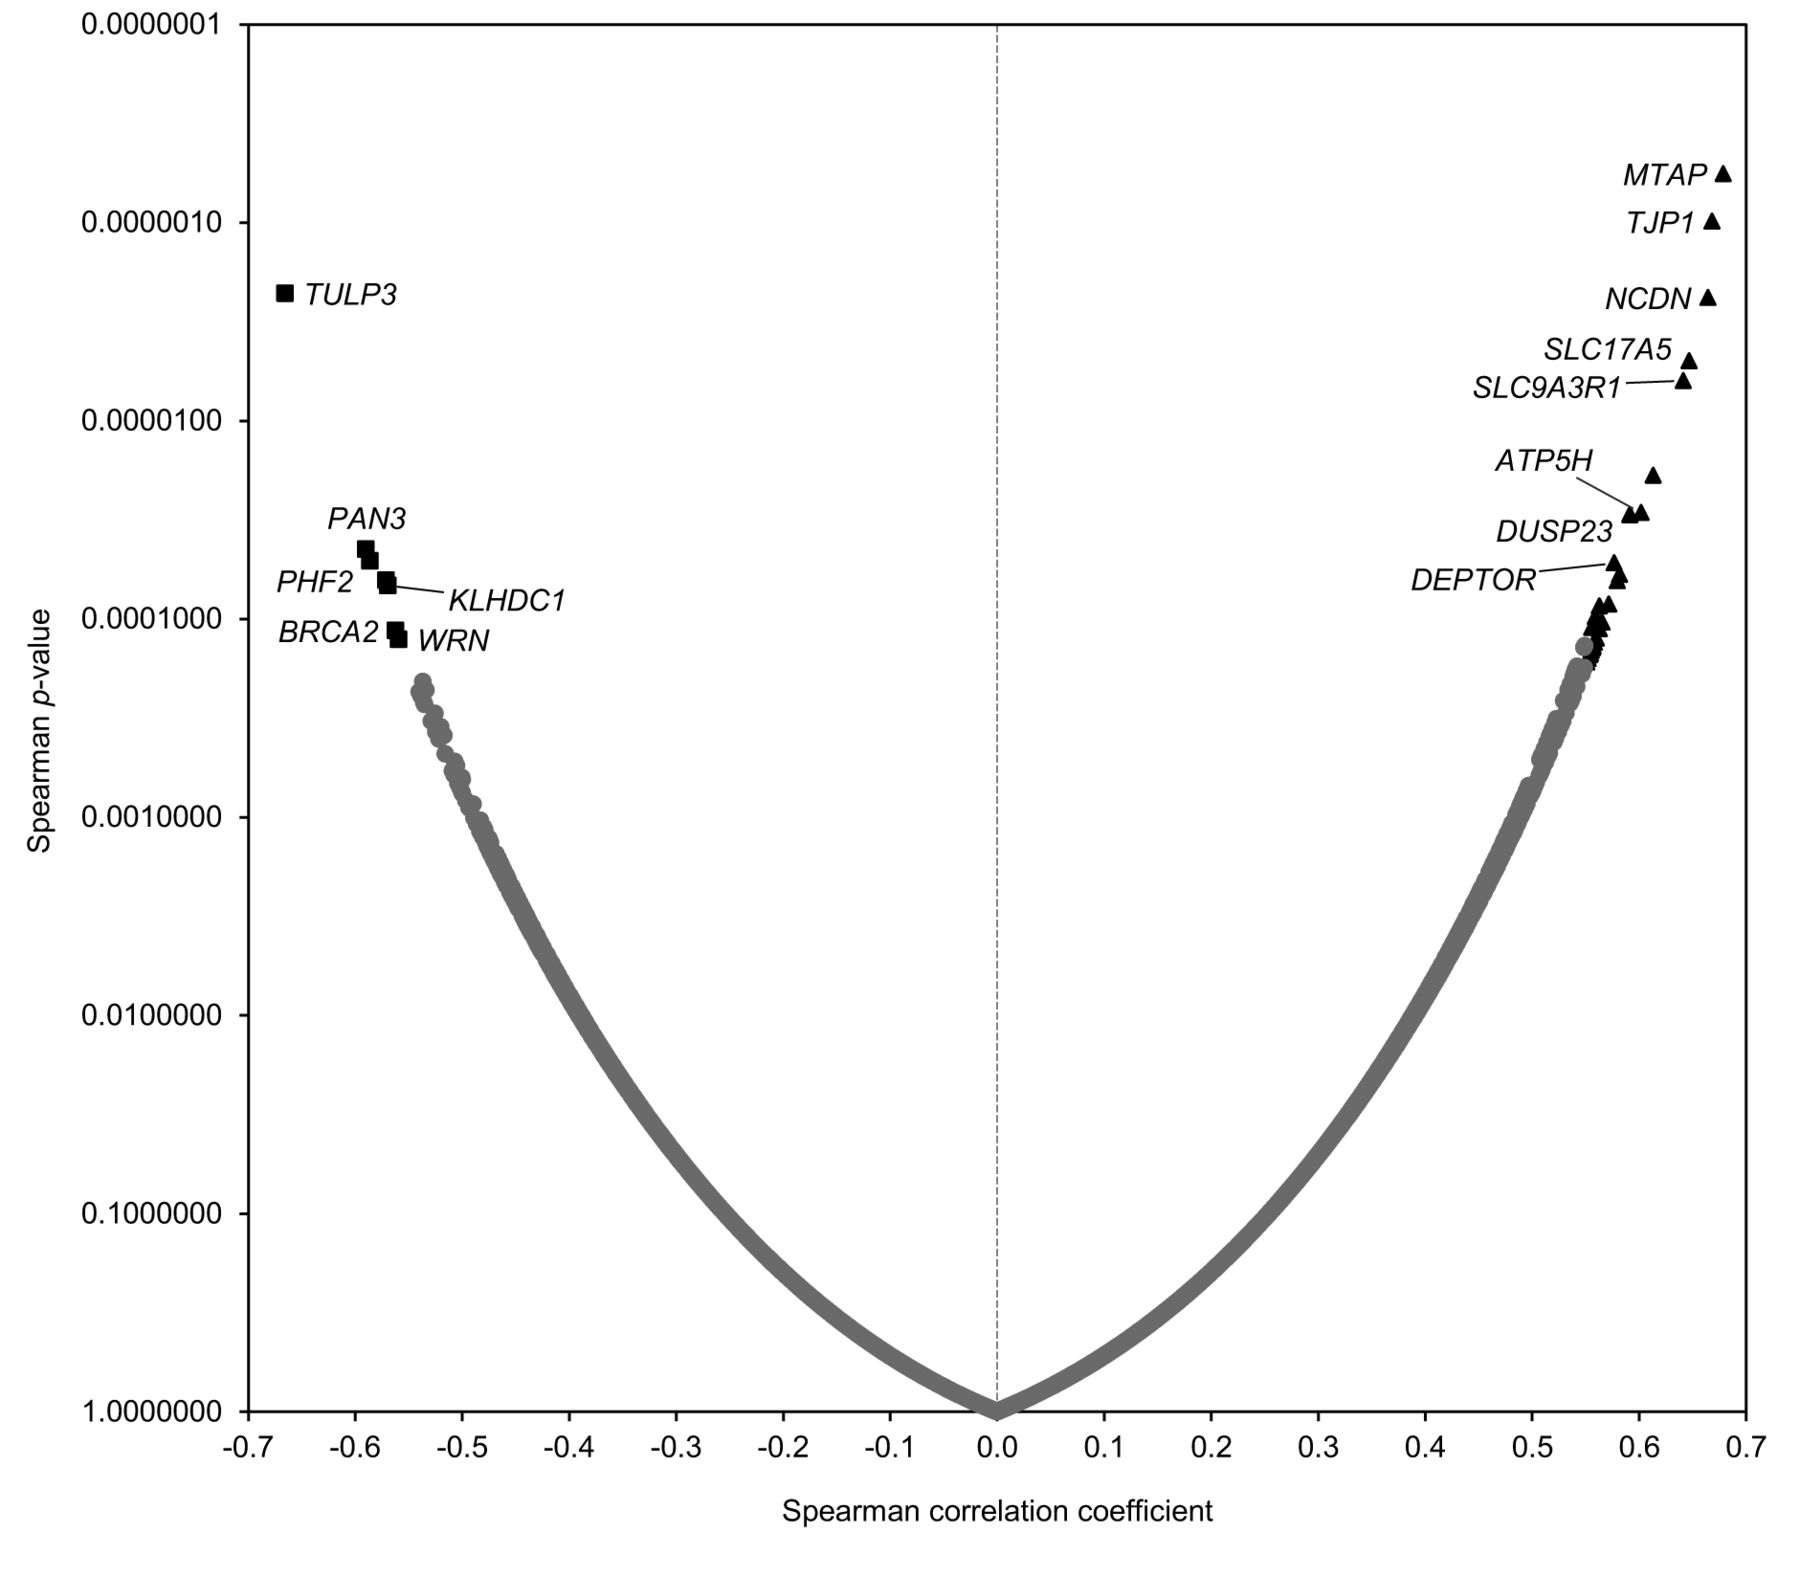
- Figure 3.
Volcano plot of analysis of correlation between the expression of specific genes and the area under the satraplatin dose–response curve (AUC) for hematopoietic and lymphoid cancer cell lines. Genes conferring enhanced satraplatin sensitivity are depicted on the left [e.g. BRCA2 DNA repair-associated (BRCA2), kelch domain-containing 1 (KLHDC1), poly(A)-specific ribonuclease subunit PAN3 (PAN3), PHD finger protein 2 (PHF2), TUB like protein 3 (TULP3), and WRN RecQ-like helicase (WRN)], those conferring resistance on the right [e.g. ATP synthase peripheral stalk subunit D (ATP5H), DEP domain-containing MTOR-interacting protein (DEPTOR), dual specificity phosphatase 23 (DUSP23), S-methyl-5’-thioadenosine phosphorylase (MTAP), neurochondrin (NCDN), solute carrier family 17 member 5 (SLC17A5), SLC9A3 regulator 1 (SLC9A3R1), tight junction protein 1 (TJP1)]. Genes achieving statistical significance are marked as black squares (sensitive) and black triangles (resistant).
- Figure 4.
Volcano plot of the area under the satraplatin dose–response curve (AUC) by gene signature at the mutation level. More and less sensitive groups of hematopoietic and lymphoid cancer cell lines were defined by considering the difference in AUC between those with gene deletion and those with wild-type gene. Gene deletions conferring enhanced satraplatin sensitivity are depicted on the left [adaptor-related protein complex 4 subunit epsilon 1 (AP4E1), amine oxidase copper-containing 1 (AOC1), B-cell lymphoma 2 (BCL2), BOC cell adhesion-associated oncogene-regulated (BOC), BRCA2 DNA repair-associated (BRCA2), crystallin beta-gamma domain-containing 3 (CRYBG3), DEAD-box helicase 3 X-linked (DDX3X), ethanolamine kinase 2 (ETNK2), FSHD region gene 1 family member B (FRG1B), IQ motif-containing N (KIAA1683), schlafen family member 5 (SLFN5), ubiquitin-specific peptidase 22 (USP22)], and those conferring resistance on the right [EPH receptor A8 (EPHA8), leucine-rich repeat-containing 61 (LRRC6), mitotic spindle-positioning (MISP), phospholipase D1 (PLD1), pregnancy-specific beta-1-glycoprotein 9 (PSG9), SNF2-related CREBBP activator protein (SRCAP) and taste 1 receptor member 2 (TAS1R2)]. Genes achieving statistical significance are marked as black squares (sensitive) and black triangles (resistant).
- Figure 5.
Volcano plot of the area under the satraplatin dose–response curve (AUC) by gene signature at the copy-number level. Again, more (left) and less (right) sensitive groups of hematopoietic and lymphoid cancer cell lines were defined by considering the difference in AUC between those with gene deletion and those with wild-type gene. Four genes highlighted as black squares were identified by copy-number deletion as biomarkers for enhanced satraplatin sensitivity [cyclin-dependent kinase inhibitor 2A (CDKN2A), cyclin-dependent kinase inhibitor 2B (CDKN2B), S-methyl-5’-thioadenosine phosphorylase (MTAP) and DMRT-like family A1 (DMRTA1)].
- Figure 6.
Satraplatin cytotoxicity as half-maximal inhibitory concentration (IC50) for the hematopoietic and lymphoid cancer cell lines examined and by S-methyl-5’-thioadenosine phosphorylase (MTAP) status. Cell lines are listed according to their sensitivity to satraplatin, with the most sensitive one listed at the top. MTAP status: Grey: wild-type; black: deficient; white: status undefined/unknown.


