


Abstract
Background/Aim: To identify the imaging and clinical features of hepatic neuroendocrine tumors (NETs) associated with peritumoral hyperintensity in the hepatobiliary phase of gadoxetic acid-enhanced magnetic resonance (MR) imaging. Patients and Methods: Fifty-seven patients with hepatic NETs were enrolled. Based on the degree of peritumoral hyperintensity, patients were divided into three groups: group 0 (no peritumoral hyperintensity), group 1 (lower peritumoral hyperintensity), and group 2 (higher peritumoral hyperintensity). The imaging and clinical findings were compared among the three groups. Results: Apparent diffusion coefficient (ADC) values of group 2 were significantly lower than those of group 0 and group 1. Atypical (cholangiocarcinoma-like) enhancement pattern in the arterial phase was significantly more frequently observed in group 2 as compared to that in group 0 and group 1. Group 2 patients showed significantly poorer progression-free survival than group 0 patients. Conclusion: Hepatic NETs with greater peritumoral hyperintensity exhibit greater malignant potential.
Neuroendocrine tumors (NETs) originate in the gastrointestinal tract, pancreas, bronchopulmonary tree, and thyroid; these tumors exhibit a wide range of malignant potential (1, 2). The liver is the most common site of metastasis in patients with NETS; liver metastases are observed in approximately 80% of patients with metastases (3). Liver metastasis is one of the most important prognostic factors with respect to survival of patients with NETs (4). Therefore, once a diagnosis of NET is established, appropriate investigations such as computed tomography (CT) or magnetic resonance (MR) imaging are needed. Gadoxetic acid is a hepatobiliary-specific contrast medium for MR imaging, which is taken up by functioning hepatocytes (5, 6). Tumors such as NETs that lack functioning hepatocytes usually show hypointensity compared to the background liver in the hepatobiliary phase (HBP) (5). Studies have shown a higher sensitivity of gadoxetic acid–enhanced MR imaging in the detection of hepatic metastases (7, 8).
In clinical practice, we sometimes encounter hepatic NETs that show hyperintense rim surrounding the tumor (peri-tumoral hyperintensity) in the HBP of gadoxetic acid-enhanced MR imaging. The mechanism of peri-tumoral hyperintensity is not clear. According to a recent study, peritumoral hyperintensity in hepatocellular carcinoma (HCC) suggests histological peri-tumoral hyperplasia of hepatocytes and a higher incidence of microscopic hepatic venous invasion (9). The authors proposed that the peri-tumoral hyperintensity may be attributable to the regenerative changes of the peritumoral hepatocytes induced by tumor compression (9). We speculated that the degree of peri-tumoral hyperintensity reflects the degree of tumor compression of the surrounding hepatocytes, and might have some relationship with the biological behavior of hepatic NETs. The purpose of the present study was to identify the imaging and clinicopathological features of hepatic NETs associated with peritumoral hyperintensity in the HBP of gadoxetic acid-enhanced MR imaging.
Patients and Methods
Patients. Our institutional review board approved this study (IRB 201903807). The requirement for written informed consent was waived owing to the retrospective nature of the study. Between April 2014 and November 2018, 57 patients with pathologically proven hepatic NETs who underwent gadoxetic acid-enhanced MR imaging were enrolled. The pathological specimens were obtained from the hepatic lesion and/or the metastatic lesion. Of the 57 patients, 29 were men and 27 were women. The mean age of patients was 61.1 years (range=28-85 years). The primary sites of the metastatic lesions were small bowel (n=30), pancreas (n=11), lung (n=10), rectum (n=1), and unknown (n=5).
MR techniques. Gadoxetic acid-enhanced MR imaging was performed using a clinical 1.5-T MR system (Avanto/Aera, Siemens, Erlangen, Germany) with a phased-array coil.
For the dynamic study, fat suppressed gradient-echo T1-weighted images with a three-dimensional (3D) acquisition sequence were obtained. For the gadoxetic acid-enhanced MRI, a multiphase dynamic study including arterial dominant, portal, late and hepatobiliary phases was performed. The total amount of gadoxetic acid (Eovist: Bayer Healthcare, Berlin, Germany) (2.0 ml/kg body weight) was intravenously injected at the rate of 2.0 ml/s, followed by a 25 ml physiological saline flush using an automatic injector. We used the test injection method to determine the optimal scan timing of the arterial dominant phase. A test dose of 2 ml of gadoxetic acid was injected and flushed with 25 ml of physiological saline at the same injection rate. The detailed imaging parameters were as follows: quick fat saturation, relaxation time/echo time (TR/TE)=4.28/2.02 ms; flip angle (FA) 10°; field of view (FOV) 42 cm; matrix 192×256; slice thickness=2.3 mm.
Additionally, axial diffusion-weighed imaging (DWI), T1-weighted imaging without fat suppression (FS), and T2-weighted imaging without FS were used in this study. The imaging parameters for axial DWI were as follows: spectral attenuated inversion recovery (SPAIR), TR/TE=5,200/62 ms; FOV 40 cm; matrix 156×192; slice thickness 6 mm; b-factors of 50, 400, and 800 s/mm2. Apparent diffusion coefficient (ADC) maps were automatically generated on the operating console using all three images with b-factors of 50, 400, and 800 s/mm2 and linear fitting. The imaging parameters for T1WI were: TR/TE=217/4.76 msec; FA 90°; FOV 40 cm; matrix 192×256; slice thickness 5 mm. The imaging parameters for T2WI were: TR/TE=1100/182 msec; FA 150°; FOV 40 cm; matrix 192×256; slice thickness 5 mm.
Image analysis. Images of all axial sections of the lesions were independently evaluated by two radiologists (NF and AH, with 15 and 5 years of experience in abdominal imaging, respectively). Both radiologists were blinded to the clinical and pathological results. In patients with multiple hepatic NETs, the largest lesion was evaluated. Lesions that exhibited apparent post-treatment change (e.g., after surgery, intervention, or ablation) were not evaluated. Peri-tumoral enhancement in the HBP was qualitatively defined as a hyperintense rim surrounding the tumor (9). Additionally, we divided the grade of peritumoral hyperintensity in the HBP according to the degree of the peritumoral hyperintense signal: group 0 (no peritumoral hyperintensity); group 1 (lower enhancement compared to the right/left hepatic duct or extrahepatic bile duct); and group 2 (equivalent to or greater enhancement compared to the right/left hepatic duct or extrahepatic bile duct). Interobserver agreement between the two radiologists was evaluated using weighted κ statistics as follows: κ value <0.20: poor agreement; 0.20-0.39: fair agreement; 0.40-0.59: moderate agreement; 0.60-0.79: substantial agreement; and >0.80: excellent agreement. Data analysis was performed after evaluating the results in a consensus manner.
Additionally, MR images were analyzed for the following parameters for each lesion: lesion maximal diameter; signal-intensity on T1-weighted and T2-weighted MR images (hypo-, iso-, or hyperintensity). The ADC value of the lesion was measured by placing a region of interest (ROI) on the solid portion of the lesion on the ADC map. Arterial enhancement pattern was classified into hypervascular, atypical (cholangiocarcinoma-like), or hypovascular pattern (10). Hypervascular pattern was defined as non-rim arterial phase hyperenhancement of the tumor. Atypical (cholangiocarcinoma-like) pattern was defined as rim enhancement in the arterial phase. Hypovascular pattern was defined as minimal or no enhancement during the arterial phase. These imaging features of each lesion were also evaluated by one radiologist (NF, with 15 years of experience in abdominal imaging).
Progression-free survival rate of patients with hepatic NETs. We were able to obtain prognostic data pertaining to 43 of the 57 patients who were followed up at our institution. Progression-free survival rate was analyzed using computed tomography or MRI findings. Disease progression was defined as ≥20% progression in tumor size or the development of new lesions, according to the Response Criteria in Solid Tumors (RECIST) 1.1. The median follow-up period was 215 days (range=51-1,175 days). The progression-free survival rates were compared between the three groups.
Statistical analysis. The Kruskal–Wallis test and Mann–Whitney U test were used to assess the correlation between the signal intensity pattern in the HBP and continuous variables (tumor size and ADC values). The Fisher’s exact test was used to analyze the correlation between the signal intensity pattern in the HBP and nominal variables (arterial enhancement pattern, signal intensity on T1-weighed and T2-weighed images). Progression-free survival was evaluated using the Kaplan–Meier method and between-group differences assessed using the log-rank test. First, we compared these factors among the three lesion groups. Factors that showed a significant between-group difference were compared between each pair of groups. JMP 13.2.1 software (SAS Institute, Cary, NC, USA) was used for statistical analysis. p-Values <0.05 were considered indicative of statistical significance.
Results
Peritumoral intensity in the HBP and other imaging findings. Twelve patients (21.1%) were classified as group 0, 23 patients (40.4%) as group 1, and 22 patients (38.6%) as group 2. There was excellent interobserver agreement in this respect (weighted κ-value: 0.807).
The imaging findings in the three groups are summarized in Table I. The ADC values were significantly different among the three groups (p=0.001, group 0, 1.32±0.54×10⁻³ mm2/s; group 1, 0.83±0.02×10⁻³ mm2/s; group 2, 0.61±0.20×10⁻³ mm2/s). The ADC values of group 2 were significantly lower than those of group 0 (p<0.001) and group 1 (p=0.002). The ADC values of group 1 were significantly lower than that of group 0 (p=0.001).
Comparison of the imaging findings among group 0, group 1, and group 2.
The frequency of arterial enhancement pattern was significantly different among the three groups (p<0.001). Atypical (cholangiocarcinoma-like) enhancement pattern in the arterial phase was significantly more frequently observed in group 2 tumors (72.7 %) as compared to that in group 0 (25.0 %) and group 1 (8.7%) tumors (p=0.012 and p<0.001, respectively). Hypervascular pattern was significantly more frequently observed in group 1 tumors (78.3%) as compared to that in group 0 (33.3 %) and group 2 (22.7%) tumors (p=0.024 and p<0.001, respectively). Hypovascular pattern was significantly more frequently observed in group 0 tumors (41.7 %) than in group 2 (4.6 %) tumors (p=0.014).
Tumor size and signal intensity on T1-weighted and T2-weighted images were not significantly different among the three groups. Figure 1, Figure 2 and Figure 3 show the representative imaging findings for each of the lesion groups.
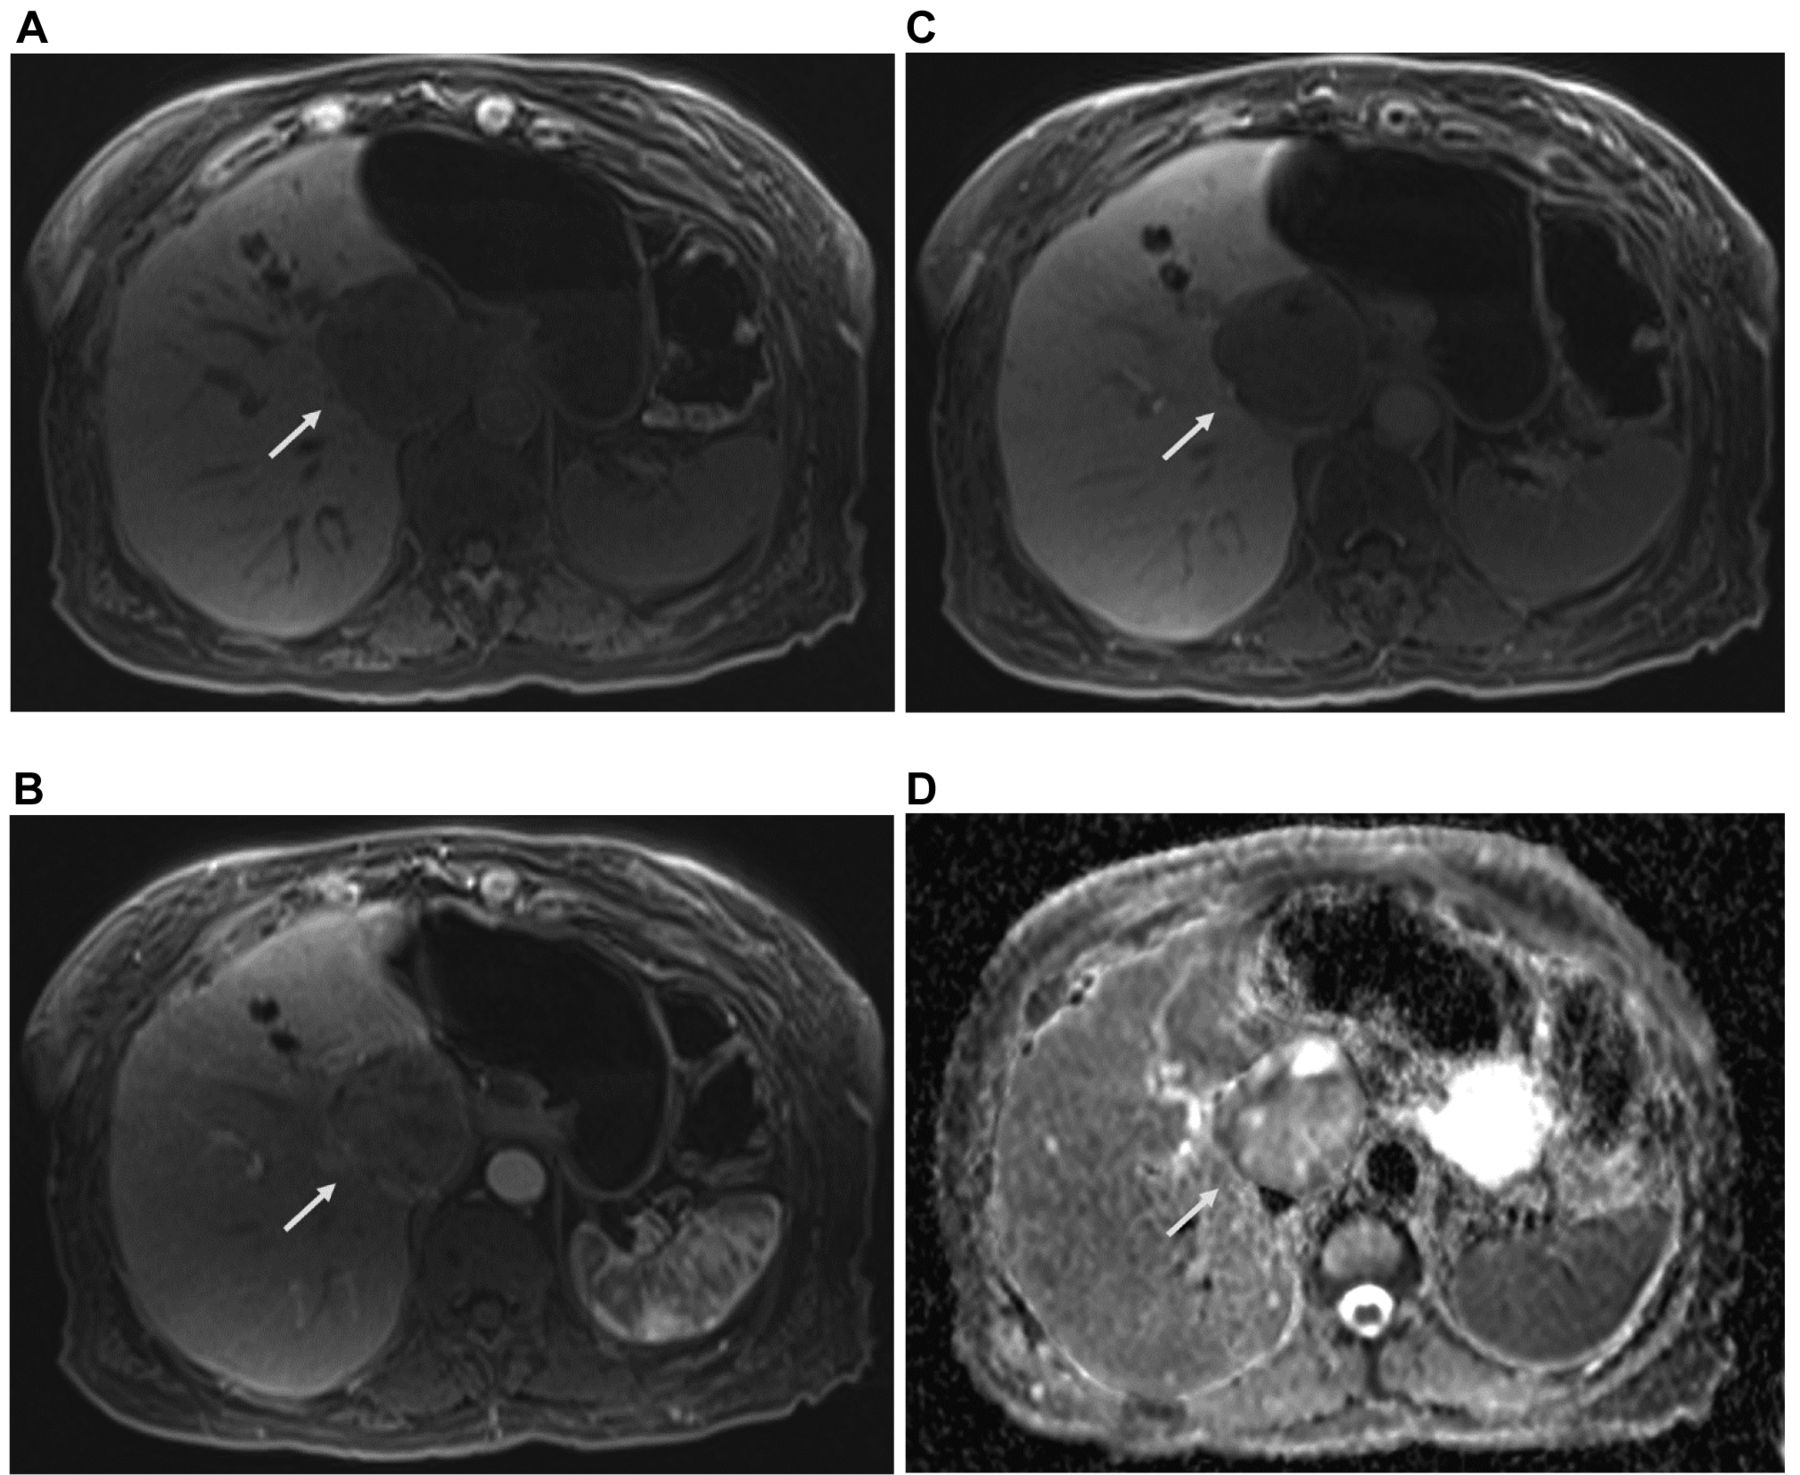
A 79-year-old woman with hepatic neuroendocrine tumor (arrow). On gadoxetic-enhanced MR imaging, the tumor shows hypointensity in the precontrast scan (A), appears hypovascular in the arterial phase (B), and shows no peritumoral enhancement in the hepatobiliary phase (C) (group 0). In the ADC map (D), the ADC value of the tumor was 1.52×10⁻³ mm2/s. ADC: Apparent diffusion coefficient.

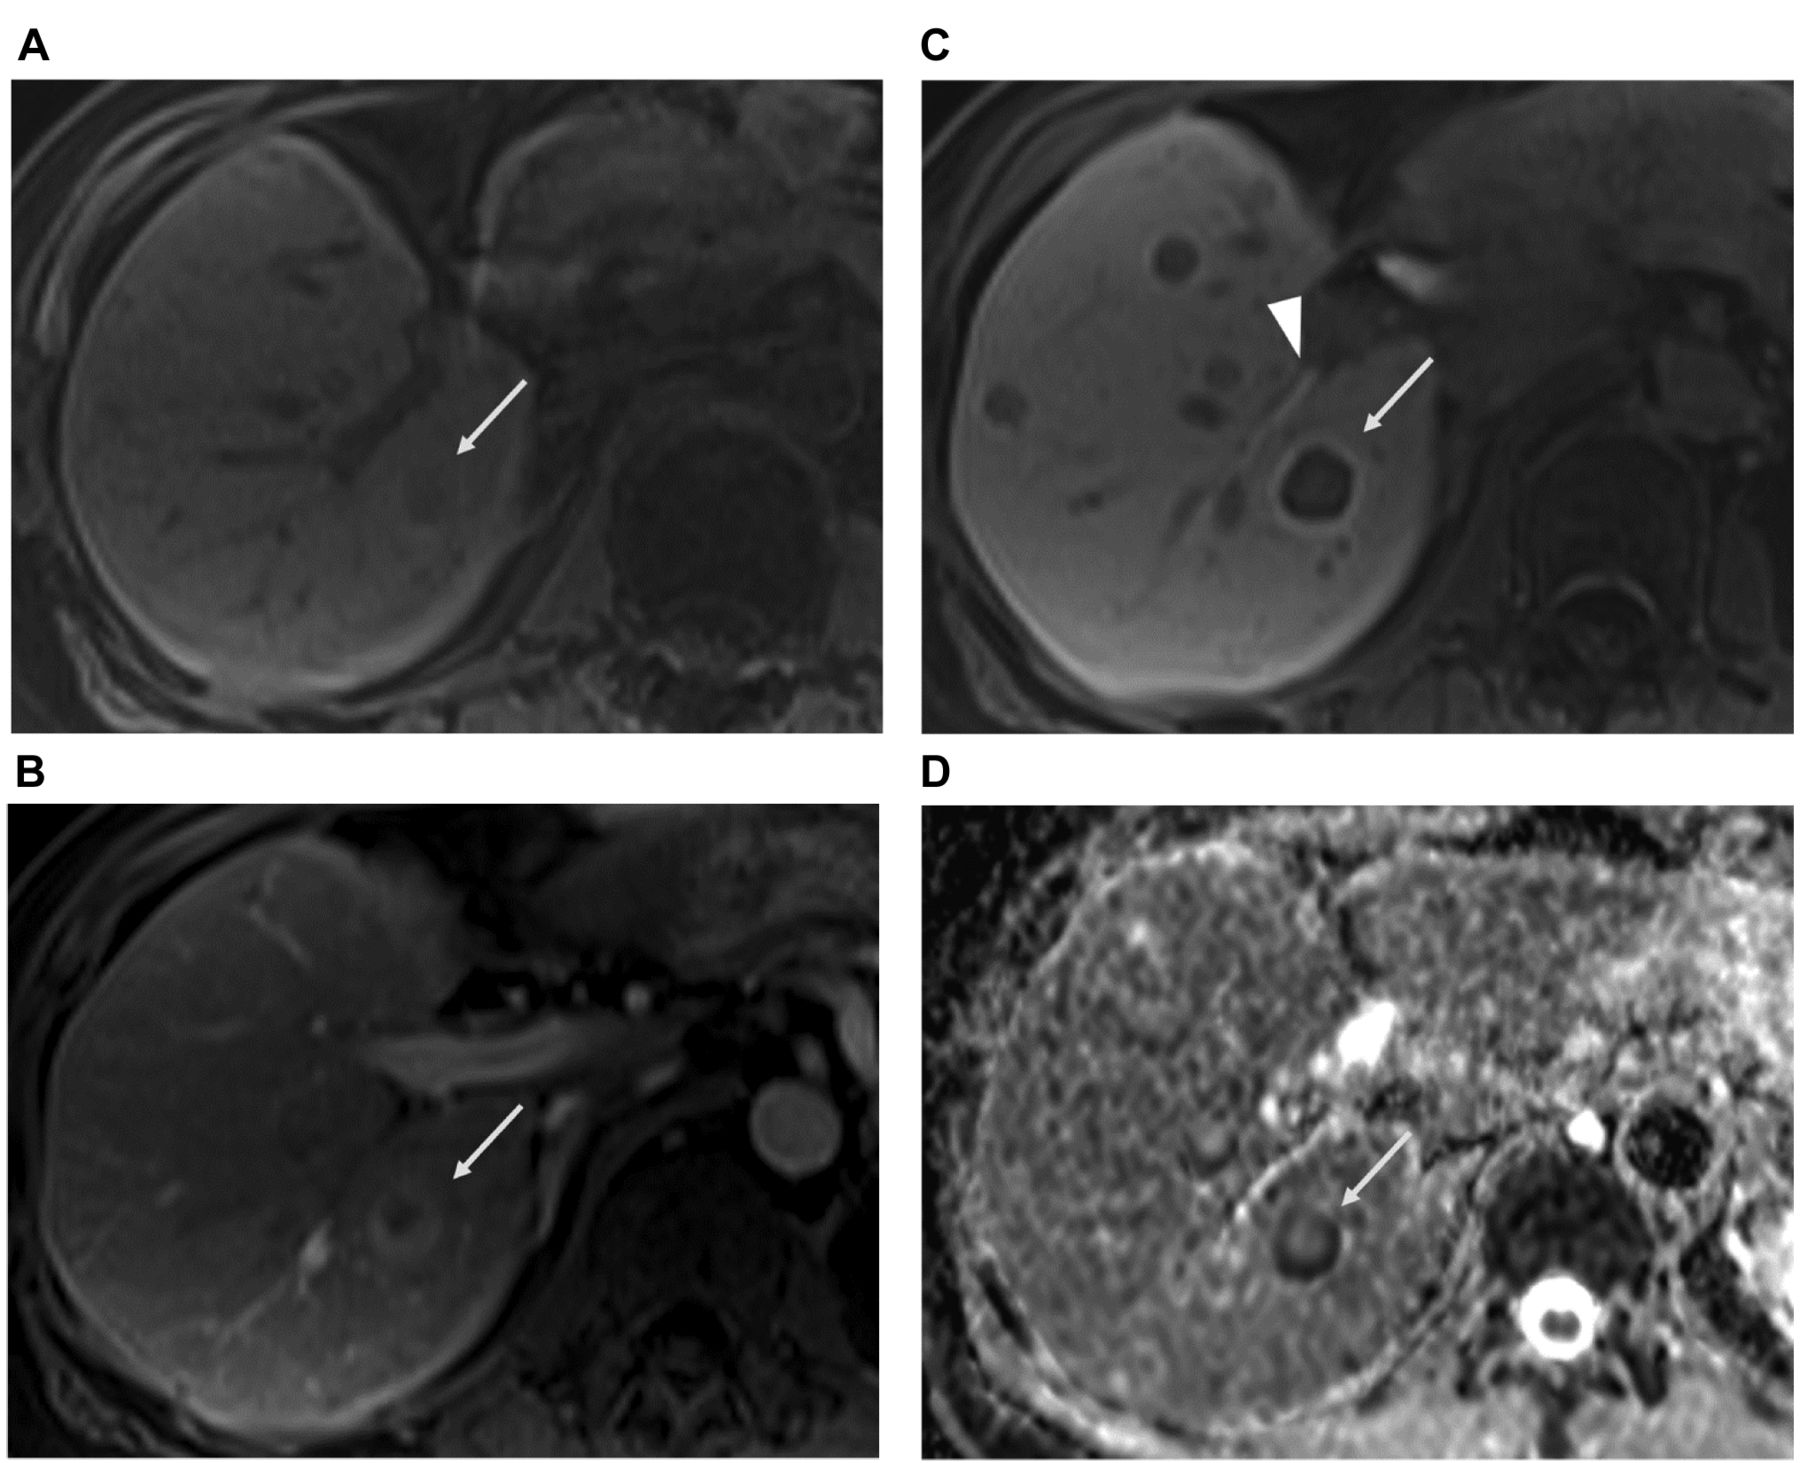
A 39-year-old woman with hepatic neuroendocrine tumor (arrow). On gadoxetic-enhanced MR imaging, the tumor shows hypointensity in the precontrast scan (A) and appears hypervascular in the arterial phase (B). In the hepatobiliary phase, the tumor shows mild peritumoral enhancement (C), which is lower compared to the extrahepatic bile duct (arrowhead) (group 1). In the ADC map (D), the ADC value of the tumor was 0.88×10⁻³ mm2/s. ADC: Apparent diffusion coefficient.
A 59-year-old woman with hepatic neuroendocrine tumor (arrow). On gadoxetic-enhanced magnetic resonance imaging, the tumor shows hypointensity in the precontrast scan (A) and has an atypical (cholangiocarcinoma-like) enhancement pattern in the arterial phase (B). In the hepatobiliary phase (C), the tumor shows peritumoral enhancement in the hepatobiliary phase, which is equivalent to the right hepatic duct (arrowhead) (group 2). In the ADC map (D), the ADC value of the tumor was 0.58×10⁻³ mm2/s. ADC: Apparent diffusion coefficient.
Peritumoral intensity in the HBP and progression-free survival. Of 43 patients, 8 patients were classified as group 0, 17 patients were classified as group 1, and 18 patients were classified as group 2. Progression-free survival was significantly different among the three groups (p=0.040) (Figure 4). Patients in group 2 showed significantly poorer progression-free survival than patients in group 0 (p=0.017). The disease-free survival rate was not significantly different between patients in group 0 and group 1, and between patients in group 1 and group 2.

Progression-free survival curves of the patients in the three groups. The progression-free survival was significantly different among the three lesion groups (p=0.040). Patients in group 2 showed significantly poorer progression-free survival than patients in group 0 (p=0.017).
Discussion
Peritumoral enhancement in the HBP of gadoxetic acid-enhanced MRI appears as a hyperintense rim surrounding the tumor (9, 11). Pathologically, peritumoral enhancement corresponds to peritumoral hyperplasia, defined as a rim of hyperplastic hepatocytes surrounding the tumor (9). Peritumoral hyperplasia is observed in hepatic tumors, such as NETs, HCCs, and gastrointestinal stromal tumors (GISTs) (9, 11, 12). There is no clear consensus on the pathogenesis of peritumoral hyperplasia. Regenerative changes of the hepatocytes induced by tumor compression is one of the potential causes of peritumoral hyperplasia (1). Tumors such as NETs, HCCs, and GISTs typically exhibit expansive growth unlike the infiltrative growth pattern of adenocarcinomas. The expansive growth can cause compression of the liver parenchyma and induce regenerative changes of hepatocytes, causing peritumoral enhancement.
In our study, hepatic NETs with greater degree of peritumoral enhancement were associated with lower ADC values. In addition, patients in group 2 showed significantly poorer progression-free survival than patients in group 0. In previous studies, NETs with low ADC values showed an association with higher tumor grade and poorer prognosis (10, 13, 14). Considering these results, in the present study, it can be said that hepatic NETs with greater peritumoral enhancement have greater malignant potential. It can be considered that NETs with greater malignant potential show more rapid expansive growth. We assume that the more rapid growth of NETs causes stronger compression of liver parenchyma, which in turn induces regenerative changes of hepatocytes and increases the degree of peritumoral enhancement. On the other hand, NETs with less malignant potential show less expansive growth and cause no or lower degree of peritumoral enhancement.
Additionally, in the present study, the frequency of arterial enhancement pattern was significantly different between the 3 lesion groups. Atypical (cholangiocarcinoma-like) enhancement pattern in the arterial phase was significantly more frequently observed in group 2 tumors. In a previous study, NETs that exhibited atypical (cholangiocarcinoma-like) enhancement pattern had higher tumor grade (10). Therefore, this result supports our hypothesis that NETs with more malignant potential show greater degree of peritumoral enhancement. Hypervascular pattern, which is the most common pattern of hepatic NETs (10), was significantly more frequently observed in group 1 tumors. This result suggests that classic hepatic NETs commonly show peritumoral hyperintensity, which is typically hypointense compared to those of the bile duct. Hypovascular pattern was significantly more frequently observed in group 0. In previous studies, hypovascular NETs showed an association with early tumor progression (15) or higher tumor grade (16). However, in the present study, most of the patients (98.2%) had received some treatment (such as surgery, intervention, bio-therapy, systemic chemotherapy, or ablation) at the time of MRI. Although we did not evaluate lesions that exhibited apparent post-treatment changes (such as surgery, intervention or ablation), we believe hypovascular NETs in the present study were caused by tumor necrosis or hemorrhage induced by treatment. We hypothesize that the treatment effect may have reduced the aggressiveness of the tumor or caused less expansive growth leading to the lack of peritumoral enhancement.
Other possible mechanisms of peritumoral hyperintensity have been considered: 1) perfusion abnormalities due to vascular invasion of the tumor (9, 12) and 2) association of drainage flow (9). As for 1), considering the fact that the majority of the hepatic NETs are hematogeneous metastases, vascular invasion is common in hepatic NETs. For this reason, the presence of vascular invasion cannot explain our results. As for 2), we could evaluate drainage flow because the enhancement seen with gadoxetic acid was described as weak compared with that seen with the conventional extracellular contrast agents (17). However, Yoneda et al. reported that drainage flow from the tumor may not directly contribute to the formation of peritumoral hyperplasia in HCC (9). Therefore, we believe that the cause of peritumoral enhancement is mainly regenerative changes of the hepatocytes induced by tumor compression.
Some limitations of this study should be considered while interpreting our results. First, the evaluation of peritumoral hyperintensity was qualitative; quantitative evaluation was not performed. However, it is very difficult to accurately quantify peritumoral hyperintensity because of its small area. Additionally, the interobserver agreement between the two radiologists was excellent. Second, because patients with hepatic NETs are usually in advanced stage, most patients (98.2%) had received some treatment during their long clinical course. We cannot deny the effect of such treatment prior to MRI on our results. Third, the study population did not consist of consecutive patients because gadoxetic acid-enhanced MR imaging was not performed in all patients with hepatic NETs. Therefore, selection bias may have led to an overestimation of our results. Fourth, we could not evaluate the pathological findings because liver biopsy or resection was performed only for a limited number of patients. Further studies are required to identify the relationship between imaging and pathological features including tumor grade.
In conclusion, hepatic NETs with greater peritumoral hyperintensity in the HBP of gadoxetic acid-enhanced MR imaging have more malignant potential. Evaluation of peritumoral hyperintensity in the HBP of gadoxetic acid-enhanced MR imaging may help predict aggressive behavior of hepatic NETs.
Footnotes
Authors’ Contributions
NF: Conceptualization, methodology, formal analysis, investigation, data curation, writing, project administration. AH: methodology, investigation, data curation. JP: Writing – review & editing, supervision.
Conflicts of Interest
The Authors declare that they have no conflicts of interest in relation to this study.
- Received November 17, 2021.
- Revision received December 5, 2021.
- Accepted December 6, 2021.
- Copyright © 2022 International Institute of Anticancer Research (Dr. George J. Delinasios), All rights reserved.
References
In this issue


Jump to section
Related Articles
Cited By...
- No citing articles found.