


Abstract
Background/Aim: This study focused on the hybrid-volumetric modulated arc therapy (hVMAT) for stage I esophageal cancer and compared the effects on dose distribution induced by changes in the ratio of three-dimensional conformal radiotherapy (3DCRT) to VMAT. Patients and Methods: Fifteen patients who underwent 3DCRT for cT1bN0M0 esophageal cancer at Kanagawa Cancer Center from January 2014 to April 2019 were included in the study. The dose–volume histogram (DVH) parameters of the target volume and normal organs were evaluated in the 3DCRT, hVMAT, and VMAT treatment plans. Results: The homogeneity index of the target volume was significantly lower for hVMAT. In hVMAT, as the ratio of VMAT increased, the volume of low-dose region in the heart and lung increased, whereas the volume of the middle- to high-dose region decreased. As the ratio of VMAT increased, the mean dose in the heart decreased, whereas the mean dose in the lung increased. Conclusion: Favorable dose concentration was obtained for the target volume in hVMAT for stage I esophageal cancer. Altering the ratio of VMAT significantly changed the DVH parameters in normal organs.
Radiation therapy (RT) is one of the radical therapeutic modalities for stage I esophageal cancer. Indeed, favorable clinical outcomes have been reported for stage I esophageal cancer treated with RT (1). However, late toxicity becomes a problem in long-term survival cases after RT (2). Moreover, late toxicity to the heart and lungs after RT can be fatal (2-4). Hence, various radiation technologies have been developed to reduce the radiation dose in normal organs. Volumetric modulated arc therapy (VMAT) is one of such novel therapeutic technology.
Favorable dose distributions have been reported in intensity-modulated RT (IMRT), VMAT, and particle RT for esophageal cancer (5-7). The dose concentration in target volumes is favorable in IMRT and VMAT; however, low-/middle-dose regions are irradiated in surrounding normal organs (8). For the lung, V5, V20, and mean lung dose are the indices for pneumonitis (9-11). For the heart, V5 and V30 are predictive factors for survival (12). Therefore, in RT for esophageal cancer, low/middle doses in these normal organs were associated with late toxicities.
Hybrid-IMRT (hIMRT) was initiated to reduce the low/middle doses in the lung and heart (13). This is an irradiation technique in which three-dimensional conformal radiotherapy (3DCRT) and IMRT are simultaneously performed during one session of the radiation treatment. Initially, hIMRT was initiated for breast cancer (14) and was later reportedly applied to the esophagus and lung cancers (13, 15). VMAT could provide a shorter treatment time compared with IMRT; hybrid-VMAT (hVMAT), in which IMRT is replaced with VMAT, has been developed (8). In hIMRT and hVMAT therapeutic radiotherapy plans, 3DCRT and IMRT or VMAT plans were combined at various proportions. However, the optimal proportion for 3DCRT and IMRT or VMAT remains unclear. Therefore, in this study, we quantitatively compared the radiation dose distribution induced by changes in the 3DCRT to VMAT ratio in hVMAT plans for stage I esophageal cancer.
Patients and Methods
Patients. The hospital institutional review board approved this study (approval number: 2020-142). This study included patients who had undergone 3DCRT for cT1bN0M0 esophageal cancer at Kanagawa Cancer Center from January 2014 to April 2019. Because dose distribution to normal organs can be affected by the location of the tumor (7, 16), we included 15 recent cases, 5 each of upper thoracic (UT), mid-thoracic (MT), and lower thoracic (LT).
Treatment planning. Computed tomography images of 2.5-5 mm slices were performed under the free breathing state. Gross tumor volume (GTV) was identified using a clip placed endoscopically in advance. Clinical target volume (CTV) 1 included the following lymph node areas: UT comprised the upper clavicle and superior mediastinal lymph node areas, MT comprised the superior and inferior mediastinal and intraperitoneal lymph node areas, and LT comprised the inferior mediastinal and intraperitoneal lymph node areas. CTV2 was enlarged by 2 cm each from GTV along the long axis of the esophagus. Planning target volumes (PTV) 1 and 2 were extended by 5 mm in all directions from CTV1 and 2, respectively. The heart, lungs, and spinal cord were delineated as organs at risk (OAR). OARs were delineated according to the RTOG 1106 atlas (17). The same structure was used for 3DCRT, hVMAT, and VMAT planning.
The total dose was set at 50.4 Gy: 41.4 Gy for PTV1 and 9.0 Gy for PTV2. For the 3DCRT plan, an anteroposterior opposing portal beam was set at 41.4 Gy and an oblique beam was set at 9.0 Gy to exclude the spinal cord. 3DCRT was prescribed at the isocenter, and the plan was formulated to cover the CTV with at least 95% of the dose. The VMAT plans used two full arcs. VMAT was optimized using the simultaneous integrated boost method to administer 41.4 Gy to PTV1 and 50.4 Gy to PTV2, and was rescaled such that the mean dose (Dmean) was 50.4 Gy for PTV2. The calculation algorithm for 3DCRT was collapsed cone convolution and that for VMAT was the X-ray voxel Monte Carlo method. The dose constraints for OARs were as follows: The maximum dose for the spinal cord was 45 Gy and V20<20% for the lungs.
Monaco version 5.11 (Elekta AB, Stockholm, Sweden) was used to create therapeutic plans for 3DCRT and VMAT. All therapeutic plans were transferred to MIM maestro software version 6.9 (MIM Software Inc. Cleveland, OH, USA). Based on the 3DCRT therapeutic plan, the VMAT therapeutic plan was blended at proportions of 0%, 10%, 30%, 50%, 70%, 90%, and 100% to the 3DCRT plan by using the MIM maestro software. The respective treatment plans were named as 3DCRT, hVMAT 10%, hVMAT 30%, hVMAT 50%, hVMAT 70%, hVMAT 90%, and VMAT groups. Dose–volume histogram (DVH) parameters were compared between the therapeutic plan groups. We assessed the DVH parameters as follows: the dose covering 98% of the target volume (D98), D95, D50, D2, and the homogeneity index (HI) for PTVs. HI was calculated using (D2 − D98)/D50 (18). V5, V10, V20, V30, V40, V50, and D mean for the heart and lungs and maximum dose (Dmax) for the spinal cord were estimated as DVH parameters for OARs.
Statistical analysis. DVH parameters for each therapeutic plan were compared using the Wilcoxon matched-pairs test. A p-value of <0.05 was considered statistically significant. Statistical analysis was performed using STATA software (version 13.1, College Station, TX, USA).
Results
PTV. Figure 1 shows the representative dose distribution and DVH of the 3DCRT, hVMAT, and VMAT. Figure 2A shows a boxplot for the HI of PTV1. The HI of PTV1 significantly differed among the treatment groups, except between the hVMAT 70% and hVMAT 90% groups. The HI of PTV1 was smallest in the hVMAT 70% and hVMAT 90% groups (median values: 0.22±0.02 and 0.22±0.01, respectively).

Comparison of representative dose distributions. 41.4 Gy was administered to planning target volume (PTV)1 and 50.4 Gy was administered to PTV2. A) Dose distributions of three-dimensional conformal radiotherapy (3DCRT), hybrid-volumetric modulated arc therapy (h-VMAT) 50%, and VMAT. B) Dose-volume hidtogram (DVH) of 3DCRT, hVMAT 50%, and VMAT.

Comparison of homogeneity index (HI) in each therapeutic plan. The boxplot shows HI in each therapeutic plan. A) HI of planning target volume (PTV)1. Low values were noted in the hybrid-volumetric modulated arc therapy (h-VMAT) 70% and 90% groups. B) HI of PTV2. Low values were noted in the hVMAT 30%, 50%, and 70% groups.
Figure 2B shows a boxplot for the HI of PTV2. The HI of PTV2 significantly differed among the treatment groups, except between the hVMAT 30% and hVMAT 50% groups and between the hVMAT 50% and hVMAT 70% groups. The HI of PVT2 was smallest in the hVMAT 30%, 50%, and 70% groups (median values: 0.05±0.01, 0.05±0.01, and 0.05±0.01, respectively).
OAR. Figure 3A shows the median values for V5, V10, V20, V30, V40, and V50 of the heart in each therapeutic plan. V5 of the heart exhibited significant differences among all groups and increased as the ratio of VMAT increased. V10 exhibited significant differences among all groups, excluding between the hVMAT 90% and VMAT groups. V10 increased as the ratio of VMAT increased. V20 exhibited significant differences between the hVMAT 70% and hVMAT 90% groups and between the hVMAT 90% and VMAT groups (p=0.0026 and 0.0007, respectively); however, no significant differences were noted among the other groups. V30 and V40 exhibited significant differences among all groups. As the ratio of VMAT increased, V30 and V40 decreased. Although V50 exhibited significant differences between the 3DCRT and hVMAT 10% groups (p=0.0018), no significant differences were observed among the other groups.

Comparison of heart dose-volume histogram (DVH) parameters in each therapeutic plan. A) Median heart DVH values in each therapeutic plan. B) Mean dose (Dmean) in the heart in each therapeutic plan. As the proportion of hybrid-volumetric modulated arc therapy (VMAT) increased, Dmean in the heart significantly decreased.
Figure 3B shows a boxplot of Dmean of the heart for each therapeutic plan. The mean values for Dmean of the heart were 29.1±11.7, 28.8±11.4, 27.6±10.8, 26.4±10.2, 24.5±9.7, 22.5±9.2, and 22.3±8.9 Gy in the 3DCRT, hVMAT 10%, hVMAT 30%, hVMAT 50%, hVMAT 70%, hVMAT 90%, and VMAT groups, respectively. Significant differences were observed among all groups. The Dmean of the heart significantly decreased as the ratio of VMAT increased.
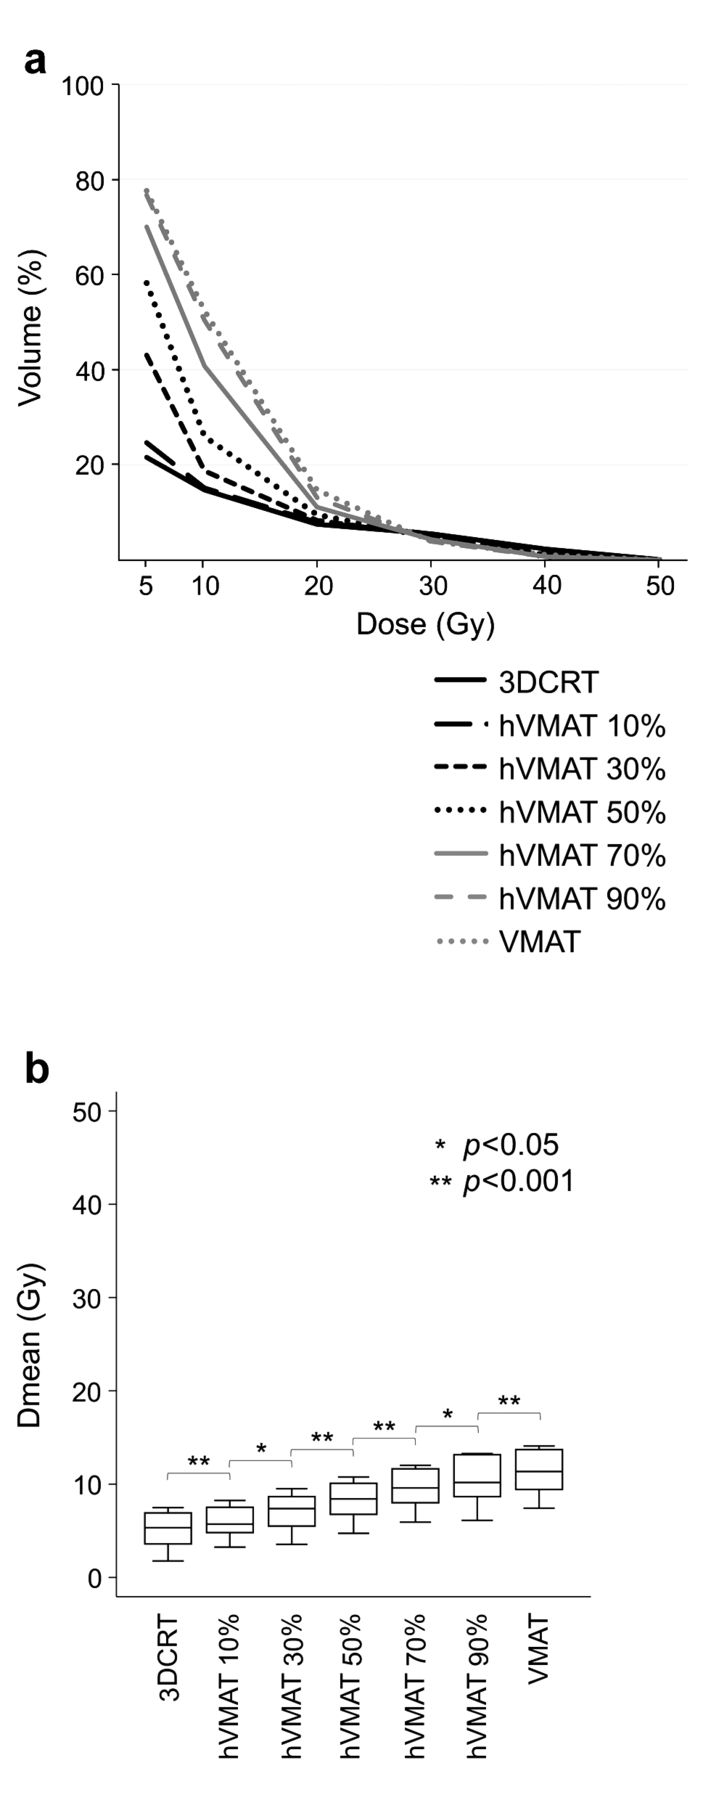
Figure 4A shows the median values for V5, V10, V20, V30, V40, and V50 of the lungs in each therapeutic plan. V5, V10, and V20 of the lungs exhibited significant differences in all therapeutic plans. As the ratio of VMAT increased, V5, V10, and V20 increased. V30 exhibited significant differences in all groups, excluding between the hVMAT 90% and VMAT groups. V40 exhibited significant differences in all groups, except between the hVMAT 50% and hVMAT 70% groups. As the ratio of VMAT increased, V30 and V40 slightly decreased. Although V50 exhibited significant differences between the 3DCRT and hVMAT 10% groups (p=0.0006), no significant differences were observed among the other groups.

Comparison of lung dose-volume histogram (DVH) parameters in each therapeutic plan. A) Median lung DVH values in each therapeutic plan. B) Mean dose (Dmean) in the heart in each therapeutic plan. As the proportion of volumetric modulated arc therapy (VMAT) increased, Dmean in the lung significantly decreased.
Figure 4B shows a boxplot for Dmean of the lungs for each therapeutic plan. The median values for Dmean of the lungs were 5.3±1.7, 5.7±1.6, 7.4±1.9, 8.4±2.0, 9.6±2.1, 10.2±2.4, and 11.4±2.3 Gy in the 3DCRT, hVMAT 10%, hVMAT 30%, hVMAT 50%, hVMAT 70%, hVMAT 90%, and VMAT groups. Significant differences were observed among all groups. The Dmean of the lungs significantly increased as the ratio of VMAT increased.
Figure 5 shows a boxplot for Dmax of the spinal cord in each therapeutic plan. The maximum dose exhibited significant differences in all groups, except between the hVMAT 90% and VMAT groups. The Dmax of the spinal cord slightly decreased as the ratio of VMAT increased.
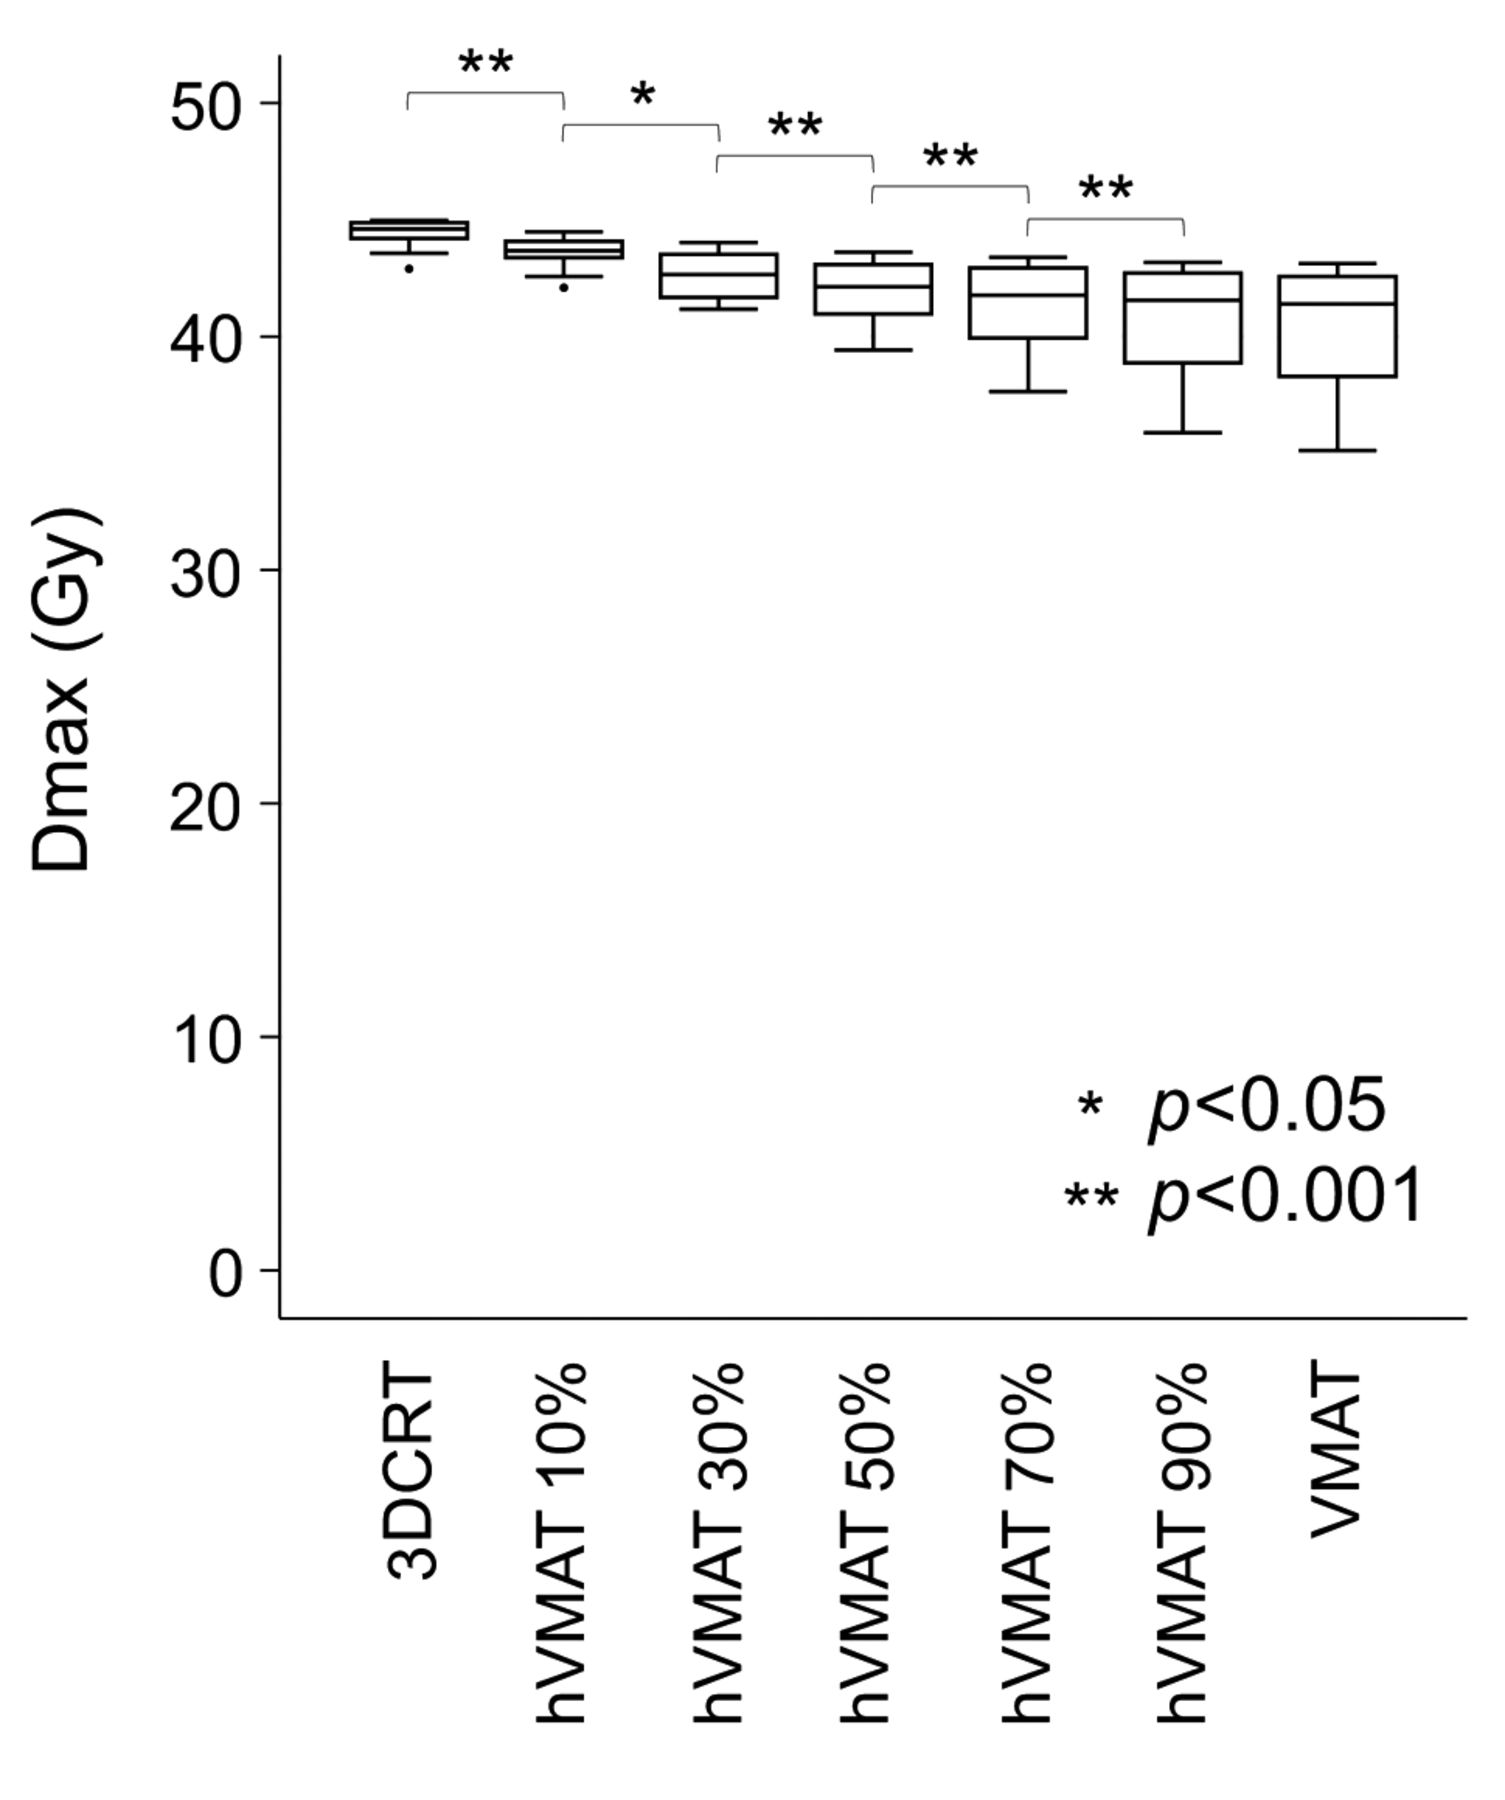
Comparison of maximum dose (Dmax) in the spinal cord in each therapeutic plan. Except for the hybrid-volumetric modulated arc therapy (h-VMAT) 90% and VMAT groups, Dmax in the spinal cord significantly decreased as the proportion of VMAT increased.
Discussion
Dose distributions in 3DCRT, hVMAT, and VMAT plans for cT1bN0M0 esophageal cancer were assessed in this study. The HI of hVMAT was significantly lower than that of 3DCRT and VMAT. The low-dose regions in the heart and lungs significantly increased as the ratio of VMAT increased in the hVMAT therapeutic plan. Dmean of the heart decreased as the ratio of VMAT increased, whereas Dmean of the lungs increased as the ratio of VMAT increased. To the best of our knowledge, this is the first report on dose distributions induced by changes in the 3DCRT to VMAT ratio in hVMAT plans for stage I esophageal cancer.
HI was lower in the hVMAT group in the present study. Lower HI treatment plans can deliver a more uniform dose to the target volume with less difference between the high and low doses (19). In RT for esophageal cancer, the dose in the target volume may decrease depending on the difference in the electronic density when X-rays are administered to a proximate lung. Therefore, it may be difficult to ensure the homogeneity of dosage within the target volume. The results of this study suggest that hVMAT administers doses more homogenously even for such thoracic lesions. This study suggests that the ratio of VMAT should be maintained at 30%-70% in hVMAT to administer a homogenous dose to the target volume.
Cardiac and pulmonary toxicities are important in RT for esophageal cancer. These late toxicities could be fatal (2-4). Excessive amounts of radiation doses to the heart and lungs influence late toxicities. Reports of a phase III study for non–small-cell lung cancer have shown that V5 and V30 in the heart were significant negative factors for survival (12). Xiang et al. reported that V30 of <46% and Dmean of <26 Gy were related to the retention of cardiac effusion after chemoradiation therapy for esophageal cancer (20). Shirai et al. reported that V50 of >20% is a risk factor for the retention of pleural effusion in RT for esophageal cancer (16). Pao et al. demonstrated that V30 of >33% and Dmean of >20 Gy significantly correlated with all grades of cardiac effusion in IMRT for esophageal cancer (21). In their study, V30 of >65% and V40 of >55% were significant predictive factors of grade 3 or more cardiac effusion. The present study has demonstrated that increasing the ratio of VMAT in the hVMAT therapeutic plan increased the low-dose region in the heart and decreased the mid- to high-dose regions and Dmean. Considering the aforementioned V30 and the restriction of Dmean in the heart, it was suggested that the ratio of VMAT in hVMAT should preferably be ≥50%.
Grahm et al. firstly reported that pneumonitis was significantly correlated with V20 of the lungs (10). To prevent serious radiation pneumonitis in RT for lung cancer, it was recommended that V20 be maintained below 30%-35% (11). Asakura et al. reported that V20 of >37% is a risk factor for radiation pneumonitis in RT for esophageal cancer (22). Moreover, Dmean in the lungs was reported to be corelated with pneumonitis, with Dmean levels of 20-23 Gy recommended (21). Yorke et al. reported that rather than Dmean and V20, low doses such as V5, V10, and V13 were more closely correlated with the onset of radiation pneumonitis (23). Regarding V5, Jo et al. reported that V5 of >65% is a risk factor for pneumonitis in RT for lung lesions (24). Tucker et al. reported that V5 and Dmean of the lung were risk factors for radiation pneumonitis in RT for esophageal cancer (9). Despite exhibiting a high-dose concentration in the target volume, IMRT or VMAT irradiates low doses to the surrounding normal lung areas (25). This study has demonstrated that increasing the ratio of VMAT increases low-dose regions and MLD in the lungs. In each of the therapeutic plans, the levels of V20 and Dmean were lower than those reported in previous studies; however, V5 of the lungs increased as the ratio of VMAT increased. Considering V5 of the lungs, it was suggested that the ratio of VMAT in hVMAT should preferably be ≤70%.
A lower dose to the spinal cord was also shown by hVMAT for esophageal cancer (8). A similar result was obtained in this study. In hVMAT, increasing the ratio of VMAT slightly reduced the doses in the spinal cord. If spinal cord disorder occurs, it considerably worsens the quality of life. Treatment with hVMAT can be safer than that with 3DCRT.
There have been no previous reports on hIMRT and hVMAT that examined the optimal proportion for 3DCRT and IMRT or VMAT. Various proportions of IMRT or VMAT were used in hIMRT or hVMAT in previous studies. For lung cancer and esophageal cancer, hIMRT was performed at 3DCRT 1.2 Gy and IMRT 0.6 Gy (13). In another report on hIMRT for lung cancer, the proportion of IMRT was 40% (26). In a report on hVMAT for esophageal cancer, the proportion of VMAT was 50% (8). In this study, the preferable proportion of VMAT in hVMAT for esophageal cancer was considered to be 50%-70%. Further research is necessary to determine the optimal proportion for each disease.
There are several limitations to this study. The number of cases was small, and respiratory displacement was not considered. Regarding respiratory displacement, it has been reported that dose errors can be reduced by using hVMAT technique (13). In actual treatment, evaluation of respiratory displacement, such as 4DCT, is also required.
Conclusion
This study compared dose distributions in hVMAT for stage I esophageal cancer. Considering the dose concentration to the target volume and dose distribution to the OARs, we concluded that the preferable proportion of VMAT in hVMAT should be 50%-70%.
Footnotes
Authors’ Contributions
YT collected and analyzed the data and drafted the manuscript. DY, HK, T Kamada, and KS analyzed the data and contributed to the final draft of the manuscript. KK, WA and KT collected and analyzed the data of 3DCRT. T Kusunoki and TE collected and analyzed the data of hVMAT and VMAT. NM and IS aided in writing the manuscript and contributed to the final draft of the manuscript. All Authors read and approved the final manuscript.
This article is freely accessible online.
Conflicts of Interest
Dr. Hiroyuki Katoh, Dr. Daisaku Yoshida, and Dr. Shinichi Minohara received research funding from Toshiba Energy Systems and Solutions Corporation.
- Received February 5, 2021.
- Revision received March 4, 2021.
- Accepted March 5, 2021.
This is an open access article distributed under the CC BY license (https://creativecommons.org/licenses/by/4.0/).


