


Abstract
Aim: To compare the diagnostic value of liver perfusion computed tomography (PCT) and biphasic contrast-enhanced CT (bpCECT) for detection and characterization of hepatocellular carcinoma (HCC), and to identify potential causes for inter-modal discrepancies. Patients and Methods: In this retrospective study, 162 cases with a total of 325 HCC-typical lesions were evaluated using both PCT and bpCECT (mean time between examinations=15 days, range=0-13 days). HCC diagnosis was performed by multi-modality imaging including lesion growth at follow-up. For PCT, a total acquisition time of 40 s (26 measurements) each 1.5 s using 80 kV and 100 mAs, as well as 50 ml iodine contrast agent (at 5 ml/s) covering the entire liver was used. Mean arterial liver perfusion (ALP), portal venous perfusion (PVP) and hepatic arterial index (HPI) for both tumor and non-involved liver parenchyma; mean blood flow, blood volume and k-trans for tumor were quantified. Tumor localization, and size were registered. bpCECT consisted of unenhanced, arterial (30-33 s delay), and portal-venous (70-75 s) phases performed using 120 kV, 200-250 mAs, thin-slice reformates (<1 mm), 100 ml contrast agent (at 3 ml/s) followed by 50 ml saline flush. Finally, we divided the results according to detection by PCT only (i.e. missed by pbCECT), and by both PCT and pbCECT. Results: PCT detected 272 lesions compared to 217 with bpCECT only. HCCs in liver segments 4 and 5 were significantly better detected by PCT (p<0.005). Furthermore, PCT detected significantly smaller HCCs than did bpCECT (p<0.001). Lesions detected by both methods had significantly higher mean ALP (p=0.03) and HPI (p=0.02), and lower mean PVP (p=0.01). Tumor blood flow, blood volume and k-trans proved not to be significant for lesion detection. The mean ALP, HPI, and PVP in inconspicuous cirrhotic liver were also not significant for lesion detection. The PVP(tumor)/HPI(liver) ratio of detected lesions was significantly higher for PCT alone (p=0.04). Pretreated, still vital lesions were better detected by bpCECT. Conclusion: Detection of smaller HCC lesions, lesions located in liver segments 4 and 5, as well as lesions presenting lower ALP and HPI, and higher PVP(tumor)/HPI(liver) ratio was better using both methods, emphasizing the important role of PCT.
- Contrast-enhanced computed tomography
- CECT
- perfusion CT
- PCT
- hepatocellular carcinoma
- HCC
- oncological imaging
Screening of the liver for early detection of hepatocellular carcinoma (HCC) in patients with liver cirrhosis using cross-sectional imaging is indicated by current diagnostic guidelines (1). Different techniques have been described for HCC screening purposes. However, due to the currently accepted enhancement patterns considered typical for HCC early contrast wash-in and early contrast wash-out multiphasic contrast studies have gained major attention and became broadly recommended (2). Computed tomography (CT) and magnetic resonance imaging are the most frequently applied imaging techniques, each presenting inherent strengths and weaknesses (3, 4). In the past decade, perfusion-CT (PCT) has advanced to a more sensitive imaging technique compared to multiphase-CT as it enables quantification of blood supply for both tumor and liver using a separate assessment of the arterial and portal-venous blood supply (5, 6). This technique increases the sensitivity of CT scans for detecting HCC-suspicious liver lesions as it measures the arterial contribution to the tumor blood supply on the background of non-involved liver parenchyma, which generally exhibits a consistently lower level of arterialization (7). Hence, liver masses can not only be better detected, but also characterized in terms of the magnitude of blood flow (BF), blood volume (BV), vessel wall permeability (k-trans) and in particular with respect to the degree of arterial versus portal-venous vascular supply. The latter reflects differences in the mix (arterial±portal-venous) of blood supply between HCC, dysplastic nodules, and regenerative nodules (8). The enhanced tumor-to-liver contrast generated by arterial liver perfusion (ALP) or hepatic perfusion (HPI) color-coded maps is essential for lesion detection, also enabling the depiction of smaller (<10 mm) lesions (6, 7). Previous comparative studies between biphasic or triphasic contrast-enhanced-CT and PCT have underlined the superiority of the latter (9, 10). Major limitations of two-to-four-phase enhancement protocols are in part patient-related (overweight, incompliance, very dense liver parenchyma), tumor-dependent (low level of arterial supply, low BF and BV, smaller size, unfavorable localization e.g. close to the dome or liver edges, increased arterial supply of the cirrhotic liver with lesser tumor-to-liver contrast) and technique-related (low contrast agent concentration and volume, inadequate delay time, low energy protocol with consequently increased noise).
The reason for the better detectability of HCCs by PCT also lies in the nature of PCT, as it consists of one unenhanced phase and up to 25 repeated arterial phases. In this way, the choice of optimal delay time becomes negligible. The use of ALP, HPI, BF and BV maps also more efficiently highlights differences in contrast kinetics between liver and tumor. Moreover, maximum-intensity projection image quality is better than that with standard CT protocols despite the low-dose technique as all 26 images of the series are all summed.
Hence, the intention of this study was to try to understand why some HCCs are missed by biphasic contrast-enhanced-CT (bpCECT) whereas others are not using both morphological and perfusion-based imaging criteria.
Patients and Methods
An Institutional Review Board-approved Healthcare Insurance Portability and Accountability Act compliant retrospective study was performed.
A database query using the Radiology Department Information System was performed to select all patients undergoing PCT between April 2010 and January 2019.
The inclusion criteria for this study were: i) The presence of cirrhosis with either histologically confirmed HCC (n=67) or guideline-compliant imaging features of (n=95) liver mass indicative of HCC. This included tumor growth or alternatively the reappearance of HCC-typical liver lesions (1, 2). ii). Only technically comparable bpCECT studies underwent final analysis i.e. those with thin-slice reformats (<1 mm), same volume of iodine agent (100 ml), flow (3 ml/s) and concentration (350-370 mg iodine/ml) of contrast medium and comparable delay times. Patients without additional bpCECT imaging performed up to 15 days before or after PCT were excluded
We analyzed 162 cases consisting of 87 cirrhotic patients with 325 lesions in total (mean age=65 years, range=37-82 years; 75 male). Some of these lesions n=182 (56%) were targets of prior local therapies, namely transarterial chemoembolization (TACE) in 125 (38.5%), radiofrequency ablation in 43 (13%), percutaneous ethanol injection in nine (3%) and selective internal radiation therapy in five (1.5%) cases.
All patients had CT-morphological sings of liver cirrhosis. The underlying cause of cirrhosis was hepatitis C virus infection in 19; hepatitis B virus infection in seven; alcohol abuse in 28; combined viral hepatitis and alcohol abuse in five; cryptogenic cirrhosis in 21; non-alcoholic steatosis hepatitis in four and hemochromatosis in three cases.
bpCECT imaging technique and analysis. bpCECT examinations were performed on three different scanners (Somatom Definition Flash, Force and AS+, Siemens Healthcare, Forchheim, Germany) using 120 kV and 200-250 mAs. Contrast agent Ultravist 370 (Bayer Vital GmbH, Leverkusen, Germany) or Imeron 350 (Bracco Imaging GmbH, Konstanz, Germany) was administered intravenously (100 ml) at a flow rate of 3 ml/s and followed by a 50 ml saline flush. The protocol consisted of unenhanced, arterial (30-33 s delay), and portal-venous (70-75 s) phase acquisition.
PCT imaging technique. PCT examinations were performed on a 128-slice CT scanner (Somatom Definition Flash or Force, Siemens Healthcare, Forchheim, Germany). The protocol consisted of a non-enhanced abdominal low-dose CT which was obtained to localize the portal vein. Subsequently, a scan range between 11.4-17.6 cm z-axis coverage was planned over the involved liver, followed by PCT of the tumor using an adaptive spiral scanning technique. Perfusion parameters were: 80 kV, 100 mAs [120 mAs in obese patients (>85 kg body weight)], collimation 64×0.6 mm with z-flying focal spot and 26 CT repeated scans of the entire liver tumor within a total scan time of 40 s (1.5 s temporal resolution). The effective dose for liver perfusion measurements was 9-14 mSv. During the scan, patients were asked to resume shallow breathing for the entire duration of the study. Fifty milliliters of Ultravist 370 (Bayer Vital, Leverkusen, Germany) or Imeron 350 (Bracco Imaging, Konstanz, Germany) were injected at a flow rate of 5 ml/s in an antecubital vein followed by a saline flush of 50 ml NaCl at 5 ml/s, and a start delay determined by a test bolus using 7 ml contrast agent. The raw PCT data (axial images with slice thickness of 1 mm) were reconstructed without overlap, using a smooth tissue convolution kernel (B10f). All images were analyzed with the Department’s clinically used post-processing software (syngo.via; Siemens Healthcare).
Quantitative measurements with PCT. Syngo.via Volume Perfusion CT Body was used for subsequent motion correction, noise reduction, and threshold-based exclusion of bone, fat, and air. The following steps were performed by a radiologist with 3 years of experience in the field of abdominal imaging: A region of interest (ROI) was drawn at the maximal lesion outline. The following perfusion parameters were determined for all lesions: blood flow (BF; ml/100 ml/min), blood volume (BV; ml/100 ml), k-trans (ml/100 ml/min), arterial liver perfusion (ALP; ml/100 ml/min), portal venous perfusion (PVP; ml/100 ml/min), and hepatic perfusion index (HPI; %). Subsequently, another larger ROI was set apart from the tumor in a non-involved parenchymal area for quantification of ALP, PVP, and HPI in the cirrhotic liver. BF, BV, and k-trans (PMB, vessel wall permeability) were calculated using a maximum slope model for BF and a deconvolution model for BV and k-trans. The calculation of ALP and PVP was carried out considering the dual blood supply of the liver by the hepatic artery and the portal vein. Therefore, we used the time of peak splenic enhancement as a separation point of arterial and portal-venous phase with ROIs in the portal vein and spleen. The arterial time– density curve for ALP was calculated by dividing the maximum arterial slope by the maximum aortic enhancement. Portal-venous time–density curve for PVP was calculated by dividing the maximum portal-venous slope by the maximum portal-vein enhancement. HPI represents the quotient of ALP divided by the sum of ALP and PVP.
Standards of reference. Standards of reference were follow-up imaging studies (CT, magnetic resonance imaging) confirming the presence of the referred liver lesions.
Statistical analysis. In order to analyze our data set, results were assigned to one of the following two groups i): bpCECT-negative, results (lesions missed by bpCECT) and ii): concordant results, i.e. those found by both PCT and bpCECT. For continuous variables, Student’s t-test or Mann–Whitney U-test was used. Chi-squared or Fisher’s exact test was used for categorical variables. Each discrepancy between the results of these two imaging techniques was further evaluated by examining the area under the receiver operating characteristics curve using a confidence interval of 95%. For the calculation of the odds ratios, specific cut-off values were determined using Youden’s J-statistic. All statistical tests were considered statistically significant when the p-value was below 0.05. Statistical analysis was performed using SigmaStat, version 21 (SPSS, Chicago, IL, USA), and GraphPadPrism v.8.4.0 (GraphPad, San Diego, CA, USA).
Results
Overall PCT detected 272 lesions compared to 217 detected by bpCECT only.
Tumor localization and tumor size challenges the detection of HCC lesions via bpCECT. In a first step, we comparatively analyzed the group in which only one imaging technique (PCT) was able to detect HCC lesions and cases where results of both imaging techniques (bpCECT and PCT) matched regarding tumor localization. As shown in Figure 1A, the frequency of HCC lesions detected in liver segments 4 and 5 was significantly higher in those detected by PCT alone. However, in liver segments 2, 3, 6 and 7, HCC detection was equivalent.

Influence of clinical parameters in hepatocellular carcinoma detection via perfusion computed tomography (PCT) and biphasic contrast-enhanced CT (bpCECT) imaging. A: Distribution of tumor localization. B: Calculated tumor volume. C: Number of cases according to treatment regime. Lesions detected were assigned into one of two groups: Group 1: bpCECT-negative results (lesions missed by bpCECT, found by PCT only); Group 2: results concordant between PCT and bpCECT. RFA: Radiofrequency ablation; SIRT: selective internal radiation therapy; TACE: transarterial chemoembolization.
Regarding the tumor size (Figure 1B), HCC lesions detected only by PCT were significantly smaller compared to those detected by both methods [20 (95% confidence intervaI (CI)=10-60) and 30 (95% CI=10-150) mm, p<0.001, respectively].
Next, we comparatively analyzed the relative number of TACE, radiofrequency ablation and selective internal radiation therapy in both cohorts. Here we found significantly more patients underwent TACE in the group whose lesions were detected by both methods compared to those only detected by PCT (Figure 1C, p=0.019). Since an equal distribution of cases having undergone TACE in both groups was assumed, we might speculate here that in patients with TACE, pbCECT is less effective in detecting HCC lesions.
Quantitative perfusion parameters analyzed via PCT identify tumor characteristics challenging in HCC detection via bpCECT. To better understand why some HCCs were missed by bpCECT, functional (perfusion-based) HCC and liver parenchymal imaging characteristics were analyzed in a second step. As shown in Figure 2A-C, Lesions detected by both methods had significantly higher mean ALP (p=0.031) and HPI (p=0.018), and lower mean PVP (p=0.021). In the HCC lesions, a significant negative correlation between ALP and PVP was observed (Figure 2D, p=0.02). Regarding the HPI measured in HCC lesions, for those detected only by PCT, the percentage was lower (Figure 2C, p=0.018). ALP, PVP and HPI measured in the non-involved liver tissue did not differ significantly regardless of CT method (Figure 2A-C). In contrast to the ALP (target=HCC lesion) to HPI (liver) ratio (Figure 3A, p=0.559), the ratio of PVP in HCC and the HPI in normal liver tissue was significantly higher in lesions detected only by PCT (p=0.04, Figure 3B). Additionally, PVP in HCC lesions correlated negatively with the HPI in liver tissue (p=0.04, Figure 3C). The mean ALP, HPI, and PVP in inconspicuous cirrhotic liver did not correlate significantly with lesion detection.
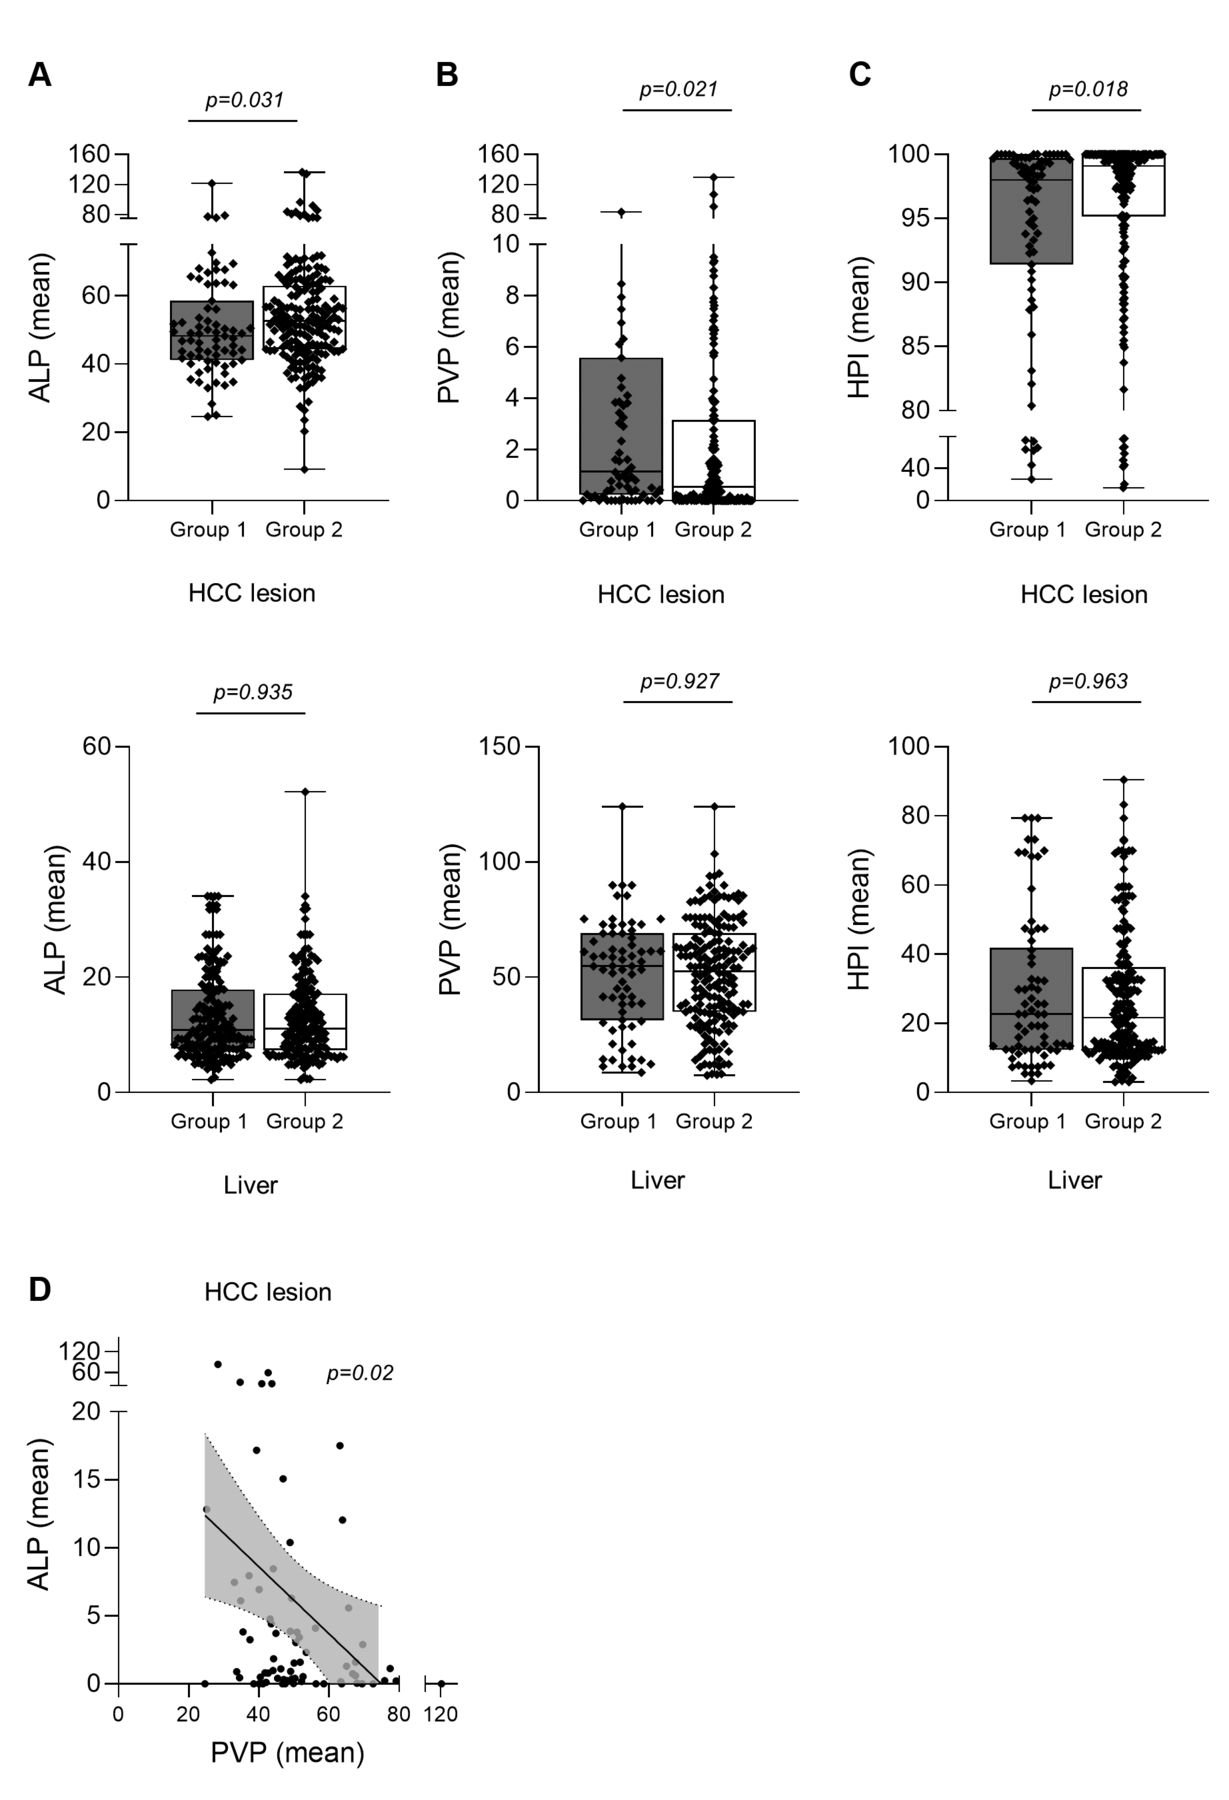
Quantitative perfusion parameters identifying tumor characteristics which are challenging in the detection of hepatocellular carcinoma (HCC) via biphasic contrast-enhanced computed tomography (bpCECT). A: Arterial liver perfusion (ALP, ml/100 ml), B: portal venous perfusion (PVP, ml/100 ml), and C: hepatic perfusion index (HPI) in HCC (upper panel) and background liver tissue (lower panel) according to detection of lesion by perfusion computed tomography (PCT) only (missed by bpCECT, group 1) or by both PCT and bpCECT (concordant results, group 2). D: Negative correlation between ALP and PVP in HCC lesions (R2=0.08).

Quantitative perfusion ratios according to detection of lesion by perfusion computed tomography (PCT) only [missed by biphasic contrast-enhanced computed tomography (bpCECT), group 1] or by both PCT and bpCECT (concordant results, group 2). A: Ratio of arterial liver perfusion (ALP, ml/100 ml) (target)/hepatic perfusion index [HPI(liver)]. B: Ratio of portal venous perfusion (PVP, ml/100 ml) (target)/hepatic perfusion index [HPI (liver)]. C: Correlation of PVP(target) and HPI(liver) in lesions. D: Odds ratios of missing HCC lesions by bpCECT according to the different clinical and imaging parameters identified as a challenge in HCC detection via bpCECT. RFA: radiofrequency ablation; TACE: transarterial chemoembolization.
Besides tumor volume (<35 mm) and HCC lesion located in liver segments 4 and 5, a PVP in the HCC lesion <0.18 ml/100 ml as well as HPI in the HCC lesion <99.5 displayed an odds ratio of ≥2 for missing HCC lesions by bpCECT (Figure 3D).
Quantitative perfusion parameters BV, BF and permeability (PMB or k-trans) are not suitable for identifying tumor characteristics challenging HCC detection by bpCECT. In addition, the quantitative perfusion parameters BF, BV and k-trans (PMB) in the HCC lesions in both groups were calculated. However, BF values were found to be comparable whether lesions were detected by PCT only or by both methods [124 (95% CI=62.4-232.4) vs. 127.4 (95% CI=66.58-215.2) ml/100 g, p=0.8, respectively]. Similarly, BV [12.41 (95% CI=5-31.1) vs. 14 (95% CI=5.9-28.7) ml/100 g, p=0.13] and k-trans [33.7 (95% CI=0.03-82) vs. 37.91 (95% CI=10.4-67.6) ml/100 g, p=0.14] showed no significant discriminative potential between lesion types.
Discussion
Our study demonstrates that a larger number of liver lesions compatible with HCC were identified by both methods compared to bpCECT alone. Analyzing the features of both groups of lesions, those that were equally diagnosed by PCT and bpCECT and those that were missed by the latter, helped in understanding some of the weaknesses and strengths of both imaging techniques. For this purpose, we first evaluated morphological and topographic lesion characteristics such as size and localization inside the liver. As expected, lesions detected by both methods were smaller compared to those detected by bpCECT, which in our opinion was due to the higher contrast between them and the liver parenchyma on generated color-coded maps displaying the ALP, PVP, and HPI. The preponderant arterial supply of HCC is in contrast to the predominantly portal-venous supply of the background liver parenchyma. This is also true in patients with liver cirrhosis developing portal hypertension and consecutively increased arterial supply to the liver parenchyma. But even in the case of a non-patent portal vein, other tumor characteristics such as increased BF or BV visualized by their corresponding color-coded maps have been demonstrated to be helpful for better delineation of tumors. Van Beers et al. calculated an arterial perfusion fraction in chronic liver diseases of approximately 41%, whereas the percentage of arterial HCC supply is expected to range between 80% and 100% (11, 12). Previous reports focusing on the detectability of smaller liver lesions by multiphasic-CECT already stressed this diagnostic challenge showing that up to 30% of liver lesions smaller than 3 cm in diameter proved isoattenuated relative to liver parenchyma in both the arterial and portal-venous phases (13-17). Moreover, in HCCs <10 mm in diameter, these authors found that only 52% were hyperattenuated in the arterial enhancement phase and hypoattenuated in the late portal-venous phase (wash-out). However, the diagnosis of smaller HCCs is important due to the increasing risk of vascular invasion when tumors exceed 2 cm in diameter (18). These findings underline the benefit of using PCT for the detection of smaller lesions. Using both bi- and triphasic-CECT protocols, Catalano et al. found no major difference in nodule detection between these two protocols (19).
Interestingly, among the different localizations of tumors inside the liver parenchyma, those located in liver segments 4 and 5 proved to be more frequently missed by bpCECT. The cause for this finding has not been determined yet. However, one explanation may be that liver segments 4a and b are known to be less homogeneous in attenuation and are located close to the major fissures, vessels and the gallbladder, which might make them less conspicuous. Furthermore, the degree of arterial supply of a hepatic lesion was shown to have a significant impact on its detectability. The reason for this phenomenon has already been addressed in this discussion and is related to the different magnitudes of the lesion perfusion characteristics. Hence, lesions detected by both methods had significantly higher ALP and HPI values and correspondingly lower PVP values. Previous reports emphasized the challenges related to the narrow time window for displaying both the wash-in and wash-out contrast dynamics searching for solutions suitable for optimization of the examinational protocols focusing on the delay time (peak tumor enhancement/peak liver enhancement, contrast agent concentration, volume, etc. (20, 21).
Interestingly, in our cohort, the same parameters ALP, PVP and HPI, measured in the non-involved liver parenchyma had no significant contribution to lesion detection directly. This probably reflects a certain degree of homogeneity of our cohort in terms of advanced cirrhotic liver changes. Nevertheless, combining some of these findings such as PVP(tumor)/HPI(liver) underlines the superiority of PCT for lesion detection even in the setting of less lesion-to-liver contrast as objectified by this ratio. Notably, PCT also yielded better detectability of previously treated (radiofrequency ablation, TACE, selective internal radiation therapy) HCCs compared to bpCECT. This is not surprising, as it is known that with all these local tumor treatment strategies, ALP may become heterogeneous due to a local misbalance between the arterial and portal-venous supply which activates the so-called hepatic arterial buffer system creating challenges for PCT (22).
Our study has some limitations. Firstly, we did not have histological proof for all patients. However, this study aimed to understand why PCT superiorly detects liver lesions irrespective of their histology, in the setting of chronic liver disease. Secondly, we tried to keep bpCECT examination protocols standardized despite using different scanner generations.
In conclusion, HCC-detection for smaller liver lesions, lesions located in the liver segments 4 and 5, lesions presenting lower ALP and HPI, and higher PVP(tumor)/HPI(liver) ratio as well as in pretreated lesions was better using both methods, emphasizing the important role of PCT.
Footnotes
This article is freely accessible online.
↵* These Authors contributed equally to this study.
Authors’ Contributions
Regine Mariette Perl: Methodology, Data curation, and writing – original draft. Johannes Portugall: Data curation, review and editing. Clemens Hinterleitner: Statistics, visualization, and writing. Martina Hinterleitner: Statistics, and visualization. Christopher Kloth: Data curation, review and editing. Sven Stephan Walter: Writing – review and editing. Michael Bitzer: Supervision, review and editing. Marius Stefan Horger: Methodology, supervision, writing – review and editing.
Conflicts of Interest
Marius Horger has received institutional research support from Siemens Healthineers Germany and GE USA. He is a scientific advisor of Siemens Healthineers Germany and has received speaker’s honorarium from Siemens Healthineers Germany and GE USA. For the remaining Authors none were declared.
- Received January 7, 2021.
- Revision received February 3, 2021.
- Accepted February 5, 2021.
- Copyright © 2021 International Institute of Anticancer Research (Dr. George J. Delinasios), All rights reserved.
References
In this issue


Jump to section
Related Articles
Cited By...
- No citing articles found.