


Article Figures & Data
Figures
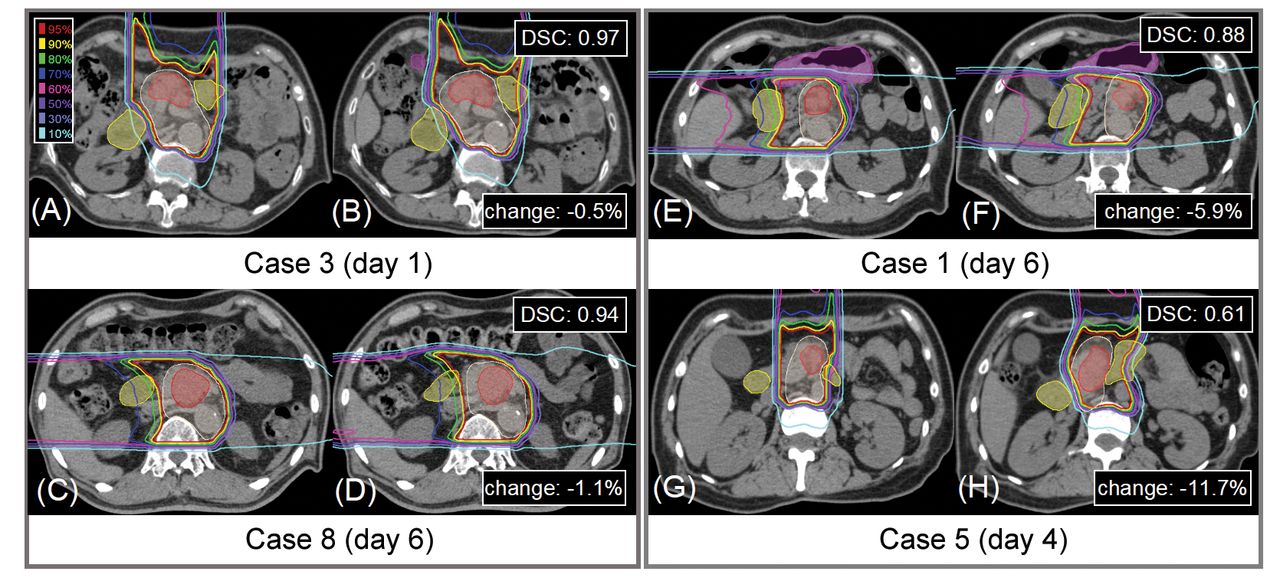
- Figure 1.
Example of dose distributions deformed via iDIR in four cases. The left panel in each column shows the dose distributions on one daily set of CT images (A, C, E, G), and the right panel shows the deformed doses via iDIR on planning CT images (B, D, F, H). The filled white, red, purple, and yellow show the clinical target volume (CTV), gross tumor volume (GTV), stomach, and duodenum, respectively. Change: Dose reduction in CTV receiving greater than 95% of the prescription dose (V95).
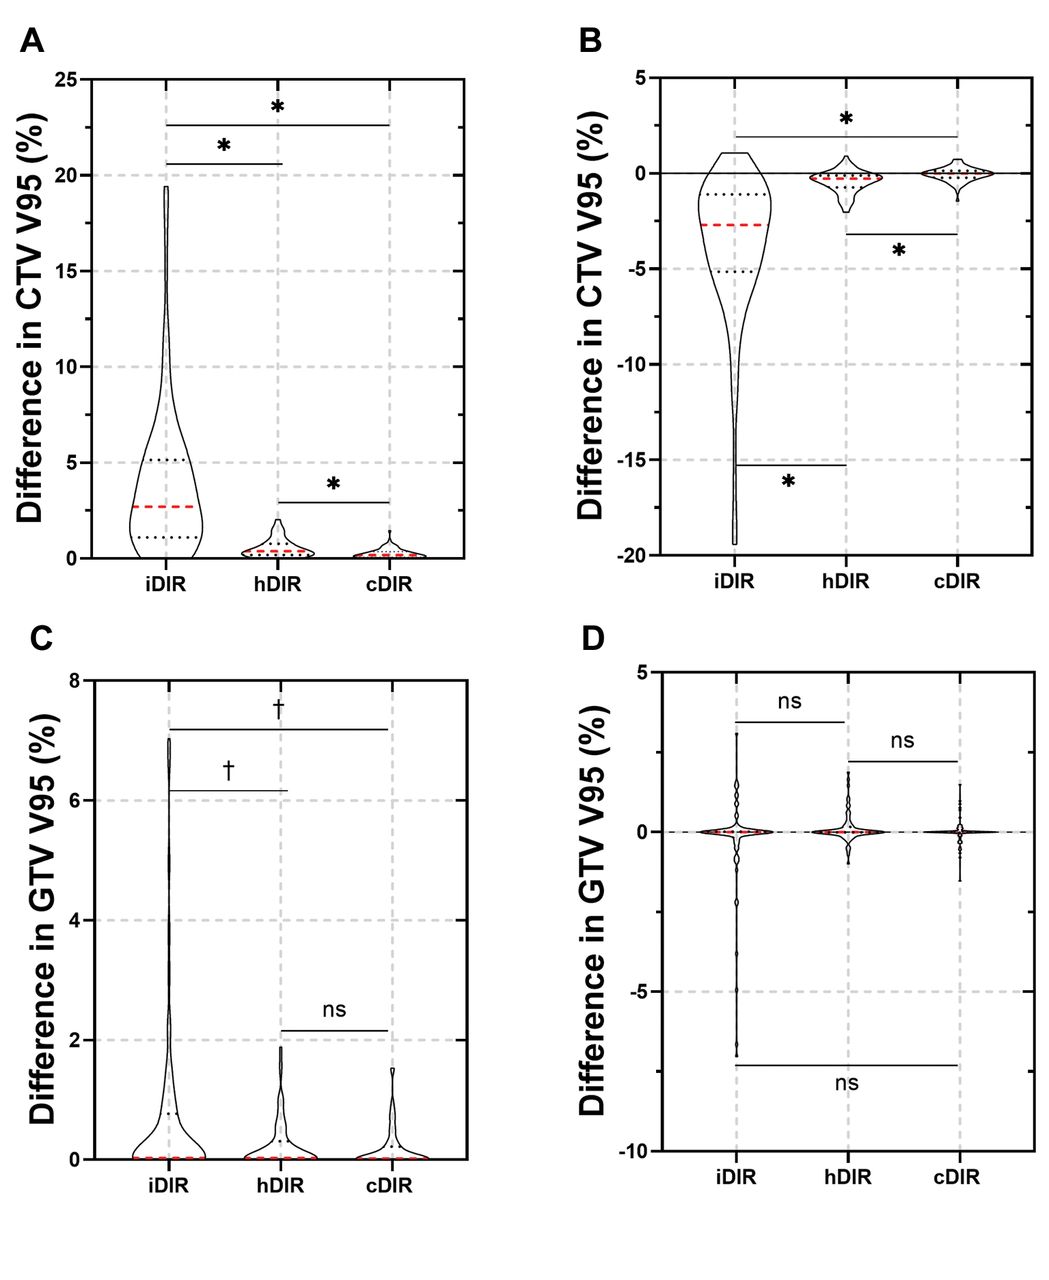
- Figure 2.
Violin plots for dosimetric difference in clinical target volume (CTV) and gross tumor volume (GTV) receiving greater than 95% of the prescription dose (V95). (A) and (C) show the absolute dose difference in CTV and GTV. The actual dose differences for CTV and GTV are shown in (B) and (D), respectively. The dotted red lines indicate the median dose changes, and the dotted black lines show the data at the 25th and 75th percentile. *p<0.0001; †p<0.05.
- Figure 3.
Dependence of dosimetric difference in clinical target volume (CTV) (A) and gross tumor volume (GTV) (B) on dice similarity coefficient (DSC).
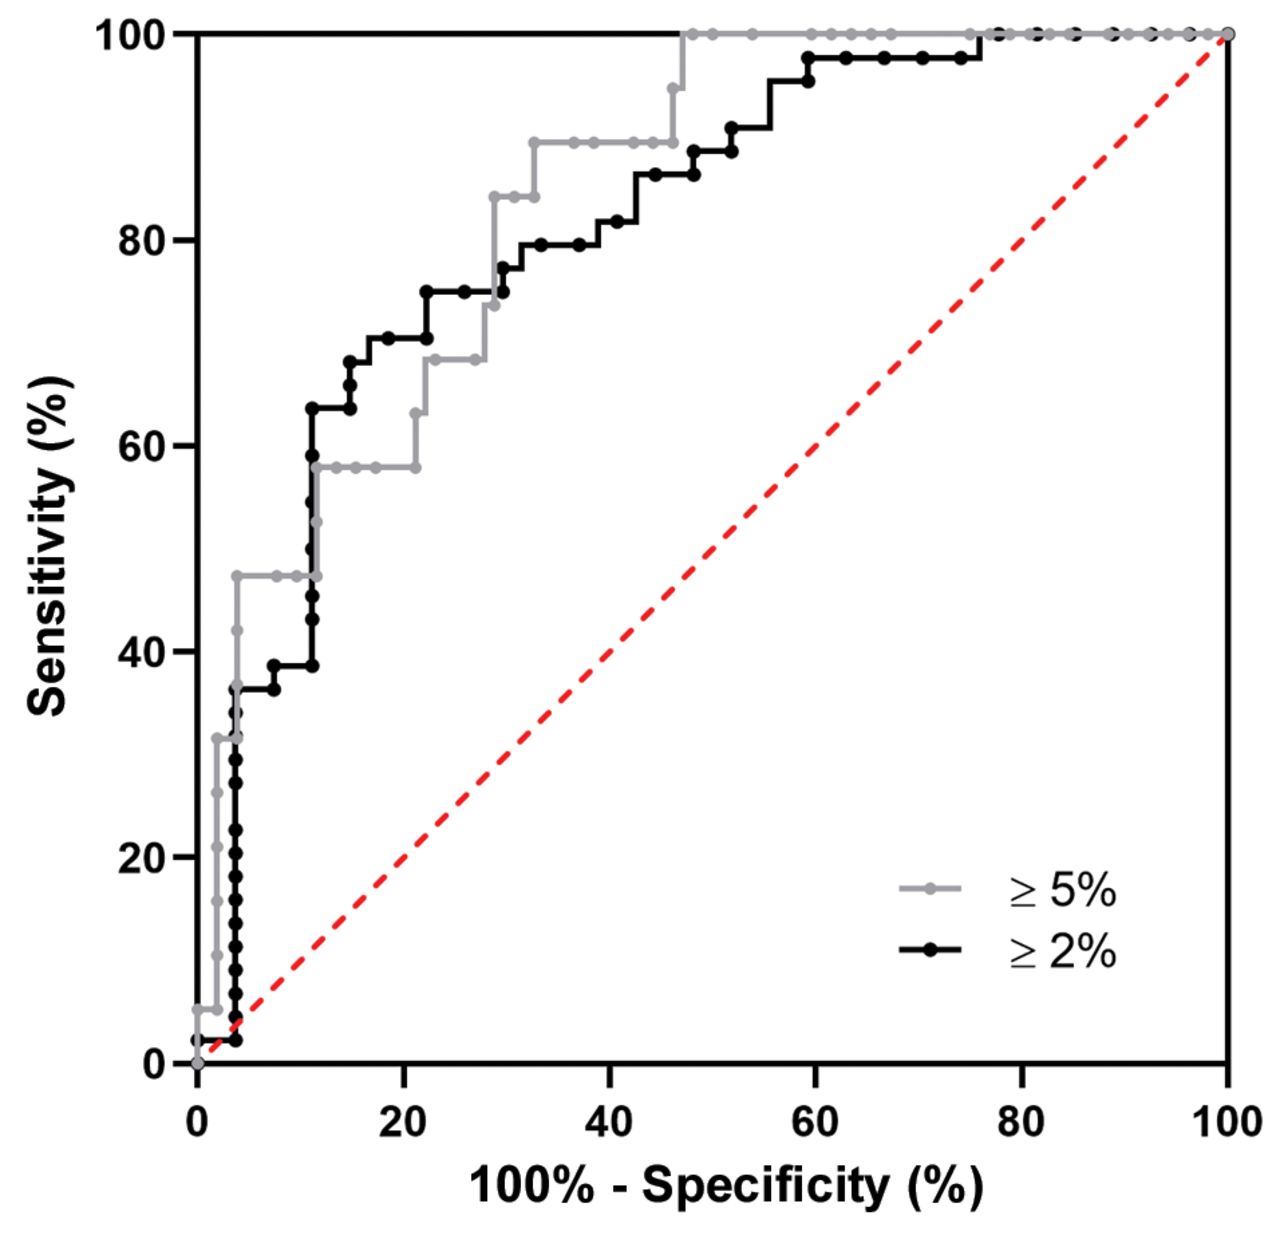
- Figure 4.
Receiver operating characteristic curves for dice similarity coefficients (DSCs) as predictors of dose differences for iDIR. The receiver operating characteristic curve for DSC with 2% (black line) and 5% (gray line) dose difference yielded an area under the curve of 0.817 and 0.843, respectively. These were statistically significant (p<0.0001).
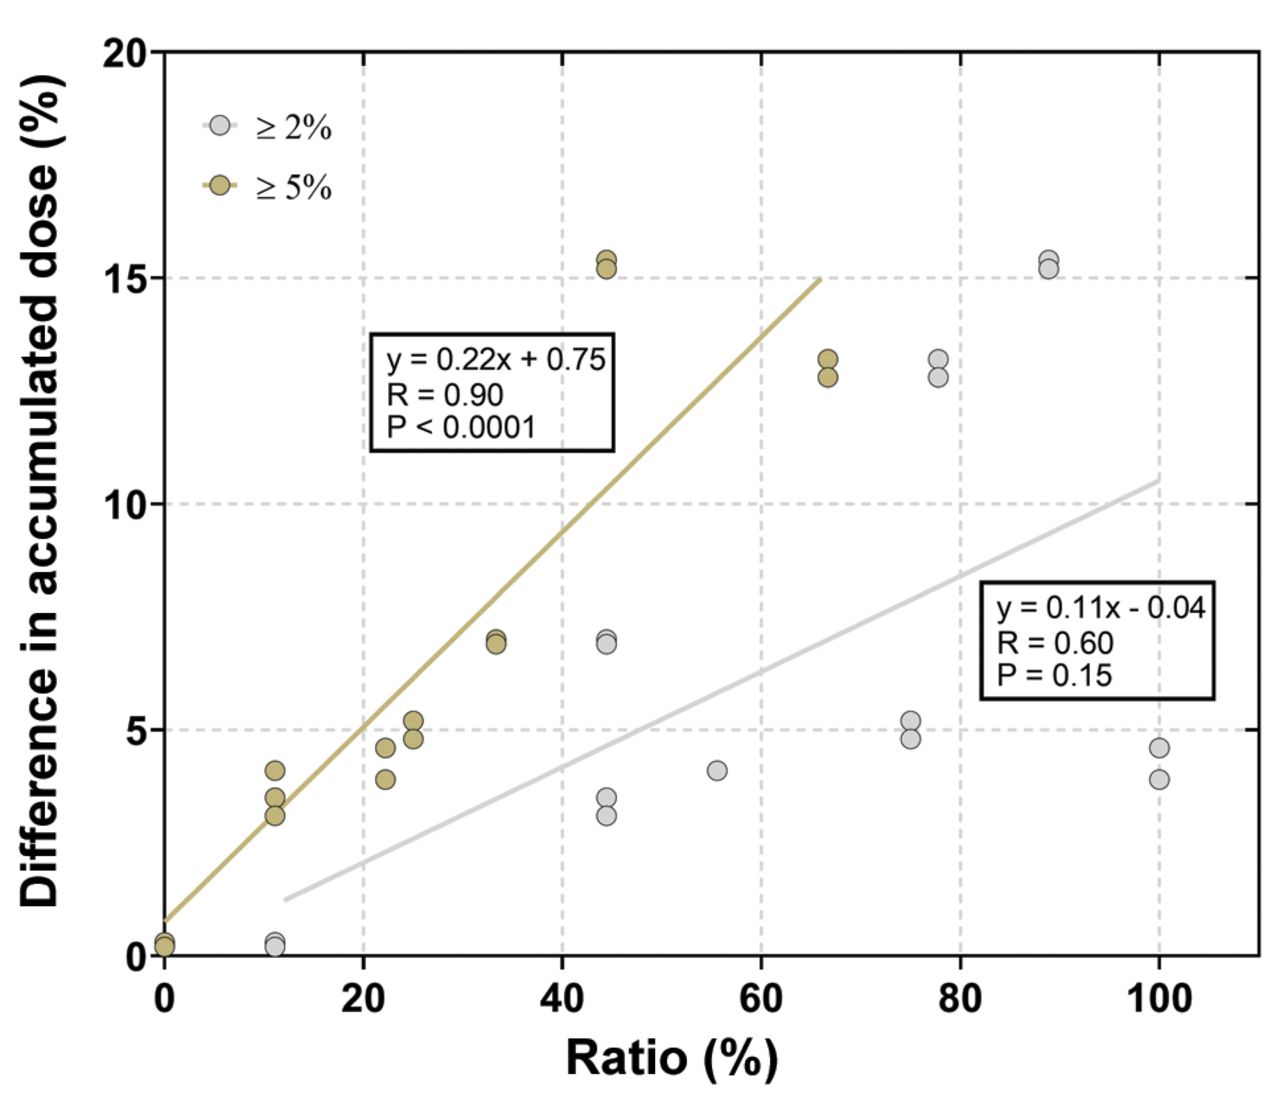
- Figure 5.
Dependence of the difference in accumulated dose in respect to the hDIR and cDIR on the percentage of cases with dosimetric changes greater than 2% and 5%, respectively.


Tables


In this issue


Jump to section
Related Articles
Cited By...
- No citing articles found.