


Abstract
Background/Aim: Previous reports identified a global proteomic signature of estrogen-independent letrozole resistant breast cancer cells, however, it remains unclear how letrozole-resistance is impacted when cells remain estrogen receptor positive (ER+). Materials and Methods: To capture the protein expression profile associated with ER+ Aromatase inhibitor (AI) resistance, a global proteomic analysis was conducted using the letrozole-sensitive (T47Darom cells) and letrozole-resistant cells (T47DaromLR cells). To examine the molecular features associated with this phenotype Kaplan– Meier analysis, phospho-antibody arrays, proliferation and apoptosis assays were conducted. Results: MAP3K6 was up-regulated in the T47DaromLR cells by 3.2-fold (p<0.01) which was associated with a decrease in relapse-free survival among breast cancer patients (p=0.0019). Members of the MAPK/p38 pathway (i.e., phospho-MKK6, phospho-p38, phospho-RSK1, phospho-RSK2, and p70S6K MAPK) were also increased in the T47DaromLR cells, while inhibiting p38 led to decreased proliferation and induction of apoptosis. Conclusion: Activation of the p38/MAPK pathway leads to ER+ AI-resistance.
Aromatase inhibitors, like letrozole, are the first-line therapy for postmenopausal women with estrogen-dependent breast cancer. These agents block the biosynthesis of estrogen through aromatase inhibition and inhibit the proliferation of estrogen-dependent breast tumors. Unfortunately, after several years some patients develop therapeutic resistance, and the tumors continue to proliferate. To study aromatase inhibitor resistance in the laboratory setting, a letrozole resistant cell line was developed by inoculating the MCF-7Ca cells (MCF-7 cells stably transfected into the human aromatase gene) into immunocompromised mice and treating the mice with letrozole for 56 weeks (1). After long-term treatment, the tumors acquired resistance to letrozole, were cultured in vitro and termed long term letrozole treated (LTLT)-Ca cells. Previous studies in our lab have demonstrated that as the letrozole-sensitive cells (AC-1) transition to the letrozole-resistant phenotype (LTLT-Ca) they are associated with estrogen independence, up-regulation of growth factor signaling cascades, and increased motility (2). However, the changes that occur as cells acquire resistance to letrozole while maintaining estrogen dependence remains unclear.
To this end, an in vitro model of letrozole resistance was developed whereby the T47D parental cell line was stably transfected with the human aromatase gene and termed the T47Darom cells. The T47Darom cells were treated with letrozole for 75 weeks until they became resistant to letrozole and were called T47DaromLR cells. When the T47DaromLR cells were characterized, they retained both aromatase activity and ER expression (3). As such, this was an ideal model to test the hypothesis that there are distinct proteomic profiles between estrogen-dependent and estrogen-independent letrozole resistant breast cancer cells, which may be useful for therapeutic decision making. Here, we examined the proteomic signature associated with T47D cells as they acquire resistance to an aromatase inhibitor.
Materials and Methods
Cell culture. In this study, we utilized two cell lines previously developed and derived from the T47D parental breast cancer cell line (3). The T47Darom cells (the T47D cells stably transfected with the human aromatase gene) were cultured and maintained in phenol red DMEM media (Invitrogen, Waltham, MA, USA) supplemented with 5% fetal bovine serum (FBS), penicillin-streptomycin, antimycotic-antibiotic (10,000 U/ml penicillin G sodium; 10,000 mg/ml streptomycin sulfate), and 0.75 mg/ml geneticin (Invitrogen). The T47DaromLR cells were generated by treating the T47Darom for 75 weeks in the presence of 10 μM letrozole and were maintained in phenol red-free DMEM media (Invitrogen) supplemented with 10% charcoal-stripped fetal bovine serum (FBS), penicillin-streptomycin, antimycotic-antibiotic (10,000 U/ml penicillin G sodium; 10,000 mg/ml streptomycin sulfate), 7.5 mg/ml geneticin (Invitrogen), and 1 mM letrozole (Sigma-Aldrich, St. Louis, MO, USA). The cells were maintained in a tissue culture incubator in a humidified atmosphere of 5% CO2 and 95% air at 37°C. Both cell lines were a generous gift from ITT Research Institute.
MAPK and RTK phosphorylation antibody arrays. To compare the changes in activation/phosphorylation of MAPK and Receptor Tyrosine Kinases (RTK) between the T47Darom and T47DaromLR cells, the Human MAPK Phosphorylation Antibody Array (ab211061, Abcam, Cambridge, MA, USA) and the Human RTK Phosphorylation Antibody Array Membrane (ab193662, Abcam), were evaluated respectively. The antibody arrays consisted of nitrocellulose membranes containing anti-MAPK or anti-RTK antibodies spotted duplicate and include positive and negative controls and a blank. Cell lysates were prepared from T47Darom and T47DaromLR cells using Cell Lysis Buffer supplemented with Phosphatase Inhibitor and Protease Inhibitor Cocktail and stored at −80°C until use. For each cell lysate, 900 μg of total protein were determined by the Bradford Assay (BioRad, Hercules, CA, USA) and incubated in 2 ml of 1X Blocking Buffer at room temperature for 30 min. The antibody array membranes were washed and subsequently incubated with Detection Antibody Cocktail (for MAPK assays) or with biotinylated anti-phosphotyrosine antibody (for RTK assays) overnight at °C to detect phosphorylated cytokines or tyrosine on activated receptors. After washing and incubation with HRP-streptavidin, the membranes were subjected to visualization with chemiluminescence-based detection method.
Cell lysis. T47Darom and T47DaromLR control cells were cultured to 80% confluence in standard growth medium as described above and washed three times with cold Hank’s Buffered Salt Solution (HBSS), then collected with a cell scraper. Nonidet P-40 cell lysis buffer (Invitrogen) containing an additional 1 mM of phenylmethyl sulfonyl fluoride (PMSF) and protease inhibitor mixture (Sigma-Aldrich) was used to extract total cellular proteins. The concentration of proteins was measured with BCA assay (Pierce Biotechnology, Rockford, IL, USA). The cell lysates were stored at –80°C before further processing.
Trypsin digestion. Protein samples were digested with sequencing grade modified trypsin (Promega Corp, Madison, WI, USA) according to the manufacturer’s instructions. Briefly, to aliquots of 100 μg of protein sample were added 45 μl of 200 mM triethylammonium bicarbonate (TEAB) and the final volume was adjusted to 100 μl with ultrapure water. Five microliters of 200 mM Tris (2-carboxyethyl) phosphine (TCEP) were added and the resulting mixture was incubated for 1 h, then 5 μl of 375 mM iodoacetamide were added and the mixture was incubated for 30 min in the dark. After incubation, 1 ml of prechilled acetone was added and the precipitation was allowed to proceed overnight. The acetone-precipitated protein pellets were suspended with 100 μl of 200 mM TEAB and 2.5 μg of trypsin were added to digest the sample overnight at 37°C.
Tandem mass tags (TMT) labeling. Tandem mass tags TMT6 (Thermo Scientific, Waltham, MA, USA) with different molecular weights (126~131 Da) were applied as isobaric tags for relative and absolute quantification. According to the manufacturer’s protocols, the digested samples were individually labeled with TMT6 reagents for 1 h as follows: three 100-μg aliquots of digested peptides from the T47Darom cells were each labeled with a different isobaric tag (TMT126, 127, and 128, respectively). Likewise, 100 μg aliquots of peptides from the T47DaromLR cells were labeled with TMT129, 130, and 131 mass tags, respectively. The labeling reaction was quenched with 5% hydroxylamine. Finally, the six labeled peptide aliquots were combined for subsequent fractionation.
Fractionation of labeled peptide mixture using a strong cation exchange column. The combined TMT labeled peptide mixture was fractionated with a strong cation exchange column (SCX) (Thermo Scientific) on a Shimadzu 2010 HPLC equipped with a UV detector (Shimadzu, Columbus, MD, USA). The mobile phase consisted of buffer A (5 mM KH2PO4, 25% acetonitrile, pH 2.8) and buffer B (buffer A plus 350 mM KCl). The column was equilibrated with buffer A for 30 min before sample injection. The mobile phase gradient was set as follows at a flow rate of 1.0 ml/min: (a) 0 to 10 min: 0% buffer B; (b) 10 to 40 min: 0% to 25% buffer B, (c) 40 to 45 min: 25% to 100% buffer B; (d) 45 to 50 min: 100% buffer B; (e) 50 to 60 min: 100% to 0% buffer B; (f) 60 min to 90 min: 0% buffer B. A total of 60 fractions were initially collected, lyophilized, and combined into 15 final fractions based on SCX chromatographic peaks.
Desalination of fractionated samples. A C18 solid-phase extraction (SPE) column (Hyper-Sep SPE Columns, Thermo-Fisher Scientific) was used to desalt all collected fractions. The combined 15 fractions were each adjusted to 1 ml final volume containing 0.25% (v/v in water) trifluoroacetic acid (TFA, Sigma-Aldrich). The C18 SPE columns were conditioned before use by filling them with 1 ml acetonitrile and allowing the solvent to pass through the column slowly (~3 min). The columns were then rinsed three times with 1 ml 0.25% (v/v in water) TFA solution. The fractions were loaded on to the top of the SPE cartridge and allowed to elute slowly. Columns were washed four times with 1-ml 0.25% TFA aliquots before the peptides were eluted with 3×400 μl of 80% acetonitrile/0.1% formic acid (aqueous).
LC-MS/MS analysis on LTQ-Orbitrap. Peptides were analyzed on an LTQ-Orbitrap XL instrument (Thermo-Fisher Scientific) coupled to an Ultimate 3000 Dionex nanoflow LC system (Dionex, Sunnyvale, CA, USA). High mass resolution was used for peptide identification and high energy collision dissociation (HCD) was employed for reporter ion quantification. The RP-LC system consisted of a peptide Cap- rap cartridge (0.5×2 mm) (Michrom BioResources, Auburn, CA, USA) and a prepacked BioBasic C18 PicoFrit analytical column (75 μM i.d. ×15 cm length, New Objective, Woburn, MA, USA) fitted with a For-tisTip emitter tip. Samples were loaded onto the trap cartridge and washed with mobile phase A (98% H2O, 2% acetonitrile, and 0.1% formic acid) for concentration and desalting. Subsequently, peptides were eluted over 180 min from the analytical column via the trap cartridge using a linear gradient of 6-100% mobile phase B (20% H2O, 80% acetonitrile, and 0.1% formic acid) at a flow-rate of 0.3 μl per min using the following gradient: 6% B for 5 min; 6-60% B for 125 min; 60-100% B for 5 min; hold at 100% B for 5 min; 100-6% B in 2 min; hold at 6% B for 38 min.
The LTQ-Orbitrap tandem mass spectrometer was operated in a data-dependent mode. Briefly, each full MS scan (60,000 resolving power) was followed by six MS/MS scans where the three most abundant molecular ions were dynamically selected and fragmented by collision-induced dissociation (CID) using a normalized collision energy of 35%, and the same three molecular ions were also scanned three times by HCD-MS2 with collision energy of 45%. MS scans were acquired in profile mode and MS/MS scans in centroid mode. LTQ-Orbitrap settings were as follows: spray voltage 2.0 kV, 1 microscan for MS1 scans at 60,000 resolutions (fwhm at m/z 400), microscans for MS2 at 7500 resolutions (fwhm at m/z 400); full MS mass range, m/z 400-1400; MS/MS mass range, m/z 100-2000. The “FT master scan preview mode,” “Charge state screening”, “Monoisotopic precursor selection” and “Charge state rejection” were enabled so that only the 2+, 3+, and 4+ ions were selected and fragmented by CID and HCD.
Database search and TMT quantification. The protein search algorithm used was Mascot v2.3.01 (Matrix Science, Boston, MA, USA). Mascot format files were generated by the Proteome Discoverer 1.2 software (Thermo-Fisher Scientific) using the following criteria: database, IPI_Human.fasta. v3.77 (containing 89,422 entries and concatenated with the reversed versions of all sequences.); enzyme, trypsin; maximum missed cleavages, 2; Static modifications, carbamido- methylation (+57 Da), N-terminal TMT6plex (+229 Da), lysyl TMT6plex (+229 Da). Dynamic modifications, N-terminal Clnpyro- Glu (+17 Da); methionine oxidation (+16 Da); STY phosphorylation (+80 Da); Precursor mass tolerance was set at 20 ppm; fragment match tolerance was set at 0.8 Da. Peptides reported by the search engine were accepted only if they met the false discovery rate of p<0.05 (target decoy database), a Mascot ion score ≥30 for peptide identifications was required. For TMT quantification, the ratios of TMT reporter ion abundances in MS/MS spectra generated by HCD (up to six reporter ions ranging from m/z 126.12 to m/z 131.14) from raw data sets were used to calculate fold changes in proteins between control and treatment.
Kaplan–Meier (KM) survival analysis. The application of KM plot has been described in detail previously (4). Briefly, KM plots were obtained using the KM Plotter web-based (kmplot.com/analysis) curator, which surveys public microarray repositories for relapse-free and overall survival among patients with breast, lung, ovarian or gastric cancers. The KM Plotter recognizes 54,675 individual Affymetrix probe sets, and surveys expression data from 4,142 breast cancer patients (as of 2014). Survival and gene expression data were derived from the GEO (Gene Expression Omnibus), TCGA (The Cancer Genome Atlas), and EGA (European Genome-phenome Atlas) databases. In order to ascertain P4HB expression, Affymetrix probe 200654 was selected. Overall Survival in the total population (1402 patients) was determined.
Viability assay. Proliferation assays were performed as previously described (5). Specifically, the T47Darom cells (aromatase inhibitor sensitive) were plated in 96-well plates at a density of 2×10³ cells per well for each cell line and allowed to recover for 24 h. The T47DaromLR cells (AI-resistant) were cultured in the presence of letrozole. For proliferation assays, the cells were treated with DMSO (control) or 30 μM SB205380 in 96-well plates to determine the effects of the various treatments in the absence of letrozole. The resazurin dye (Sigma-Aldrich) was added to each well at 10% of the total volume and measured at 24 h. The SpectraMax® MiniMax® 300 Imaging Cytometer (Molecular Devices, San Jose, CA, USA) was used to measure fluorescence and background wavelengths at 530 nm and 590 nm to determine proliferation. All experiments were performed with n ≥3 and a total of 3 biological replicates were performed. The proliferative activity was calculated as a percent of the vehicle controls as follows:
Antiproliferative activity=[Fluorescence of viable cells (control) − Fluorescence of viable cells (treated)]/Fluorescence of viable cells (control).
Caspase 3/7 apoptosis assay. The T47Darom and T47DaromLR cells were seeded at a density of 1.5×10³ cells in a 96-well plate with appropriate media overnight. Cells were treated the following day with DMSO (control) or 10 μM SB205380. Cells were incubated for 24 h at 37°C with 5% CO2. On the following day, the cells treated with 4 μM CellEvent™ Caspase-3/7 Green Detection Reagent (Invitrogen) and incubated for 30 min at 37°C with 5% CO2. The cells were then fixed with 4% formaldehyde and allowed to incubate for 15 min at room temperature. The SpectraMax®MiniMax® 300 Imaging Cytometer (Molecular Devices) was used to measure fluorescence and background wavelengths at 530 nm and 502 nm, respectively. Cells were imaged on Nikon Ti Eclipse microscope (Minato, Tokyo, Japan) using a FITC filter.
Results
Proteomic profile of estrogen-dependent letrozole resistant breast cancer cells is associated with a unique signature. To examine the global changes in protein expression as cells transition from AI-sensitive to AI-resistant while maintaining ER expression, a gel-free proteomic approach combining tandem mass tag (TMT) labeling, two-dimensional HPLC, and high-resolution mass spectrometry was utilized. The identities of over 1900 proteins with quantitative abundance ratios were present in both the letrozole sensitive (T47Darom) and the letrozole resistant (T47DaromLR) breast cancer cells. Abundance ratios ≥1.25 were defined as high while those ≤0.8 were defined as low. Of the quantified proteins, a total of 127 were significantly high (p<0.05) as indicated by Table I, while 111 were significantly low (p<0.05) as shown by Table II. The top three up-regulated proteins were mitogen-activated kinase kinase kinase 6 (M3K6), protein disulfide isomerase (P4HB), and midasin (MDN1), and they were increased by 3.204-fold (p<0.01), 3.195-fold (p<0.01), and 2.759-fold (p<0.001), respectively. These proteins are indicated in bold. Among the down-regulated proteins, Peptidyl-prolyl cis-trans isomerase (FKBP4) was decreased by 0.484-fold (p<0.001) which is also indicated in bold.
Up-regulated proteins in letrozole resistant T47DaromLR breast cancer cells. Proteomic analyses were performed as described in the Methods section and the ratio of the fold change in T47DaromLR/T47Darom cells is shown. Text in bold indicates the proteins exhibiting the greatest fold change.
Down-regulated proteins in letrozole resistant T47DaromLR breast cancer cells. Proteomic analyses were performed as described in the Methods section and the ratio of the fold change in T47DaromLR/T47Darom cells is shown. The text in bold indicates a protein of interest.
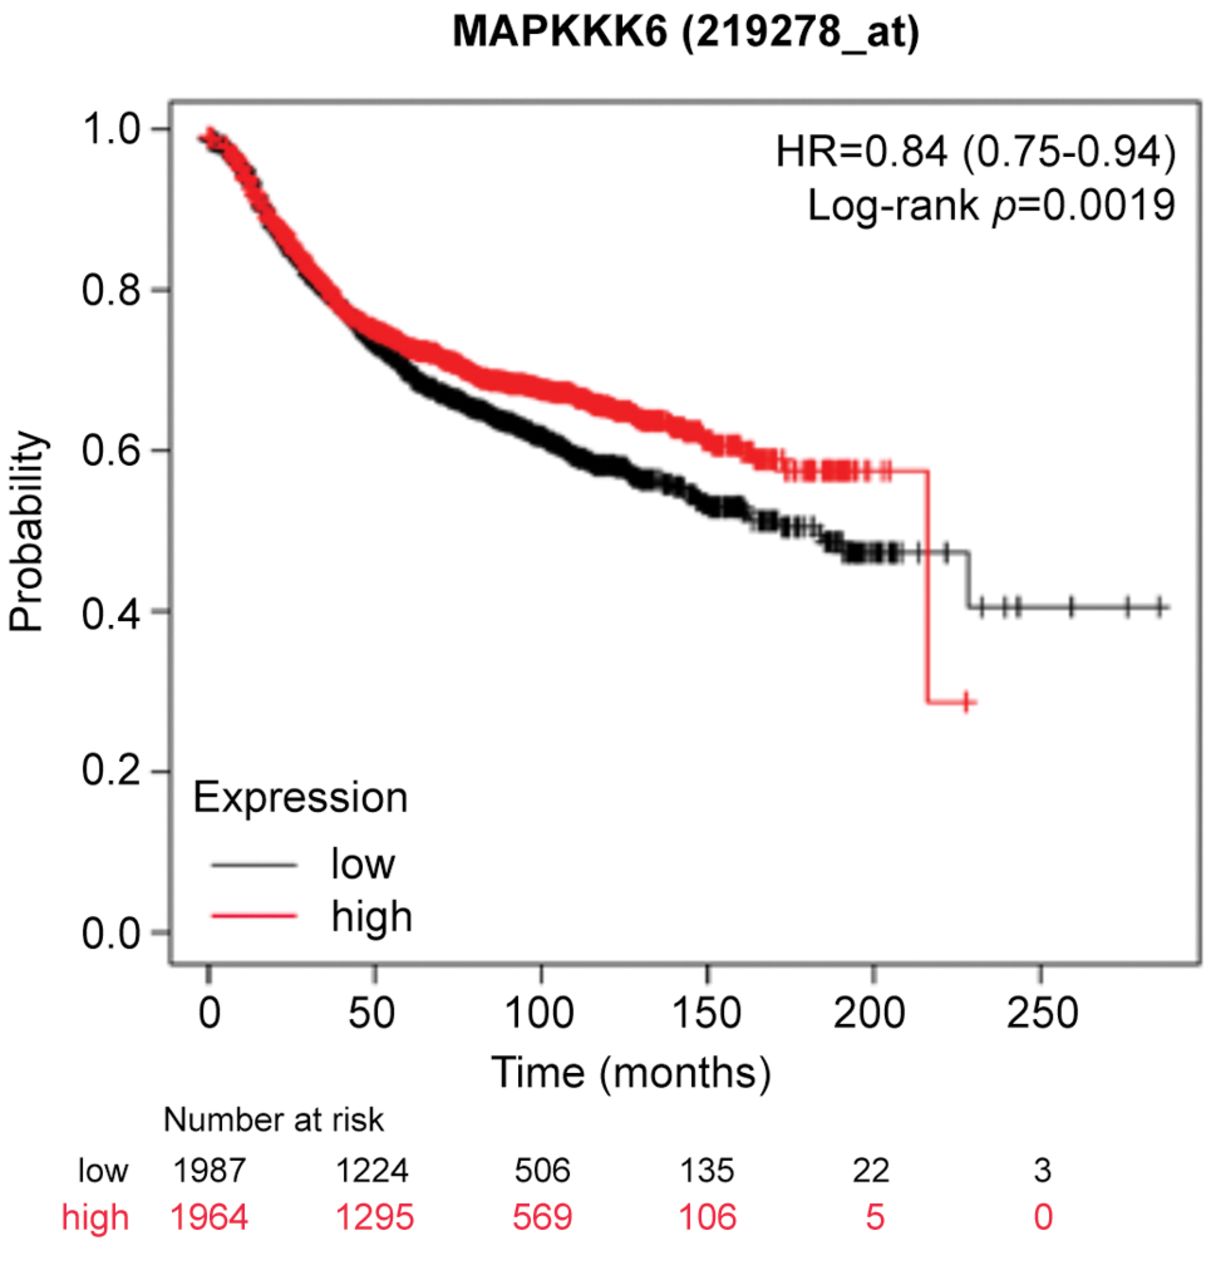
High MAP3K6 expression is associated with decreased relapse-free survival. Since MAP3K6 was significantly increased, we sought to examine the clinical relevance on patient survival. To predict whether increased MAP3K6 expression levels were associated with differences in survival, KM Plotter was used to interrogate publicly available microarray repositories of breast cancer patients. Based on these parameters, high MAP3K6 expression was found to be associated with a decrease in relapse-free survival (p=0.0019) with a hazard ratio of 0.84 (0.75-0.84) (Figure 1).

High MAP3K6 expression is associated with decreased relapse-free survival in breast cancer patients. Using Kaplan–Meier Plotter (KM Plotter), publicly available microarray repositories for breast cancer were interrogated to determine whether MAP3K6 expression was associated with different survival rates among breast cancer patients. Hazard ratio (HR) and Log-rank p-values are shown. Low expression (below median) is noted in black, and the high expression (above median) is noted in red.
The MAPK signaling cascade is activated as cells acquire resistance to letrozole. Since M3K6 exhibited the highest increase in expression between the two cell lines, we were interested in determining whether this alteration was associated with activation of the MAPK signaling cascades as a result of ER+ letrozole resistance. To study multiple proteins within this pathway and other receptor tyrosine kinase signaling cascades, the MAPK and RTK phospho-antibody arrays were utilized to measure the activation of key signaling components between the T47Darom and the T47DaromLR cells. We chose both arrays because a previous finding from our group demonstrated that HER2 expression was increased in the T47DaromLR cells (6). Although total HER2 expression was previously shown to be increased, activated ErbB2 (HER2) levels were decreased by 1.40-fold (p<0.05), suggesting this may not be a critical driver associated with ER+ AI resistance (Figure 2). We also observed increased expression of IGF1R which was previously found up-regulated in the LTLT-Ca cells (7). When signaling components associated with the MAPK pathway were assessed, several phosphorylated proteins of interest were significantly increased including MKK6 (1.20-fold), p38 (1.41-fold), p70S6K (1.74-fold), phospho-Ribosomal S6 Kinase 1 (1.71-fold) and phospho-Ribosomal S6 Kinase 2 (4.74-fold) (Figure 3). This was highly relevant as this pathway is associated with growth, differentiation, apoptosis, and survival. Since there was not a significant change in Akt and mTOR expression, it is unlikely that the PI3K/Akt/mTOR pathway plays a major role in ER+ acquired AI resistance. Additionally, since both MEK and ERK1 were significantly decreased by 1.43- and 1.08-fold respectively, the Ras pathway may not be relevant. Taken together, this data suggests the p38/MAPK pathway may be a major driver of ER+ letrozole resistance. It was also noted that there was a 1.43-fold increase in p53 expression. This finding was not unusual as the T47D cell line expresses mutant p53 and in cultured cells, overexpression of tumor-associated p53 mutants has been shown to interfere with stress-induced apoptosis, increase resistance to chemotherapeutic drugs (8-12), promote genomic instability (13), and enhance proliferation (14).

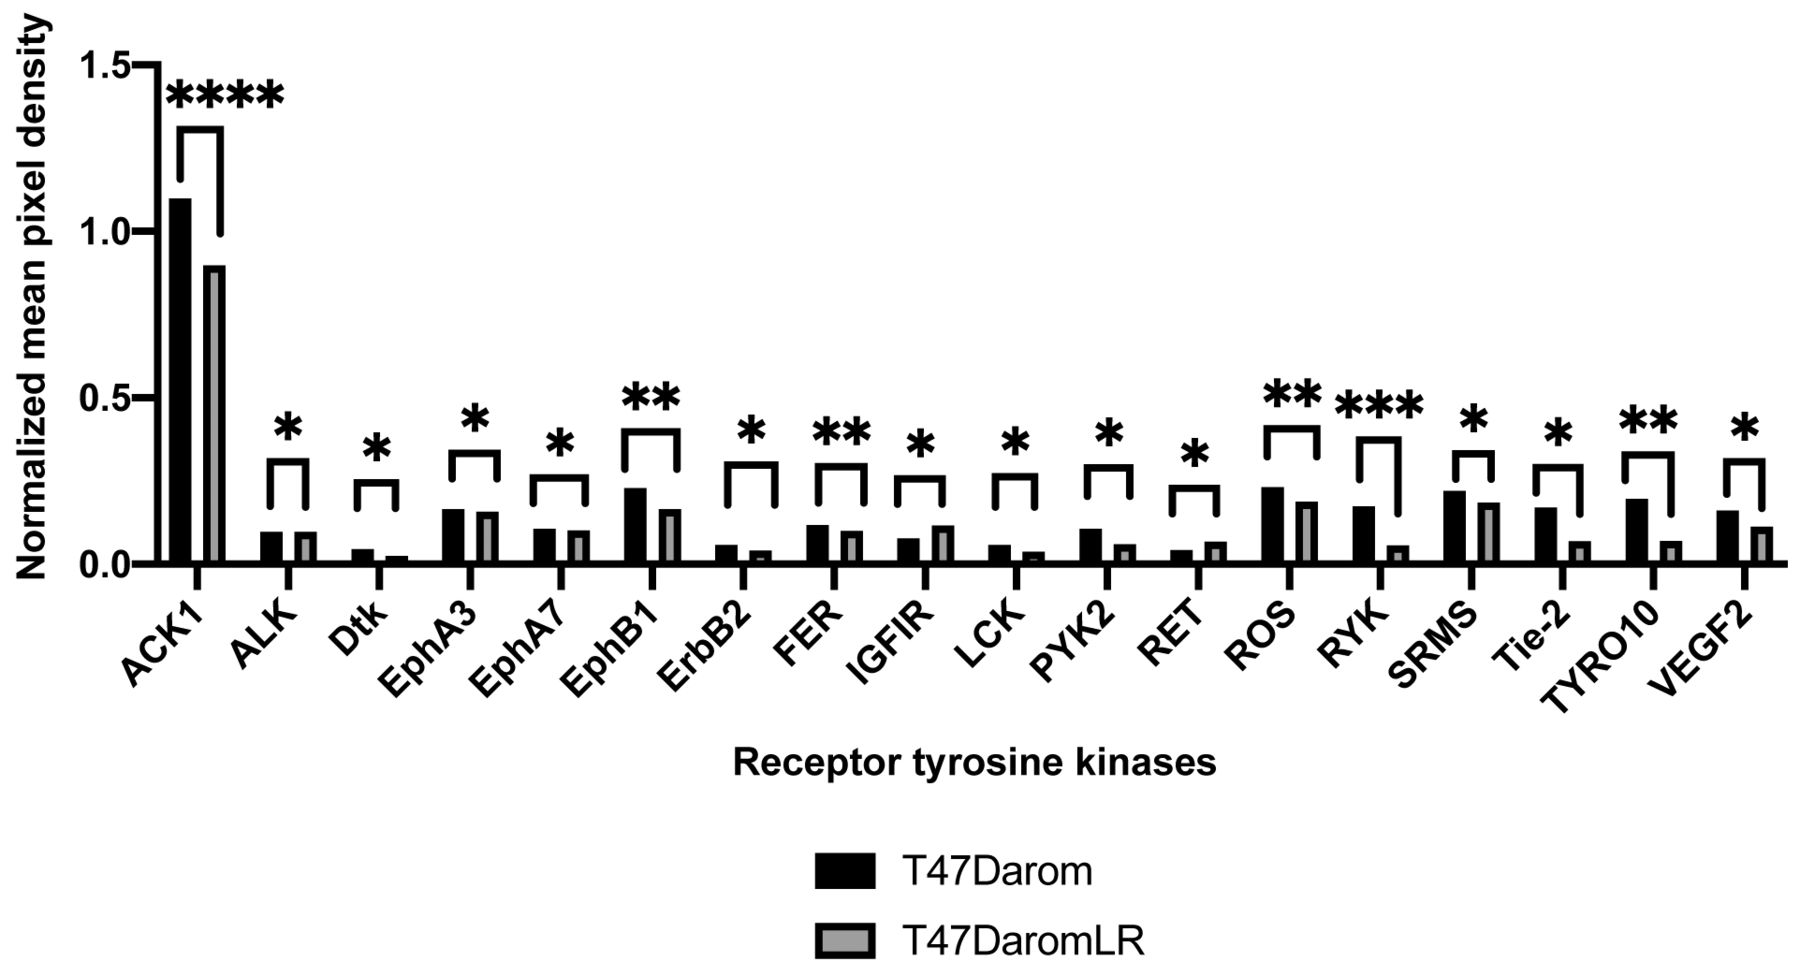
Hormone dependent letrozole resistance induces global down-regulation of activated receptor tyrosine kinases. Graph depict normalized mean pixel density of protein levels in lysates prepared from the T47Darom and T47DaromLR cells using the Human RTK Antibody Array Membrane where 71 different anti-RTK antibodies were spotted in duplicated, including 4 positive and 3 negative controls and 1 blank. Array signals were analyzed using Image Lab (BioRad) software. Values from duplicate spots were averaged and plotted. Results are expressed as the mean unit±SD (****p<0.0001, ***p<0.001, **p<0.01, *p<0.05).

MAPK signaling cascade is induced in the letrozole-resistant T47DaromLR cells. Graph depict normalized mean pixel density of protein levels in lysates prepared from the T47Darom and T47DaromLR cells using the Human MAPK Phosphorylation Antibody Array Membrane where 17 different anti-MAPK related antibodies were spotted in duplicate, including 4 positive and 3 negative controls and 1 blank. Array signals were analyzed using Image Lab (BioRad) software. Values from duplicate spots were averaged and plotted. Results are expressed as the mean unit±SD (***p<0.001, **p<0.01, *p<0.05).
The p38/MAPK pathway drives letrozole resistance. Since the proteomic analysis and the antibody array results demonstrated that increased p38/MAPK signaling was associated with the T47DaromLR cells, we wanted to determine whether inhibition of this pathway was responsible, in part, for the refractory nature of the cells as well as their aggressive phenotype. To test this, both the T47Darom and T47DaromLR cells were treated with 30 μM SB 203580 (a selective p38 MAPK) and proliferation was measured. Our results demonstrated that while the T47Darom cells were unaffected by SB 203580 treatment, there was a 1.47-fold (p<0.0001) reduction in the proliferation of the T47DaromLR cells (Figure 4). As the growth of the T47DaromLR cells was selectively decreased by the p38 inhibitor, we chose to assess whether this effect was associated with alterations in apoptosis. The caspase 3/7 assay was performed on both cell lines in the presence and absence of the p38 inhibitor (Figure 5). While the T47Darom cells were unresponsive, there was a slight induction in apoptosis in the T47DaromLR cells treated with the p38 inhibitor, suggesting the p38/MAPK pathway may play a role in endocrine resistance.

Letrozole resistant cells are more sensitive to the growth inhibitory effects of p38/MAPK inhibitor SB 203508. The T47Darom cells were cultured in standard growth media and transferred to phenol red free media for two days prior to treatment with DMSO control or 30 μM of SB 203508 and cell proliferation assays were performed after 24 h. Proliferation was measured using the resazurin assay and graphs depict the fluorescence intensity of cells read at 430/560 nM wavelengths. Results are expressed as the mean unit±SD (****p<0.0001) of three independent experiments in triplicate; ns: not significant.

Induction of apoptosis through targeting p38. The T47Darom cells were cultured in standard growth media and transferred to phenol red free media for two days prior to treatment with DMSO control or 10 μM of SB 203508 and caspase 3/7 activity was assessed by measuring the fluorescent intensity of cells at 530/502 nM wavelength. Results are expressed as the mean unit±SD (**p<0.01) of three independent experiments in triplicate.
Discussion
Aromatase inhibitors have been the first-line agents for post-menopausal women with hormone receptor positive metastatic breast cancer for many years. However, like many agents, some women develop resistance and stop responding to therapies, which can result in tumor relapse, metastasis, and a more aggressive phenotype. Thus, understanding mechanisms of resistance are critical to the development of novel strategies to address these patients. Previous reports by our group have identified a signature of letrozole resistance that was associated with estrogen independence, increased EGFR and HER2, enhanced motility, and an EMT phenotype (2). We focused on understanding the mechanisms of AI resistance associated with hormone refractory tumors, however the distinctions between AI-resistance in the hormone dependent versus hormone independent settings remain unclear.
Here, we utilized a non-migratory, ER+ letrozole resistant cell line (i.e., derived from the T47D epithelial cells) as a model system to initially characterize changes that occur as cells transition to an acquired AI-resistant phenotype. Although these cells are ER+, they are cross resistant to the selective estrogen receptor modulator tamoxifen, (3) further demonstrating their aggressive nature and limited therapeutic options. As the AI-sensitive cells transitioned to AI-resistance, both HER2 and MAPK expression were induced (6). This was a similar phenomenon previously observed in the hormone-independent AI-resistant LTLT-Ca cells (2). When the protein expression of a panel of phosphorylated receptor tyrosine kinases were evaluated, pErbB2 (i.e., pHER2) expression was decreased in the T47DaromLR cells compared to the T47DaromLR cells, suggesting that other pathways may be responsible for the acquired resistance. This was a unique feature of the T47DaromLR cells compared to the LTLT-Ca cells. Previous reports have demonstrated that increased pHER2 expression in the LTLT-Ca cells and trastuzumab was capable of reversing the resistance and restoring sensitivity to letrozole (15).
Since the T47DaromLR cells exhibited increased MAPK, we evaluated a panel of phosphorylated proteins involved in the MAPK signaling cascade. Signaling components and effectors of the p38/MAPK pathway (i.e., MKK6 and p38) were significantly increased while proteins involved in the PI3K/Akt/mTOR pathway (Akt and mTOR) were unchanged. It was interesting that signaling components of the Ras pathway (i.e., MEK and ERK1) were unchanged, while the downstream effectors (i.e., RSK1 and RSK2) of the Ras and p38/MAPK pathway were the predominant kinases that were increased. In general, RSK phosphorylates various substrates that control diverse cellular processes and when inhibited, it eliminates breast tumor initiating cells which are de novo chemo-resistant (16). Given these findings, it is likely that ER-dependent AI resistance is mediated through the p38/MAPK signaling cascade. The observation that the MAPK signaling was increased in the T47DaromLR cells was not completely novel, since it has been previously reported that HER2, p-Shc, Grb2, and the signaling proteins in the MAPK cascade were increased in the LTLT-Ca cells (1).
A global proteomic analysis was conducted using the T47Darom and the T47DaromLR cells to further identify a protein signature specifically associated with ER+ AI resistance. Since we identified that acquired resistance was associated with the p38/MAPK signaling cascade, it is notable that one of the upstream signaling molecules, MAP3K6 was up-regulated. Out of a total of 127 significantly increased proteins, MAP3K6 exhibited the highest expression and was associated with decreased relapse-free survival. This further underscored the aggressive nature of breast tumors fitting this profile. Based on these findings, it is likely that as letrozole sensitive cells transition to a letrozole resistant phenotype they preferentially proliferate through activation of the p38/MAPK pathway inducing phosphorylation of RSK1/RSK2. Failure of these cells to respond to tamoxifen suggests they may utilize additional ligand independent signaling mechanism potentiated by p38. When the cells were treated with a p38 inhibitor, the T47Darom cells exhibited decreased proliferation and a slight induction in apoptosis.
While the major focus of this study was the p38/MAPK pathway, other proteins were identified including a protein disulfide isomerase (PDI) P4HB (prolyl 4-hydroxylase b). During times of oxidative stress or endoplasmic reticulum stress proteins unfold and molecular chaperones, like P4HB, assist in restoring unfolded proteins to their native conformation (17). A previous report has found that P4HB promoted a malignant phenotype in glioma cells via MAPK signaling (18) and identified P4HB as a novel target of chemoresistance in glioblastoma multiforme (19). It was hypothesized that perturbation of P4HB may sensitize the chemo-resistant glioma cells. While it is also known that PDIs serve as molecular chaperones to maintain ERα structure and function (20), the significance of high levels of P4HB and/or convergence with MAPK signaling pathways in AI-resistance remains unclear.
The proteomic analysis also revealed increased midasin (MDN1) expression which functions as a nuclear chaperone that is involved in the assembly/disassembly of macromolecular complexes in the nucleus, and is associated with maturation of 60S ribosome subunits (21). The finding that midasin was overexpressed in the T47DaromLR cells was interesting because a previous proteomic analysis demonstrated a 35-fold increase in MDN1 expression in LTLT-Ca cells cultured as mammospheres compared to LTLT-Ca cells cultured adherently (22, 23). While the role of midasin in breast cancer remains unclear, it is known that ribosomal biogenesis remains at the heart of translation. This process requires extensive regulation and coordination to meet the cellular demands of continuous ribosome production and aberrant midasin expression and subsequent interference with ribosomal biogenesis affects translation and the overall fitness of the cell.
While the proteomic signature of ER+ AI resistance is associated with enhanced p38/MAPK signaling there are additional factors contributing to this phenotype that are yet to be understood. Future studies will allow understanding how various signaling cascades converge to induce acquired letrozole resistance.
Acknowledgements
The Authors thank the ITT Research Institute and Dr. Akash Gupta for generously donating the T47Darom and T47DaromLR cell lines.
Footnotes
Authors’ Contributions
SLT conceived and designed the experiments and directed the project. RRW and MRB performed the experiments. AMD, KPL, and GW contributed to data acquisition. RRW, KZ, and KMG analyzed and interpreted the data. AMD provided technical editing. RRW and SLT wrote the manuscript.
This article is freely accessible online.
Conflicts of Interest
The Authors declare no conflicts of interest in relation to this study.
Funding
This work was supported in part by the National Institutes of Health [grant number 1SC1GM126617] awarded to Syreeta L. Tilghman. This publication was made possible by funding from the Louisiana Cancer Research Consortium and the National Institutes of Health Research Centers at Minority Institutes [grant numbers 8G12MD007595 and U54MD007582] from the National Institute on Minority Health and Health Disparities. The contents are solely the responsibility of the authors and do not necessarily represent the official views of the Louisiana Cancer Research Consortium or the NIH.
- Received November 30, 2020.
- Revision received December 31, 2020.
- Accepted January 4, 2021.
- Copyright © 2021 International Institute of Anticancer Research (Dr. George J. Delinasios), All rights reserved.
References
In this issue


Jump to section
Related Articles
Cited By...
- No citing articles found.