


Abstract
Aim: The aim of the study was to compare the accuracy of common clinical findings, laboratory tests and diagnostic score (DS) in diagnosis of clinically confirmed acute appendicitis (AA) in children. Patients and Methods: A cohort of 188 children under the age of 15 years presenting with acute abdominal pain (AAP) were included in the study. The clinical history (n=21), signs (n=14) and tests (n=3) were recorded in each child. Results: The significant independent diagnostic predictors (disclosed by multivariate logistic regression model) were used to construct the DS formulas for AA diagnosis. These formulas were tested at six different cut-off levels to establish the most optimal diagnostic performance for clinically confirmed AA. In the receiver operating characteristic curve (ROC) comparison test, there was a statistically significant difference (p=0.0055) in the area under curve (AUC) values between i) clinical history and symptoms (AUC=0.594), and ii) signs and laboratory tests (AUC=0.734), whereas both were significantly inferior (p=0.0001) to the AUC value of the DS (AUC=0.952). Conclusion: In diagnosis of clinically confirmed AA in children, the DS formula is superior to both the clinical history/symptoms and signs/lab tests, justifying the use of DS as an integral part of the diagnostic algorithm of AA in all children presenting with AAP.
Although, the incidence of acute appendicitis (AA) has been quite stable in Western countries, the incidence of AA is rapidly rising in the newly industrialized countries (1, 2). AA is confirmed clinically based on symptoms, signs and diagnostic tests. Ultrasonography (US) examination, leucocyte count (LC) and other inflammatory markers are often performed to confirm the diagnosis of AA. However, AA with appendectomy still remains to be confirmed in an operation performed without full certainty of the definitive AA diagnosis. Although, the clinical symptoms, signs and clinical tests do not establish AA diagnosis with certainty, it is necessary to determine which of the children presenting with acute abdominal pain (AAP) need immediate surgical intervention (appendectomy) and for whom follow-up is a safe conduct.
Several diagnostic scores (DS) have been developed to differentiate AA from other causes of AAP. Some DS systems could increase the diagnostic accuracy in AA and decrease the false-positive appendectomy rate (3-10). Lintula et al. (6, 8) have previously constructed and validated a DS for AA in children, but unfortunately, they did not use hierarchical summary receiver operating characteristic (HSROC) and area under curve (AUC) analysis to confirm the diagnostic performance of DS in these children (6, 8). Prompted by the difficulty of AA diagnosis among children and the lack of diagnostic performance studies on DS (with HSROC analysis), we designed the present study to assess the relative accuracy of i) a detailed history taking, ii) clinical examination and laboratory testing, and iii) the DS in detecting clinically confirmed AA among the children with AAP.
Patients and Methods
Criteria for inclusion in the study and diagnostic criteria used were those set by the Research Committee of the World Organization of Gastroenterology (OMGE) (11-14). Included in the present study of 188 children under the age of 15 years were 93 girls (49.5%) and 95 boys (50.5%) with the mean age (±SD) of 9.6.0±3.0 years.
The diagnosis of AA was done by considering all symptoms, signs and results of the laboratory tests weighted against the accepted diagnostic criteria of AA (Tables I and II) (12-14).
The clinical history of the patients with acute appendicitis versus other cause of abdominal pain in children.
The clinical signs and investigations of patients with acute appendicitis versus other cause of abdominal pain in children.
Identifying the DS models. As the first step in constructing the DS, a multivariate logistic (stepwise) regression analysis (SPSS Statistics 26.0.0.1; IBM, NY, USA) was performed to disclose the variables with an independent predictive value. All the variables presented in Tables I and II were included in the analysis as binary data e.g. AA=1 and other diagnosis of AAP=0. Using the coefficients of the regression model, a DS was built and its predictive value for AA was studied (Table III). The coefficient of the multivariate analysis shows the relative risk (RR=e_, n=β) of a patient with a given symptom or sign to have an AA.
Diagnostic score for acute appendicitis in children shown at six different cut-off levels of symptoms, signs and tests. Cut-off levels: DS I=–1.15, DS II=–1.13, DS III=–0.29, DS IV=DS values between –1.15 and –0.29 excluded, n=25 patients, DS V=DS values between –1.15 and –1.13 excluded, n=14 patients, DS VI=DS values between –1.13 and –0.29 excluded, n=11 patients.
The DS formula for AA in children. The DS formula for AA in children, showing the highest diagnostic performance for AA in HSROC analysis is as follows DS: 1.752 × location of pain at diagnosis (positive endpoint=1, negative endpoint=0) + 1.728 × vomiting (positive endpoint=1, negative endpoint=0) + 2.192 × guarding (positive endpoint=1, negative endpoint=0) + 3.061 × rigidity (positive endpoint=1, negative endpoint=0) – 5.074. The DS values ranged between -5.07 and 3.66 and the mean (SD) of the DS values for children with AA (n=188) were –2.06 (±2.6).
Statistical analysis. All other statistical analyses were performed using STATA/SE version 16.1 (StataCorp, College Station, TX, USA). Statistical tests presented were two-sided, and p-value <0.05 was considered statistically significant. Using 2×2 tables, we calculated sensitivity (Se) and specificity (Sp) with 95% confidence intervals (95% CI) for each symptom, sign or laboratory test, and created separate forest plots for showing each set of data, separately for each diagnostic variables. We calculated the summary estimates of Se and Sp, positive likelihood ratio (LR+) and negative likelihood ratio (LR-) and diagnostic odds ratio (DOR), using a random effect bivariate model and fitted the summary hierarchical receiver operating characteristic (HSROC) curves, including all diagnostic variables in the DS model, using the AA endpoint.
Using the STATA’s prediction tool, we also made posterior predictions (EB=Empirical Bayes estimates) of the Se and Sp for each diagnostic variable in AA patients, including the different DS cut-offs. Analogous to its use in meta-analysis, EB estimates here give the best estimates of the true Se and Sp for each diagnostic variable, the variable-specific point estimates usually shrinking toward the summary point of the HSROC. We explored the statistical heterogeneity between diagnostic variables and DS models through visual examination of the forest plots and the HSROC curves.
Results
Diagnostic performance of the symptoms. The pooled overall Se of the diagnostic symptoms in confirming AA in children was 79% (95% CI=65%-91%) (Figure 1). Se exceeded 79% for 12 diagnostic symptoms, and the five best diagnostic symptoms (vertigo, jaundice, drugs for abdominal pain, previous abdominal surgery, type of pain) showed 100% Se in diagnosis of AA (Figure 1). The pooled overall Sp of the symptoms for detecting AA was only 29% (95% CI=16%-45%) (Figure 2). Ten symptoms showed Sp higher than 29%, whereas the best five symptoms (location of initial pain, location of pain at diagnosis, relieving factors, vomiting, previous abdominal diseases) showed Sp varying between 64-97% Sp (Figure 2).

Pooled sensitivities of the clinical symptoms in acute appendicitis in children (random-effects model). ES: Estimated sensitivity; CI: confidence interval.

Pooled specificities of the clinical symptoms in acute appendicitis in children (random-effects model). ES: Estimated specificity; CI: confidence interval.
Diagnostic performance of the signs and tests. The pooled overall Se of the signs and tests for detecting AA in children was 74% (95% CI=55%-90%) (Figure 3), while ten diagnostic signs and tests had Se exceeding 74%. The five most accurate signs and tests (colour, scar, distension, mass and urine) showed Se in the range of 98-100% Se (Figure 3). The pooled overall Sp of the signs and tests was only 50% (95% CI=27%-73%) (Figure 4), and ten signs and tests showed Sp higher than 50%. The five most accurate diagnostic signs and tests (mood, abdominal movement, rigidity, Murphy’s positive and bowel sounds) had Sp of 83-100% (Figure 4).

Pooled sensitivities of the clinical signs and tests in acute appendicitis in children (random-effects model). ES: Estimated sensitivity; CI: confidence interval.

Pooled specificities of the clinical signs and tests in acute appendicitis in children (random-effects model). ES: Estimated specificity; CI: confidence interval.
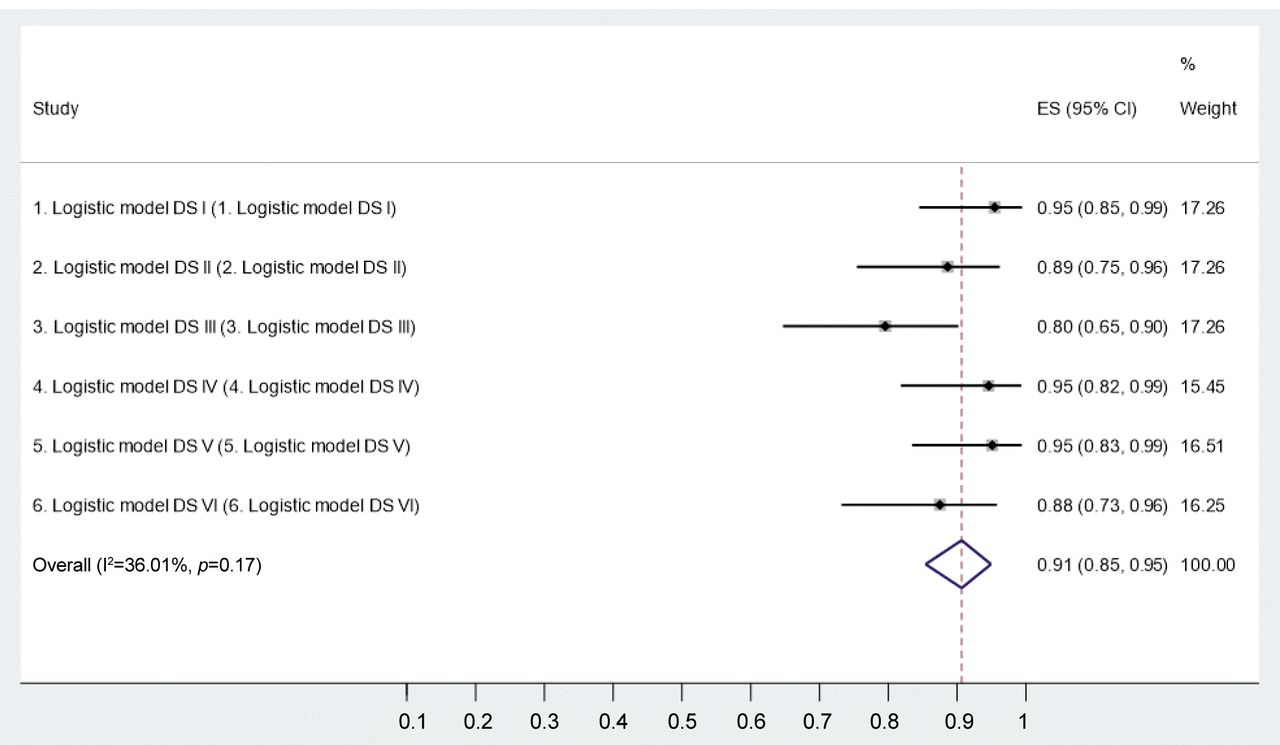
Diagnostic performance of the DS formulas. The pooled overall Se of the DS formulas for AA in children was 91% (95% CI=85-95%). The best three DS models (DS I, DS IV and DS V) had Se of 95%. The pooled overall Sp of the DS formulas for confirming AA was 88% (95% CI=85-91%), with the best three DS models (DS III, DS IV and DS VI) with Sp of 90-92% (Figures 5 and 6).

Sensitivities of diagnostic scores at six different cut-off levels (DS I-VI).
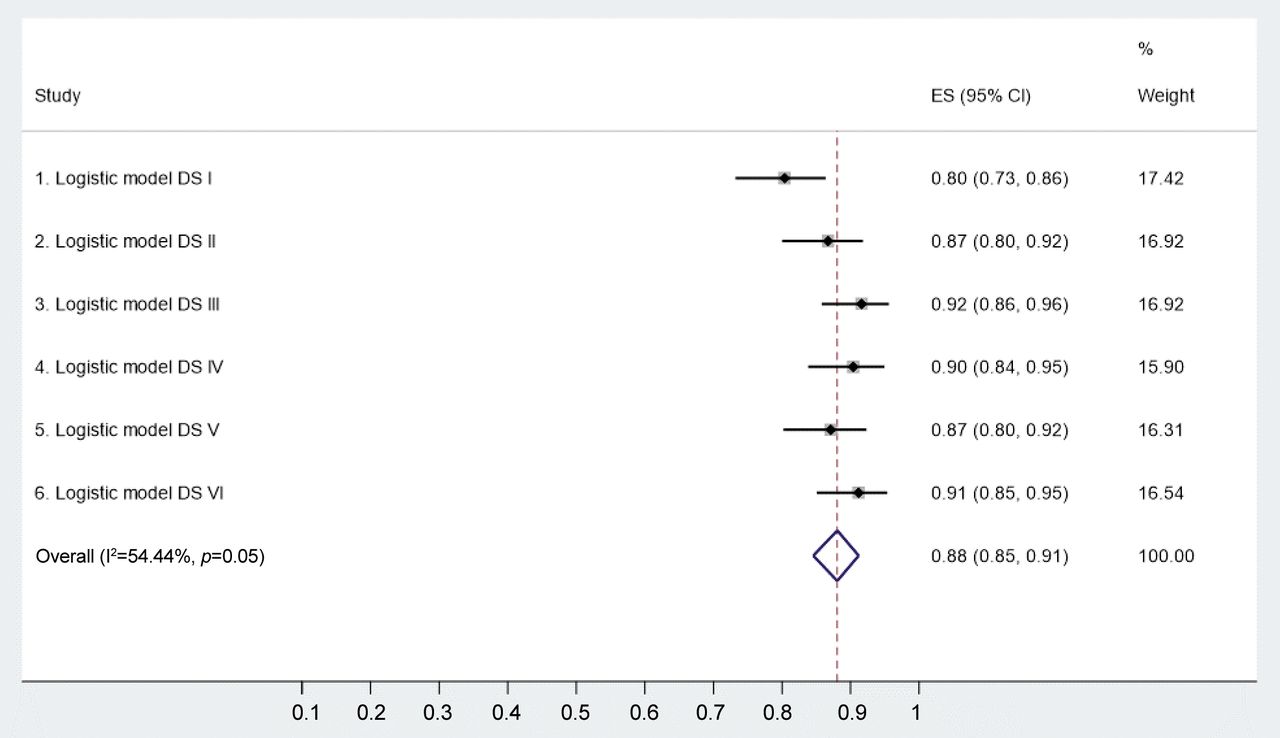
Specificities of diagnostic scores at six different cut-off levels (DS I-VI).
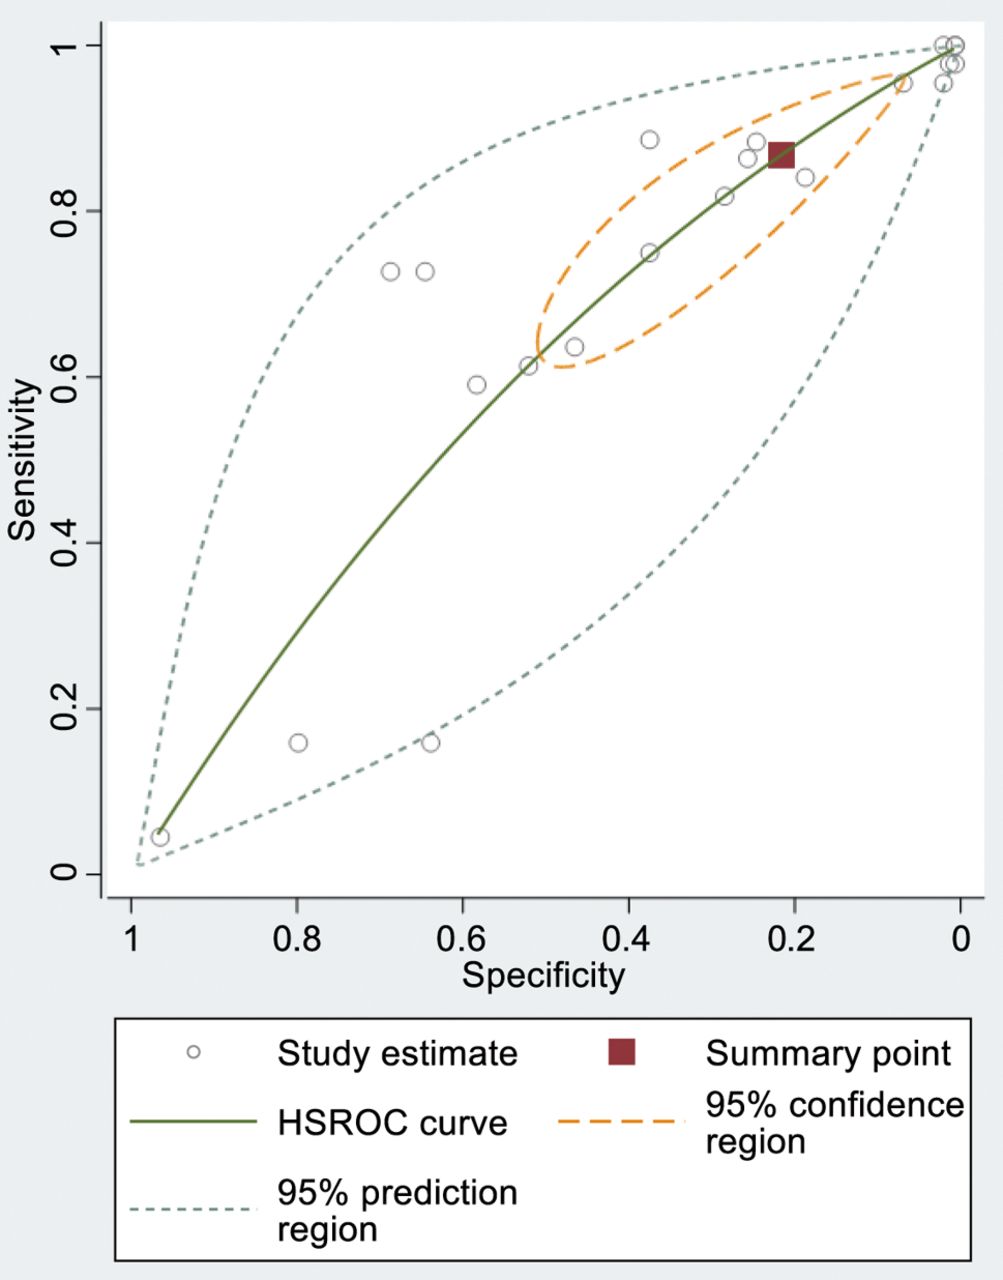
HSROC analyses and empirical Bayes (EB) estimates. STATA (metandiplot algorithm) was used to draw the HSROC curves and EB estimates to visualise and compare the pooled overall diagnostic performance of the different symptoms, signs, tests and the DS formulas in diagnosis of AA (Figures 5, 6, 7, 8 and 9). Based on comparisons of the HSROC AUC values, i) the common clinical findings, as well as ii) signs and tests, were significantly inferior to iii) the AUC values reached by the DS formulas as follows: between Figure 7 (AUC=0.594, 95% CI=0.550-0.634) and Figure 8 (AUC=0.734, 95% CI=0.680-0.788), p=0.0055 (ROC comparison test); between Figure 7 (see above) and Figure 9 (AUC=0.952, 95% CI=0.930-0.968), p=0.0001; between Figure 8 and Figure 9, the difference is also highly significant (p=0.0001).
Hierarchical summary receiver operating characteristic (HSROC) curve of the symptoms.
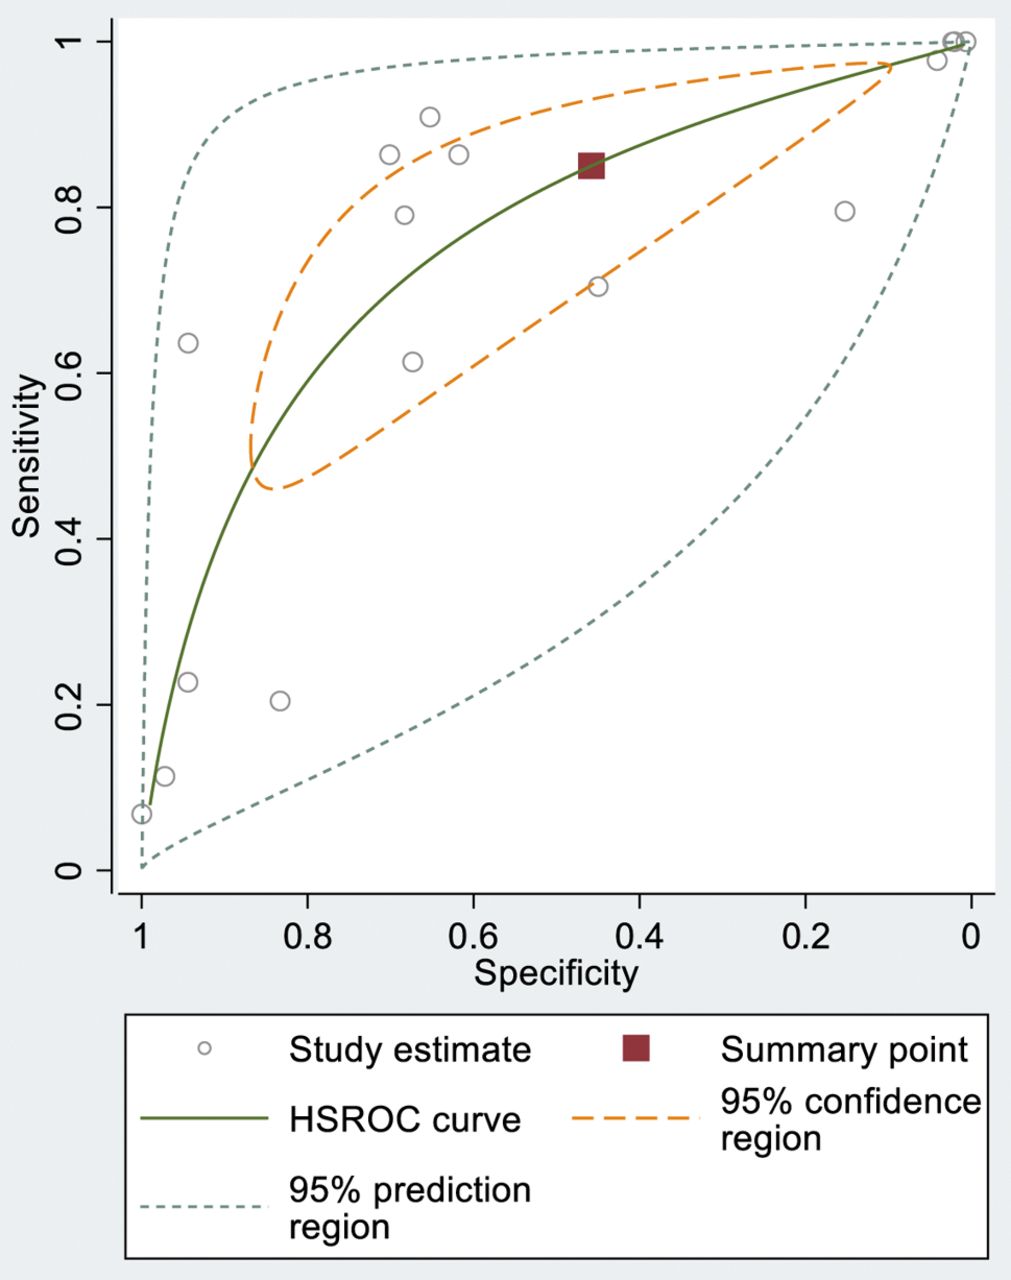
Hierarchical summary receiver operating characteristic (HSROC) curve of the signs and tests.

Hierarchical summary receiver operating characteristic (HSROC) curve of the six DS.
Discussion
The diagnosis of AA in children is traditionally made on the basis of common clinical findings, supported by signs and laboratory tests (15, 16). Clinical findings of AA in children include right lower quadrant pain and tenderness, nausea, vomiting, fever and poor appetite. The differential diagnosis of AA in children can be difficult and may include several different diseases (11-14).
Albeit AA is a common cause of AAP in children, the accuracy of DS in diagnosis of AA in children has not been critically evaluated (15, 16). To cast further light on this issue, the present study was designed to conduct a detailed analysis of the relative accuracy of i) the common clinical findings, ii) signs and tests, as compared with iii) the DS, to establish whether the DS could improve the diagnostic accuracy of AA in children. Of interest was to compare the diagnostic performance of the symptoms, signs and tests among the AA in children to those of adult AA patients, reported in our recent study (14), to see whether the diagnostic accuracy of common clinical findings differs in AA in children and adults. Indeed, this seems to be the case in that the pooled Se of the symptoms in AA in children 79% (95% CI=65-91%) was slightly lower that in AA in adult female and male AA patients; 80% (95% CI=67-90%) and 81% (95% CI=66-92%) respectively. However, the pooled overall Sp of the symptoms in diagnosis of AA in children was 29% (95% CI=16-45%) which was slightly lower than in detecting AA in adult female and male patients; 30% (95% CI=19-42%) and 31% (95% CI=20-43%), respectively. Similarly, the pooled overall Se of the signs and tests in diagnosis of AA in children was significantly lower, 74% (95% CI=55-90%), than that for adult female and male patients; 86% (95% CI=79-92%) and 88% (95% CI=82-94%), respectively. As anticipated, however, the pooled overall Sp of the signs and tests for AA in children was higher, 50% (95% CI=27-73%) than that in detecting AA in adult female and male patients; 34% (95% CI=20-50%) and 34% (95% CI=20-51%), respectively.
When the same comparisons were calculated for the diagnostic accuracy of the DS formulas between children and adult AA patients from our earlier study (14), the trend is quite similar. Indeed, the pooled Se of the DS formulas is quite similar in children 91% (95% CI=85-95%) than in adult female and male patients; 90% (95% CI=85-95%) and 93% (95% CI=88-96%), respectively. Because Se and Sp behave reciprocally, it was not unexpected to find that the pooled overall Sp of the DS in children, 88% (95% CI=85-91%), was slightly higher than that in adult female and male AA patients; 85% (95% CI=74-94%) and 84% (95% CI=74-92%), respectively. Interestingly, the AUC values based on HSROC analysis of the DS in children [0.952 (95% CI=0.930-0.968)] in female [0.953 (95% CI=0.923-0.969)] and male patients [0.956 (95% CI=0.930-0.969)] were very similar.
AUC values based on HSROC comparison test shows that the diagnostic performance of the clinical signs and tests is slightly better than that of the clinical symptoms only (p=0.0055). However, as measured by the AUC values, the DS formula is superior to both i) the clinical symptoms and ii) signs/clinical tests. Recently, Mujica-Guevara et al. (18) validated the Pediatric Appendicitis Score (PAS) and the Lintula Score (8, 9) for AA in children, obtaining AUC values of 0.924 and 0.942, respectively. These authors evaluated a prospective series of 4-15-year-old children admitted to the pediatric emergency department due to AAP. Both scores were rated in each child, and definitive AA diagnosis was confirmed after clinical follow-up or histopathological examination of the appendectomy specimen (18). Altogether, 100 AAP patients were included, with 47 children having confirmed AA. Based on the ROC curve analysis, the optimal cut-off level for the Lintula Score was 20 and that for the PAS score was 6. The authors found no significant differences between these two DS, and encouraged clinicians to use the DS in the clinical evaluation of children with AAP (18).
The present study specifically focused on HSROC analysis and AUC value as the most important DS test characteristics. The main objective of the DS is to separate those children who do need immediate attention from those who do not need urgent management. Previous studies have emphasized the value of LC analysis in AA diagnosis, but LC has certain limitations, including i) variation in the definition of LC cut-off, as well as ii) variations in the duration of abdominal pain in the time of LC testing (19). Previously introduced DS systems including PAS (20), Alvarado (3) and APPEND score (21), all require LC analysis. Our DS differed from those in that LC counting is not needed. Although, the LC analysis is not among the independent predictors of AA in the DS formula, the LC may support the AA diagnosis in children, although the Se and Sp of LC analysis are not particularly high as confirmed in the present series; 79% (95% CI 64-90%) and 68% (95% CI 59-77%), respectively. Furthermore, the diagnostic set-up of AA in children could include early markers of inflammation e.g. blood levels of interleukins (IL-6, IL-8 and IL-10) which were shown to increase even 3-fold in perforated AA (22). However, the current enzyme-linked immunosorbent assay (ELISA) rules out its use as a rapid (POC, point-of-care) test in AA in children (23, 24).
While considering the limitations of our present study, it is to be admitted that the quite low number of AA children (n=44) among all AAP children (n=188) may affect the final results. Therefore, this should be taken in consideration in planning AAP studies in children in the future.
Conclusion
Taken together, our novel DS formula, constructed by including the significant independent predictors disclosed by a multivariate analysis, reached very high diagnostic accuracy [Se/Sp balance; AUC=0.952 (95%CI=0.930-0.968)] in AA among children. Compared with the diagnostic performance of the clinical findings, signs and tests (ROC comparison test), the DS proved to be far superior to both these conventional diagnostic tools in diagnosis of AA in children.
Acknowledgements
The study was funded by the Päivikki and Sakari Sohlberg Foundation.
Footnotes
↵* These Authors contributed equally to this study.
Authors’ Contributions
All Authors contributed to the collection and analysis of data, drafting and revising the manuscript, read and approved the final manuscript.
This article is freely accessible online.
Conflicts of Interest
The Authors report no conflicts of interest or financial ties to disclose. The Authors alone are responsible for the content and writing of this article.
- Received November 25, 2020.
- Revision received December 3, 2020.
- Accepted December 8, 2020.
- Copyright© 2021, International Institute of Anticancer Research (Dr. George J. Delinasios), All rights reserved.
References
In this issue


Jump to section
Related Articles
Cited By...
- Accuracy of Prediction Models in Diagnosis of Acute Diverticulitis
- The ColonView (CV) Quick Test for Fecal Occult Blood Shows Significantly Higher Diagnostic Accuracy in Detecting Distal than Proximal Colorectal Cancer
- The Automatically Analyzed (AA) ColonView (CV) Quick Test for Fecal Occult Blood Shows Higher Diagnostic Accuracy in Detection of Colorectal Adenoma than Visually Analyzed Tests
- The New Generation Immunochemical Test for Fecal Occult Blood (ColonView Quick Test) Shows a High Diagnostic Accuracy in Colorectal Cancer Detection
- A Diagnostic Score (DS) in the Difficult Diagnosis of Non-specific Abdominal Pain (NSAP)
- A Diagnostic Score for Reliable Confirmation of Acute Renal Colic Among Patients With Acute Abdominal Pain
- A Diagnostic Score for Acute Small Bowel Obstruction
- A Diagnostic Score (DS) Is a Powerful Tool in Diagnosis of Acute Appendicitis in Elderly Patients With Acute Abdominal Pain