


Abstract
Background/Aim: The aim of this study was to analyze the expression of nucleolin (NCL) and nucleophosmin (NPM) in prostate adenocarcinoma and in its loco-regional spread in the form of seminal vesicle invasion (SVI). Materials and Methods: The study was performed on tissue microarrays of 40 cases of Gleason 3+4 pT3b prostate cancers including tissue samples from SVI. The expression of NCL and NPM was detected immunohistochemically and analyzed with image analysis software. Results: The expression of NCL and NPM were higher in cancer cells within a prostate gland than in SVI. Gleason 4 pattern showed higher expression of NPM than Gleason 3 pattern cells. Conclusion: Differences in nuclear NCL and NPM expression in cancer cells between the prostate gland and SVI may indicate involvement of these proteins in loco-regional spread of adenocarcinoma of the prostate. Differences in NPM expression in Gleason 3 and Gleason 4 pattern suggest involvement of this protein in the differentiation of prostate cancer.
Prostate cancer is one of the most common cancers in older men. Three-quarters of cases are diagnosed in men older than 65 years and age is one of the most important risk factors (1). In the Polish population prostate cancer has the lowest but increasing prevalence among European countries. It has low 5-year relative survival, lower than average in Europe and it is one of leading causes of cancer deaths in Poland (1, 2). Seminal vesicle invasion (SVI) indicates loco-regional spread of prostate cancer and it is usually defined as a penetration of an adenocarcinoma of the prostate through prostatic capsule into the seminal vesicle wall (3-6). SVI is considered to be associated with occult micrometastatic disease, worse prognosis and lower prostate-specific antigen (PSA) recurrence-free survival, however, it is still not uniformly associated with poor prognosis that is modified by several factors including positive surgical margins and pelvic lymph node metastases (3, 4, 7).
Nucleolin (NLC) and nucleophosmin (NPM) are multifunctional proteins detected mainly in nucleoli but also in nucleoplasm (8-10). NCL and NPM are also found in the cytoplasm while NCL is also found in the plasma membrane (10, 11). Both proteins participate in nucleolus formation and function as chaperons (10, 12). NCL is involved in chromatin remodeling, transcription of rRNA, maturation of tRNA, ribosome biogenesis, DNA replication and repair, and it affects mRNA transcription (8, 11). NPM participates in ribosome biogenesis and nuclear-cytoplasmic protein transport, and regulates activity of many tumorigenic factors such as p53 and ARF (13, 14). These proteins also interact with each other (10). Altered expression of NCL and NPM was found in many diseases including cancer. NCL expression was studied in breast cancer (8, 9), colon cancer (15), gastric cancer (16), pancreatic cancer (17), lung cancer (18) and testicular tumors (19) while NPM expression in many malignant solid tumors (13) including testicular tumors (19), breast cancer (20), renal tumors (21), thyroid tumors (22) and colon cancer (23).
NCL and NPM are the main proteins that form argyrophilic nucleolar organizer regions (AgNOR) that can be detected by silver staining of histological slides. Several groups of researchers studied AgNOR in different prostatic lesions (24-31). Benign prostate hyperplasia showed a lower number of AgNOR per nucleus than prostatic intraepithelial neoplasia (PIN) and invasive carcinoma, however, in many studies no differences between PIN and invasive cancer were found (25, 27, 28). Also, AgNOR parameters showed differences between low and high-grade prostate cancers (24, 29, 30). This may indicate that AgNOR-related proteins might be involved in carcinogenesis of prostate cancer. There are few published studies on NCL and NPM expression in prostate cancer.
NCL has been used as a co-marker of prostatic cancer cells for detecting circulating cancer cells in blood (32) or cells in urine sediments (33). Chalfin et al. (32) have focused on detecting circulating tumor cells in blood samples of 3 men with metastatic prostate cancer. A combination of anti-nucleolin with anti-pan-keratin antibodies with several negatively selecting antibodies were used to detect cells considered to be circulating prostate cancer cells. They considered that the combination of the epithelial marker (Pan-keratin) with nucleolin was sufficient for detecting circulating cancer cells. Fujita et al. (33) have analyzed urine sediments after prostatic massage in 27 cancer-positive men stained with multiplex antibodies for Nkx3.1, the prostate-specific marker, AMACR and nucleolin. This multiplexing approach had very high specificity for detecting prostate cancer cells (100%) but quite low sensitivity (33%). The number of cases with circulating cancer cells identified by immunofluorescence was much higher for Gleason 4 pattern.
Some authors focused on NPM in prostatic lesions have shown higher NPM expression in cancerous than in benign prostate tissue (34, 35). Partin et al. (34) have developed the monoclonal antibody PRO: 4-216 against isolated nuclear matrix protein that stained a higher number of cancerous prostate tissues than BPH (benign prostate hyperplasia) and normal tissue. A study by Subong et al. (35) has proven that PRO: 4-216 antibody detected NPM and this protein was suggested to be a potential marker of prostate cancer cells. Dai et al. (36) have found higher levels of anti-NPM antibodies in serum of patients with prostate cancer than of healthy ones or ones with BPH. Interestingly they found anti-NPM antibodies levels be more specific for detecting prostate cancer than PSA (prostatic specific antigen) levels. NPM was found to be phosphorylated by ERK1/2 kinase and CK2 kinase and to bind to androgen receptor in prostate cancer cells (14, 37-39).
To evaluate the possible involvement of NCL and NPM in prostate cancer progression, we analyzed the expression of these proteins in primary prostate cancer of relatively unified Gleason grade (3+4) and in prostate cancer cells infiltrating seminal vesicles (pT3b).
Materials and Methods
Between April 2015 and January 2018 year, 589 cases of radical prostatectomy specimens were pathologically examined in the Department of Pathology, 2nd Clinical Hospital, Pomeranian Medical University, Szczecin, Poland. We routinely separate seminal vesicles from the base of the prostate and section them from the base. We reviewed one to three sections of seminal vesicles. Of these 589 specimens, 52 cases showed SVI (8.8%). For further study, we selected 40 cases of adenocarcinomas of the prostate, Gleason 3+4 with SVI, and pT3bN0M0 (6.8%). We excluded from the study cases of Gleason pattern different than 3+4 (usually higher ones) and cases with pelvic lymph node metastasis. According to the literature, we defined SVI as a direct extension of the prostate cancer through the base of the prostate into seminal vesicles with their muscular invasion (3-6). All tissue samples for routine pathologic diagnostic evaluation were formalin-fixed and paraffin embedded. Selected cases were lymph node-metastases and distal-metastases negative. Cases were reviewed by one pathologist (MM) and representative slides and paraffin-embedded tissue blocks were selected for constructing tissue microarrays (TMA). In slides of prostate cancers studied areas of Gleason 3 and Gleason 4 patterns and areas of seminal vesicles infiltration were selected. Based on hematoxylin – eosin slides (H&E), areas of interest were drawn and three cores of each histologic tumor type were removed from the diagnostic paraffin blocks of each case and inserted into recipient paraffin blocks. In each case three areas of each Gleason pattern and seminal vesicles invasion were sampled for TMA construction. In case of seminal vesicles infiltration, we attempted to avoid seminal vesicle glandular structures and sample only cancer tissue. All further immunohistochemical studies were performed on tissue micro array (TMA) slides.
Each TMA was cut into 3-micrometer sections, deparrafinized and antigens were retrieved for immunohistochemical reactions. After blockage of endogenous peroxidase, sections were incubated with primary antibody. Two mouse anti-human antibodies were used for detecting nucleolar proteins: anti-nucleolin monoclonal antibody; clone 4E2; 1:2000 dilution; (Abcam, Cambridge, UK) and anti-nucleophosmin monoclonal antibody; clone FC82291; 1:2500 dilution (Abcam). For optimal visualization of the protein studied, several antigen retrieval procedures were tested and antibodies were titrated. Immunohistochemical reactions were visualized with EnVision FLEX/HRP (Dako, Glostrup, Denmark). Sections were counterstained with hematoxylin, dehydrated and sealed with coverlips. One section of each TMA was also stained with hematoxylin and eosin for microscopic control of cores quality. Slides were immediately scanned with ScanScope slide scanner (Aperio Technologies Inc., Vista, CA, USA) and the analyses of immunohistochemical reactions were performed with Aperio ImageScope software (Figure 1). Regions of interest were drawn manually around core sections to avoid missed cores or areas of stromal tissue. At least two core sections were analyzed in each case. The expression of proteins was analyzed as mean of percentages of all positive cells, percentages of cells in three groups of intensity of reaction: +3, +2, +1 as well as of H-score. H-score was calculated with the following formula: H-score=(% of +3-positive cells × 3) + (% of +2-positive cells × 2) + (% of +1-positive cells).
The study was approved by the Bioethical Commission of the Pomeranian Medical University in Szczecin (approval number KB-0012/269/09/18).
Data distribution was tested with Shapiro-Wilks test and non-parametrical tests were used for finding differences between groups. p-Value of less than 0.05 indicated statistical significance. All analyses were performed with STATISTICA for Windows 13.1 (StatSoft, Krakow, Poland).
Results
Mean age of patients was 64.2±5.3 year. Mean percentage of cancer tissue in both lobes sections was 28.3±15.4%. The mean number of cells analyzed for nucleolin (NCL) expression in prostate gland cancers and in seminal vesicle infiltration was 7858±3128 and 3822±1741 respectively, while for nucleophosmin (NPM) expression, it was 4119±1463 and 3220±1670 respectively.
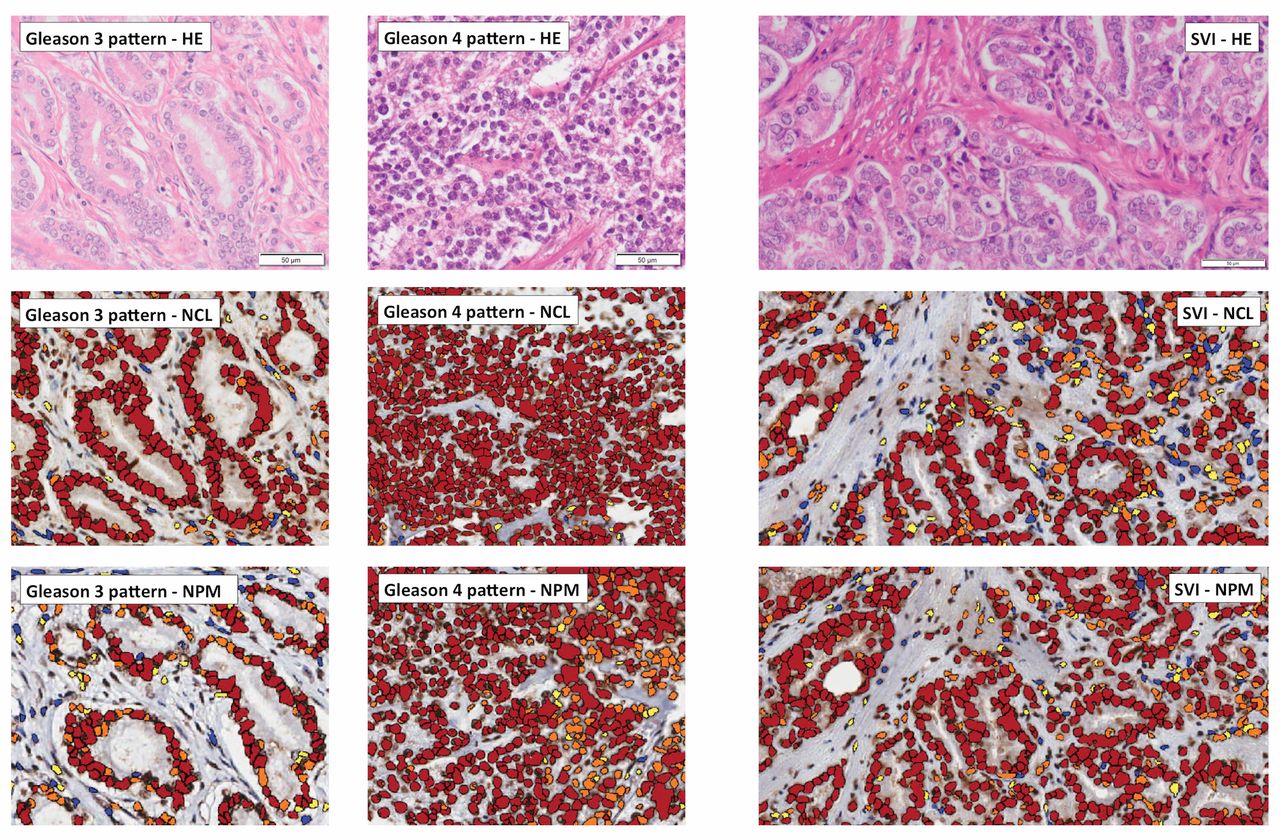
The expression of nucleolin (NCL) and nucleophosmin (NPM) in adenocarcinoma of the prostate of Gleason 3 and Gleason 4 patterns and in the seminal vesicle invasion (SVI). HE: Hematoxylin-eosin stain; NCL: image analysis of immunohistochemically-detected NCL expression; NPM: image analysis of immunohistochemically-detected NPM; SVI: seminal vesicles invasion.
Nucleolin (NCL) expression in prostate cancer and prostate cancer infiltrating seminal vesicles. We analyzed NCL expression in prostate cancer cells confined to prostate gland and in cells infiltrating seminal vesicles. We also compared NCL expression in prostate cancer cells in Gleason 3 pattern and Gleason 4 pattern.
We found higher NCL expression in prostate cancer cells within the prostate gland than in infiltrated seminal vesicles as indicated by the H-score (p=0.000006) as well as the percentage of NCL-positive cells (p=0.00000001). We analyzed subpopulations of NCL-positive cells with high (+3), medium (+2) and low (+1) NCL expression. Percentages of highly (+3) and medium (+2) positive subpopulations of cells were higher in cancer cells confined to prostate gland than in cells infiltrating seminal vesicles (p=0.003 and p=0.0004 respectively). Percentage of low (+1) positive and NCL-negative cells was higher in cells within infiltrated seminal vesicles than in cells within prostate gland (p=0.01 and p=0.0000001 respectively; Table I).
We found no differences in NCL expression between the two prostate cancer histologic patterns studied. Gleason 3 and Gleason 4 patterns did not show differences in NCL expression represented either by H-score or percentages of NCL-positive cells and percentages of subpopulations of NCL-positive cells (data not shown).
Nucleophosmin (NPM) expression in prostate cancer and prostate cancer infiltrating seminal vesicles. We also analyzed NPM expression in prostate cancer cells within the prostate gland and infiltrated seminal vesicles as well as its expression in prostate cancer cells of Gleason 3 and Gleason 4 patterns.
We found higher NPM expression in prostate cancer cells within the prostate gland than within infiltrated seminal vesicles as indicated by H-score (p=0.0006) as well as the percentage of NPM-positive cells (p=0.00001). Similarly to NCL expression analysis, we analyzed subpopulations of NPM-positive cells with high (+3), medium (+2) and low (+1) NPM expression. NPM expression was significantly higher in cancer cells confined to prostate gland than in cells infiltrating seminal vesicles only for medium (+2)-positive cells (p=0.0003) while the percentage of NMP-negative cells was higher in cells infiltrating seminal vesicles than in cells within the prostate gland (p=0.00001; Table II).
Differences in NCL expression in prostate cancer cells within the prostate gland and in cells of SVI.
Differences in NPM expression in prostate cancer cells within the prostate gland and in cells of SVI.
Prostate cancer cells of Gleason 4 pattern showed higher expression of NPM as indicated by the H-score than Gleason 3 pattern cells (p=0.02). We found no differences in the percentages of NPM-positive cells and NPM-negative cells between the two histologic patterns studied (p=0.17). However, we found differences in subpopulations of NPM-positive cells between these two architectural patterns. Cancer cells of Gleason 4 pattern showed higher population of highly (+3) positive cells and lower populations of medium (+2) and low (+1)-positive cells (p=0.007, p=0.02 and p=0.006 respectively; Table III).
Discussion
The percentage of adenocarcinoma of the prostate cases with SVI in the analyzed group was 8.8% (6.8% for cases included in the study) and it was similar to the percentage of SVI cases in other studies where it ranged from 3.9% to 12.7% (3, 4, 7). However, in the current era, (prostate-specific antigen era) the percentage of SVI and stage pT3b prostate cancer is decreasing (7).
Differences of NCL and NMP expression in prostate cancer cells confined to prostate gland and cells infiltrating seminal vesicle. We showed, for the first time, the expression of nucleolin (NCL) and nucleophosmin (NPM) in the loco-regional spread of prostate cancer. Both NCL and NPM showed lower expression in cancer cells of SVI as a percentage of positive cells and as H-score. We also found differences in subpopulations of cells with different expression of NCL and NPM in prostate cancer cells in prostate gland and in SVI. Percentages of high (+3) and medium (+2) NCL-positive cells and percentage of medium (+2) NPM-positive cancer cells were higher within the prostate gland while percentage of low (+1) NCL-positive, NCL-negative and NPM-negative cells were lower within the prostate gland than in cancer cells of SVI. Our results suggest that the subpopulation of cells with lower expression of NCL and NPM show higher local infiltrating potential. Goel and Garg (25) have analyzed 6 cases of organ-confined and locally advanced prostate cancer and 5 cases of metastatic ones and they showed higher number of AgNOR in metastatic cases. However, they studied only section of prostate tissue in both non-metastatic and metastatic cases but not tissue samples from metastatic foci. A higher number of AgNOR may not represent the true amount of AgNOR-related proteins as no additional parameters in addition to the AgNOR area was analyzed (9, 40). Wu et al. (15) have studied the distribution of NCL in metastatic colon cancer. They found lower nuclear NCL expression related to metastatic potential of cancer cell. The lowest NCL expression was found in liver (distant) metastases while lymph node metastases (local) showed higher expression and the primary tumor has the highest nuclear NCL expression. They assumed that changes in subcellular nucleolin distribution and lower nuclear NCL expression is positively related to metastatic process of colorectal cancer. Qiu et al. (16) have analyzed the expression of nucleolin in 124 cases of gastric cancer and found NCL overexpression as the only independent prognostic factor of better survival and low nuclear NCL expression as a prognostic factor of worse prognosis. The analysis of 69 cases of pancreatic ductal adenocarcinomas by Peng et al. (17) showed significantly longer overall survival of patients with high nuclear NCL expression. Interestingly, the authors found no differences between low-NCL and high-NCL expression cancers in relation to lymph node status, local recurrence and distant metastases, however, it is one of the few studies where authors stratified NCL expression into two groups. The results of the study by Xu et al. (18) on 225 cases of non-small cell lung cancer showed that high expression of nuclear NCL was associated with longer disease-free survival but unfortunately with shorter overall survival. The lower nuclear expression of NCL in SVI cancer cells found in our study is in concordance with the results of the above-mentioned studies. However, we also showed that the subpopulation with lower expression of NCL might be more invasive than the highly expressing one.
Differences in NPM expression in prostate cancer cells of Gleason 3 and Gleason 4 pattern.
NPM expression was studied in many malignant solid tumors. Most of the studies showed correlation of overexpression of NMP with poor prognosis (13), however, some authors showed different effects of NPM expression in malignant tumors or in benign vs. malignant ones. Karhemo et al. (20) have studied a large group of breast cancers and they found reduced expression of NMP to be related to poor prognosis while overexpression of NPM caused reduction in the growth of breast cancer cell lines. Studies on renal tumors showed higher nuclear NPM expression in less aggressive tumors as papillary and chromophobe cancer than in more aggressive sarcomatoid carcinoma (21) while thyroid tumor studies showed higher NPM expression in benign follicular adenoma than in undifferentiated carcinoma (22). These results may indicate that the tumorigenic role of NPM is complicated and probably tissue specific. We focused on analyzing the expression of NPM only in loco-regional spread of prostate cancer to seminal vesicles. The results of our study suggest that prostate cancer cells invading seminal vesicles show lower expression of NPM. Liu et al. (23) have analyzed NPM expression in colon cancer and in its metastases in lymph nodes. They found higher number of NPM-positive cells in cases with lymph node metastases, however, they described the NPM expression in clinical samples only as “positive” or “negative”. We showed NPM expression in all cases of loco-regional spread of prostate cancer with variation in the levels of NPM expression and the subpopulation of NPM-positive cells.
Differences in NCL and NPM expression between prostate cancers of different Gleason grade. No differences of NCL expression were found between Gleason 3 and Gleason 4 pattern, however, NPM expression showed some differences between these two histological patterns. Higher expression of NPM and higher percentage of highly (+3) NPM-positive cells were found in Gleason 4 pattern while higher percentages of medium (+2) and low (+1) NPM-positive cells were found in Gleason 3 pattern. There is no published data focused on the expression of these proteins in prostate cancer in regard to Gleason grade. Since NCL and NPM are main proteins of AgNOR, some studies on these regions in prostatic lesions can be discussed in relation to our current results. Gupta et al. (26) have studied 50 cases of various prostatic lesions including 30 cases of cancers. They found insignificant differences in AgNOR number between low-grade, intermediate-grade and high-grade cancer, however, the number of AgNOR increased with grade of tumor. The low number of high-grade tumors studied (4 cases) might significantly influence their statistical analysis. In studies by Ghazizadeh et al. (41) the mean AgNOR count increased with increasing Gleason grade. Also, Sakr et al. (30) have shown differences in AgNOR count between Gleason grades. Helpap and Riede (27) have found significant differences in AgNOR number per nucleus between low- and high-grade prostate cancers with higher number in high grade ones. Stepan et al. (31) have analyzed AgNOR parameters in 22 prostate cancers equally distributed from Gleason 2 to Gleason 5. They found a tendency for higher number of AgNOR in Gleason 4 and 5 patterns while only multi-parameter fractal dimensions analysis showed higher AgNOR parameters in Gleason 4 and 5 patterns than in Gleason 2 and 3 patterns. The study by Munda et al. (29) showed correlation of AgNOR with Gleason grade only when it was combined with expression of p53 and bcl-2 in a mathematical model. We emphasize again that higher number of AgNOR may not strictly represent the true amount of AgNOR-related proteins. However, due to main localization of NCL and NPM in nucleoli these proteins may be considered indicators of nucleoli (8, 33, 40) that are altered in prostatic cancer (42). The higher percentage of cells with nucleoli observed in high-grade tumors (27) especially in high-grade cancer compared to grade 3 cancer (42) may be caused also by higher expression of NMP in Gleason grade 4 cancer as found in our study.
Differences in NCL and NPM expression in cancer cells between the prostate gland and SVI may indicate involvement of these proteins in loco-regional spread of adenocarcinoma of the prostate. It may be assumed that cells with different levels of NCL and NPM expression show different infiltrating potential. Differences in NPM expression in Gleason 3 and Gleason 4 pattern suggest involvement of this protein in differentiation of prostate cancer. Further studies are required for explaining the role of these two proteins in invasiveness of prostate cancer cells.
Acknowledgements
The Authors are thankful to Ms. Maria Abrantowicz MA, for selecting slides and paraffin blocks from the archive and to Ms. Władysława Surma for technical assistance in scanning slides.
Footnotes
Authors' Contributions
Marek Masiuk – study design, data collection and interpretation, statistical analysis, manuscript preparation and literature search; Magdalena Lewandowska – study design, data collection; Ewa Dobak – data collection; Elzbieta Urasinska – manuscript preparation and funds collection.
Conflicts of Interest
The Authors declare no conflicts of interest regarding the publication of this article.
- Received February 24, 2020.
- Revision received March 9, 2020.
- Accepted March 10, 2020.
- Copyright© 2020, International Institute of Anticancer Research (Dr. George J. Delinasios), All rights reserved


