


Abstract
Background/Aim: Tumour-associated macrophages (TAMs) are highjacked M2-polarized macrophages that especially promote pancreatic cancer growth. The aim of this study was to identify an easy-to-use cell culture model suitable for studying this interaction and macrophage polarization. Materials and Methods: Co-cultures of two cell lines, PDA6606 cells with RAW macrophages cells were used in vitro and in ovo. Macrophages were analyzed by microscopy, magnetic resonance imaging (MRI), and flow cytometry. Results: By comparing chemically-induced M1 and M2 macrophages, a clear induction of the M2 phenotype of RAW macrophages by PDA6606 pancreatic cancer cells was observed in vitro. In ovo, PDA6606 cells and conditioned media polarized macrophages to the M2 phenotype, which in turn promoted tumour growth and angiogenesis via their surface marker profiles and VEGF production. Conclusion: PDA6606 pancreatic cancer cells expectantly and potently induced M2 polarization of RAW264.7 macrophages. This model may be used to study pancreatic cancer-macrophage plasticity in e.g. drug research in vitro and in ovo.
Macrophages are cells with high plasticity that can adapt their profile according to specific environmental stimuli (1-3). Two extremes of macrophage activation continuum have been designated: M1 and M2. The M1 phenotype can be induced by IFNγ alone or combined with microbial products, such as lipopolysaccharide (LPS). M1 cells release pro-inflammatory cytokines, such as tumour necrosis factor alpha (TNF-α), interleukin (IL)-12, and IL-23. They express high levels of major histocompatibility complex (MHC) molecules and inducible nitric oxide synthase (iNOS), and can be cytotoxic against neoplastic cells (4). M2 or ‘alternatively activated’ macrophages are induced by e.g. TH-2 type cytokines, such as IL-4, IL-10, and IL-13 (5). These cells release anti-inflammatory cytokines, such as IL-10, express high levels of arginase and scavenger receptor A (including mannose receptor, CD206), have poor antigen-presenting capability but enhanced debris clearance ability, which is important for promotion of wound-healing and angiogenesis (6).
Tumour-associated macrophages (TAMs) and M2 macrophages share tumour-promoting functions and surface markers (7). Their presence is associated with poor prognosis and survival of patients with several types of cancer (8). The current understanding is that tumour cells highjack macrophages and utilize their M2-associated properties to fuel tumour growth. Hence, studying macrophage polarization by tumour cells has been a heavily investigated research field in the last decade (9-11). Two major points of investigation are i) whether macrophage polarization can be reverted to e.g. an M1 phenotype, and ii) how tumour cells are able to induce the M2 phenotype in TAMs and use them for their benefit.
TAMs are especially important for fostering tumour metastasis, which is responsible for the poor prognosis of pancreatic cancer patients (12). Pancreatic cancer is a malignancy that ranks 4th in terms of fatality among all cancer types. Our previous research has shown the importance of M2 macrophages in supporting tumour growth in vitro and in vivo (13). In vivo depletion (efficacy of about 80%) of these macrophages resulted in abrogated tumour growth and decreased blood vessel density within the tumour microenvironment. The remaining tumour-resident macrophages in both the non-depleted and depleted animals were of the M2-phenotype. In vitro, a polarization towards an M2 phenotype was observed in primary murine macrophages upon co-culture with murine PDA6606 pancreatic cancer cells. Experiments using primary cells are of high importance, but recent developments in biomedical research calling for implementation of the 3-R principles (animal replacement, refinement, and reduction) require alternative models. Accordingly, the acquisition of the M2 phenotype by the murine macrophage cell line RAW264.7 upon co-culture with murine PDA6606 pancreatic cancer cells was examined as a novel research tool for investigating tumour-promoting macrophages.
Materials and Methods
Chemically-induced macrophage differentiation. Murine RAW264.7 (RAW) macrophages (ATCC TBI-71) were cultured in Roswell-Park-Memorial-Institute medium (RPMI1640; Pan BioTech, Aidenbach, Germany) supplemented with 10% fetal bovine serum (Sigma, Taufkirchen, Germany) and 2% penicillin/streptomycin (Pan-BioTech, Aidenbach, Germany). For differentiation, cells were stimulated with M-CSF (20 ng/ml) for 48 h, followed by a 72-h stimulation with either interferon (IFN) γ (0.3 μg/ml; Sigma, Taufkirchen, Germany) to obtain M1 macrophages or IL4 (40 ng/ml) and IL13 (40 ng/ml; both from Sigma, Taufkirchen, Germany) for M2 polarization. Together with non-stimulated (M0) macrophages, these cells served as controls in several experiments. PDA6606-induced macrophage differentiation
The murine pancreatic ductal adenocarcinoma cell line PDA6606 (source: Prof. Tuveson, Cambridge, UK) was cultured in fully supplemented RPMI1640. For co-culture with macrophages, varying concentrations of PDA6606 were seeded in 6-well plates. After overnight incubation, 1×10⁵ macrophages were added, and assayed at the indicated time points. For transwell-assays, macrophages were not added directly to PDA6606 cultures but instead into a transwell (Nunc, Roskilde, Denmark) for up to 72 h, physically separating the two cell types from each other while allowing the exchange of soluble mediators through the cell culture medium. In a third setting, RAW264.7 macrophages were cultured for up to 72 h with varying concentrations of supernatants of PDA6606 cells that were obtained only after overnight culture, to minimize nutrient depletion. The medium contained phenol-red and was still red-pink after collection (data not shown). Cells were characterized by microscopy and flow cytometry.
Microscopy. Brightfield images of 6-well plates were acquired with a 5× objective using an inverted microscope (Observer Z1; Zeiss, Jena, Germany). Quantitative image analysis was performed using Image J 1.8 to assess the size of macrophage cell clusters at 3 days of culture (3d). For co-cultures with fluorescently-labelled macrophages (stained with 1 μM cell trace red for 30 min prior (ThermoFisher, Dreieich, Germany)), 1×10⁴ RAW264.7 cells were added to 1x10⁴ PDA6606 pancreatic cancer cells grown in 96-well plates and incubated overnight. The plate was imaged at different time points using an Operetta CLS high content imaging device (PerkinElmer, Hamburg, Germany), and overlay images were retrieved using Harmony 4.8 software (PerkinElmer, Hamburg, Germany). This software was used to quantitatively assess cluster size in an algorithm-based manner at several incubation time points. In principle, cell trace red-positive macrophages were segmented and events <500 μm2 (representing single cells or small clusters) were excluded before the sum of the remaining area was calculated. Several hundred images were used for analysis. For immunofluorescence, tumours were explanted and embedded in OCT prior to conservation in liquid nitrogen. Tissue sections were generated using a cryotome (ThermoFisher, Dreieich, Germany), fixed (PFA 4%) and permeabilized (0.1% Triton X100), and nuclei were counterstained with 4’,6-Diamidin-2-phenylindol (DAPI; Sigma, Taufkirchen, Germany). Additionally, macrophages were labelled either using an anti-CD11b antibody conjugated to Alexa Fluor 488 or using antibodies against CD206 (Alexa Fluor 488) or VEGF (Alexa Fluor 647; all BioLegend, London, UK). Tissue sections were mounted using vectashield mounting medium (VWR, Darmstadt, Germany), and images were acquired by a fluorescence microscope (BZ-9000; Keyance, Neu-Isenburg, Germany) and evaluated with BZ-II-Analyser 4.6.2.2 software (Keyence, Neu-Isenburg, Germany).
Flow cytometry. For determining the RAW264.7 polarization type, multicolour flow cytometry was utilized. Cells were collected into 12×75 mm tubes (Sarstedt, Nuembrecht, Germany), washed, and stained with monoclonal antibodies (depending on the assay) against the following macrophage markers: Ly6C, CD206, F4/80, CD68, CD11b, FcεR, CD115 (all from BioLegend, London, UK) or EGR2 (BioTechne, Wiesbaden, Germany). In some assays, intracellular staining was performed against iNOS or arginase-1 (all from BioLegend, London, UK) in cells that were fixed (fixation buffer, BioLegend, London, UK) and permeabilized (permeabilization wash buffer, BioLegend, London, UK). To distinguish RAW264.7 macrophages from PDA6606 pancreatic cancer cells in co-culture samples or mixed-population tumours (see HET-CAM), CD11b was used as a discriminating marker (data not shown). Data were analysed on a Gallios or CytoFLEX S cytometer (Beckman-Coulter, Krefeld, Germany). Data analysis was performed using Kaluza 2.1 software (Beckman-Coulter, Krefeld, Germany).
Chemokine/Cytokine analysis. For quantification of vascular endothelial growth factor (VEGF), a commercially available ELISA kit was utilized according to the manufacturer's instructions (BioLegend, London, UK), and absorption was measured on a M200 multimode plate reader (Tecan, Maennedorf, Switzerland) against a known standard. For screening of PDA6606 supernatants for 13 different chemokines/cytokines, Legendplex assay (BioLegend, London, UK) was utilized. This assay quantifies analytes by flow cytometric quantification of beads carrying antibodies targeted against a single analyte. A secondary, fluorescently-labelled antibody visualizes the analyte if bound on the primary antibody linked to the bead. Absolute quantification was achieved using a standard curve of each analyte.
Hen's egg test Chorion-Allantois-Membrane (HET-CAM-Model). The HET-CAM is a model to investigate toxicity of drugs and their effect on vascularization (14). The nervous system of chicken embryos lacks pain perception until day 11 of ontogenesis. Hence, experiments carried out on the carefully-opened CAM up to day 11 do not require permission of ethical committees, making this assay a good alternative to traditional animal experiments. Previously, we have adopted this assay to grow tumour cells on CAM called TUM-CAM (15), as was also done in the present study. Briefly, eggs (pathogen-free; Vakzine Lohmann, Cuxhaven, Germany) were positioned in a horizontally in a hatching incubator (37°C, 65% humidity; Ehret, Mahlberg, Germany) where they were automatically rotated hourly. After 6 days, the top of the eggs was punctured with a sterile needle, sealed with leukosilk tape (BSN medical, Hamburg, Germany), and put in a vertical position for 24 h. Then, eggs were carefully opened and a silicon ring (diameter 0.5 cm) was placed on the CAM. Subsequently, either 2×10⁶ RAW264.7 or PDA6606 cells were suspended in Matrigel (Corning, Wiesbaden, Germany) and added into silicon rings embedded onto the CAM. The RAW264.7 “tumours” served as a control to rule out weight differences, because of the individual growth behaviour of mixed-population (co-culture) tumours. For co-culture, 1×10⁶ RAW264.7 and 1×10⁶ PDA6606 cells were mixed at 1:1 ratio and implanted into the silicon ring on CAM. Either non-stimulated (naïve, M0) or pre-stimulated (M2 polarized) RAW264.7 cells were used. To generate pre-stimulated macrophages, the cells were cultured in vitro for 72 h in PDA6606 cell culture supernatants that was diluted 1:2 with fresh culture medium. This procedure induced a M2 macrophage phenotype. The defect in the eggshell was closed with adhesive tape, and cells were grown for 72 h on the CAM.
Microphotographs, magnetic resonance imaging (MRI), and single cell analysis of tumours. At day 3 after implantation of cells, eggs were put in egg-shaped, pre-warmed metal boxes and photographed using a 10x magnification objective for resolution of vessel structures. For MRI, eggs were cooled on ice for 5 min before data acquisition to inhibit chicken movement. The CAM was scanned in a high field 7.0 T MRI scanner for small animals (ClinScan, 7.0 T, 290 mT/m gradient strength; Bruker, Ettlingen, Germany) as previously described (16). MRI scan analyses were performed in an egg coil filled with ice (Bruker, Ettlingen, Germany) using a T2-TSE (turbo spin echo) sequence. For tumour size assessment, high resolution T2-weighted images of the horizontal plane were used. Generated images were analysed using MIPAV (medical imaging processing and visualisation; National Institutes of Health, Bethesda, MD, USA). For single cell analysis via flow cytometry, the tumours were explanted, weighted, disintegrated with surgical scissors and digested in 95% accutase and 5% trypsin for 30 min at 37°C. Afterwards, suspensions were passed through a 30 μm filter and prepared for multicolour flow cytometry.
Statistical analyses. All experiments were independently repeated 2-4 times with several replicates each. Calculation of mean and standard errors as well as graphing was performed using Prism 8.01 (Graphpad software, San Diego, CA, USA). Statistical comparison between several groups was performed with one-way analysis of variances (Anova). If all groups were tested against a single control group, Dunnett's post-hoc test was performed.
Results
RAW264.7 M0 macrophages can be polarized into M1 or M2 macrophages. It is known that RAW264.7 (RAW) macrophages can be polarized into M1 or M2 macrophages (17). To establish the protocol and positive controls for subsequent assays, RAW cells were differentiated using various factors, as described in materials and methods. Three days after incubation, flow cytometry revealed differences in the expression of CD68, iNOS, and FcεR surface markers among M0, M1, and M2 macrophages (Figure. 1a-c). Specifically, M1 macrophages were positive for iNOS whereas M2 macrophages were positive for FcεR compared to M0 and M2 or M1 macrophages, respectively (Figure 1d-f). CD68 was mainly expressed in M1 macrophages, whereas its expression in M2 macrophages varied among different assays in our study. Hence, CD68 did not serve as an ideal marker to distinguish M1 and M2 from M0 macrophages. Microscopy of all macrophage phenotypes revealed a significant tendency of M2 macrophages to cluster together (Figure 1g-i) as shown in the quantitative image analysis (Figure 1j). Altogether, our results showed that different macrophage types can be discriminated based on morphological and marker expression patterns.
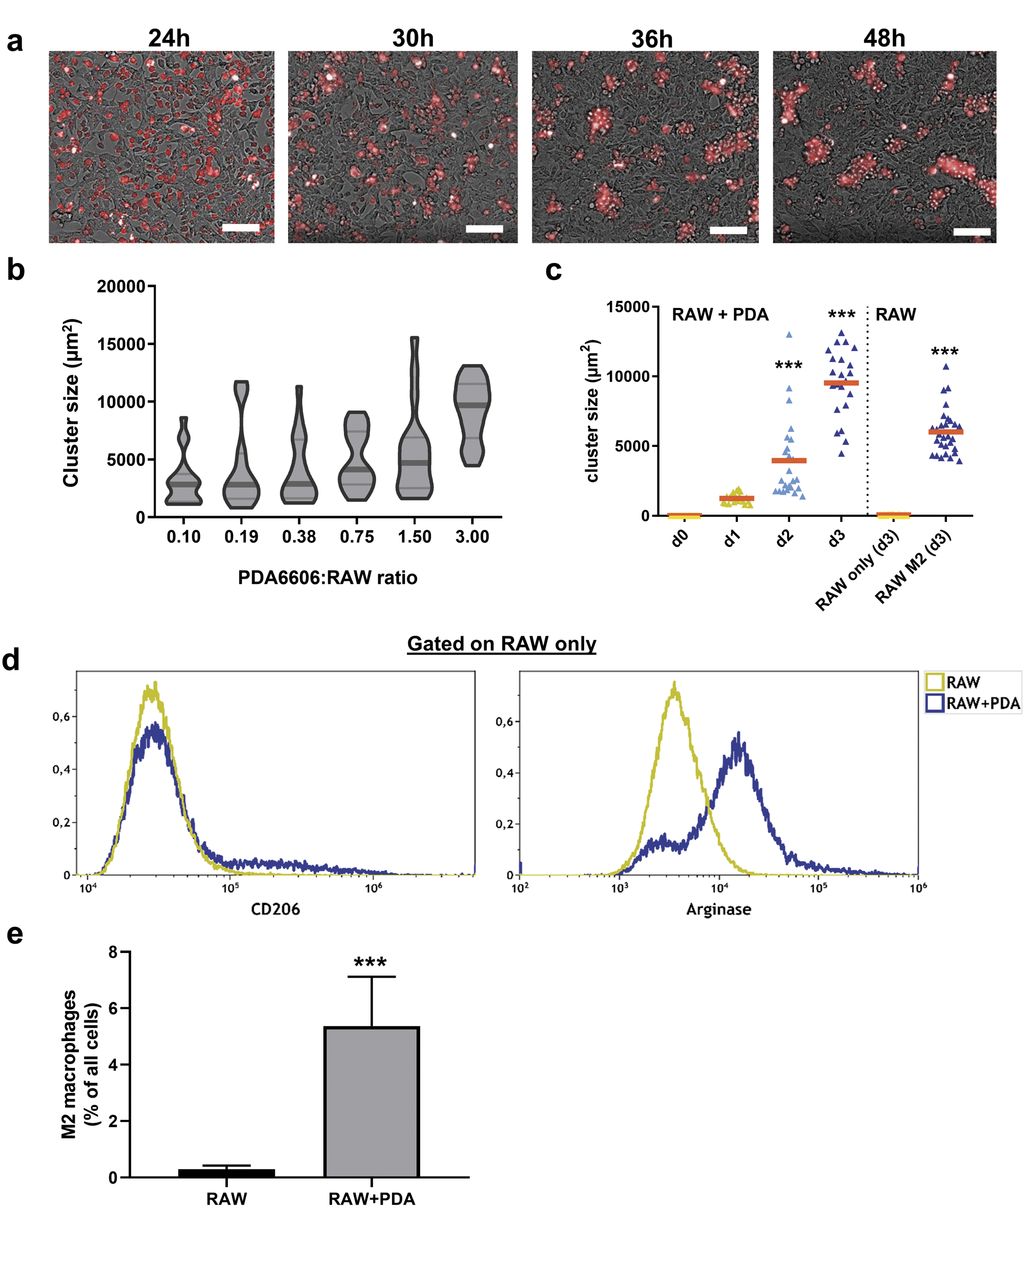
Co-culture of RAW macrophages with pancreatic cancer cells induces the M2 phenotype. Next, co-cultures were setup between RAW macrophages and PDA6606 (PDA) pancreatic cancer cells. By using fluorescently-labelled macrophages, the clustering phenotype (Figure 2a) of M2 macrophages was reproduced (Figure 1j). The extent of clustering was dependent on both the ratio of PDA:RAW cells (Figure 2b) as well as the incubation time (Figure 2c). Clustering was proportional to the PDA:RAW ratio and incubation time (up to 72 h). Clustering was also observed in chemically-induced M2 macrophages but not in non-stimulated M0 macrophages (Figure 2c), serving as a positive and negative control, respectively. To further confirm that PDA cells induced a M2 phenotype in macrophages, co-cultures (PDA:RAW ratio 3:1) were analyzed by flow cytometry at 72 h. Staining for CD206 and arginase showed a subtle and prominent increase, respectively, of RAW cells in the co-cultures compared to RAW monocultures (Figure 2c, d). This was concomitant with elevated numbers of macrophages upon co-culture (Figure 2e).
Secretory products of PDA6606 cells are sufficient to induce M2 polarization in RAW macrophages. The next question was whether direct cell-cell contact is necessary for PDA cells to induce polarization of RAW cells into M2 macrophages. To this end, a transwell assay was setup where both cell types were co-cultured inside one well but were separated by a membrane that allows free diffusion of soluble molecules but disallows physical interaction between the cell types (Figure 3a). The expression levels of several polarization markers were investigated on RAW cells retrieved from co-cultures at 72 h by flow cytometry. Increased expression of CD206 and FcεR, similar to that in chemically-induced M2 macrophages, was observed. iNOS expression was somewhat enhanced upon co-culture but this was negligible on a relative scale considering the 200 fold increase seen with chemically induced M1 macrophages. These results suggested that direct cell-cell contact between RAW and PDA cells was not necessary for polarization of M2 macrophages. To further support this notion, RAW macrophages were incubated with cell culture supernatants obtained from PDA6606 cells. Again, cluster formation was observed (Figure 3b), and flow cytometry confirmed the upregulation of M2 markers on RAW macrophages (Figure 3c) in a concentration-dependent manner when cultured with supernatants from PDA6606 cells. This effect was not observed when RAW macrophages were incubated with normal culture medium (served as normalization control=1). To elucidate, which chemokines and/or cytokines and/or growth factors were present in PDA6606 supernatants that could potentially induce the phenotypic switch from M0 to M2 macrophages, ELISA and multiplex bead array was performed for quantification of 14 analytes in the cell culture supernatant. High concentrations of VEGF (Figure 3d) were observed in the supernatants of PDA monocultures and co-cultures but not (or only at low levels) in RAW culture supernatants. The fact that VEGF is a prominent anti-inflammatory molecule, prompted us to screen for relevant molecules that could potentially be responsible for polarization of macrophages (Figure 3e). Significant levels of MCP-1, KC, and anti-inflammatory TGFβ were identified together with low levels of anti-inflammatory IL-10. In summary, our results indicated that M0 to M2 polarization of RAW264.7 macrophages was facilitated by secretory products of PDA6606 pancreatic cancer cells, presumably via a mix of anti-inflammatory chemokines, cytokines, and growth factors.

Differentiation of RAW macrophages. (a-c) Flow cytometric overlay charts of macrophage differentiation markers in non-stimulated and stimulated cells at day 3 of culture; (d-f) quantitative analysis of surface marker expression in M0, M1, and M2 macrophages 3d; (g-i) microscopic images (5×) of macrophage cultures at day 3 of culture, note the cluster formation in M2 macrophages; (j) quantitative analysis of cluster formation at day 3 of culture. Data are from 2-3 independent experiments with several replicates. Scale bar is 100 μm.

Co-culture of RAW macrophages with pancreatic cancer cells reproduces the M2 phenotype. (a) Fluorescently-labelled macrophages in co-culture with non-labelled PDA6606 cells imaged at various time points, note the cluster formation over time; (b) total cluster size at day 3 of culture with different PDA-to-RAW ratios in co-culture; (c) cluster size of co-cultures (RAW+PDA at 1:3) over several days and cluster size of macrophages and M2-stimulated macrophages (RAW) without PDA; (d) flow cytometry analysis of M2 surface markers CD206 and arginase in RAW mono and RAW-PDA-co-cultures (at ratio 1:3) at day 3 of culture; (e) percentage of F4/80+ macrophages from all cells retrieved from co-cultures of RAW and PDA (at ratio 1:3) on day 3 of culture. Data are from 2-3 independent experiments with several replicates. Scale bar is 50 μm.
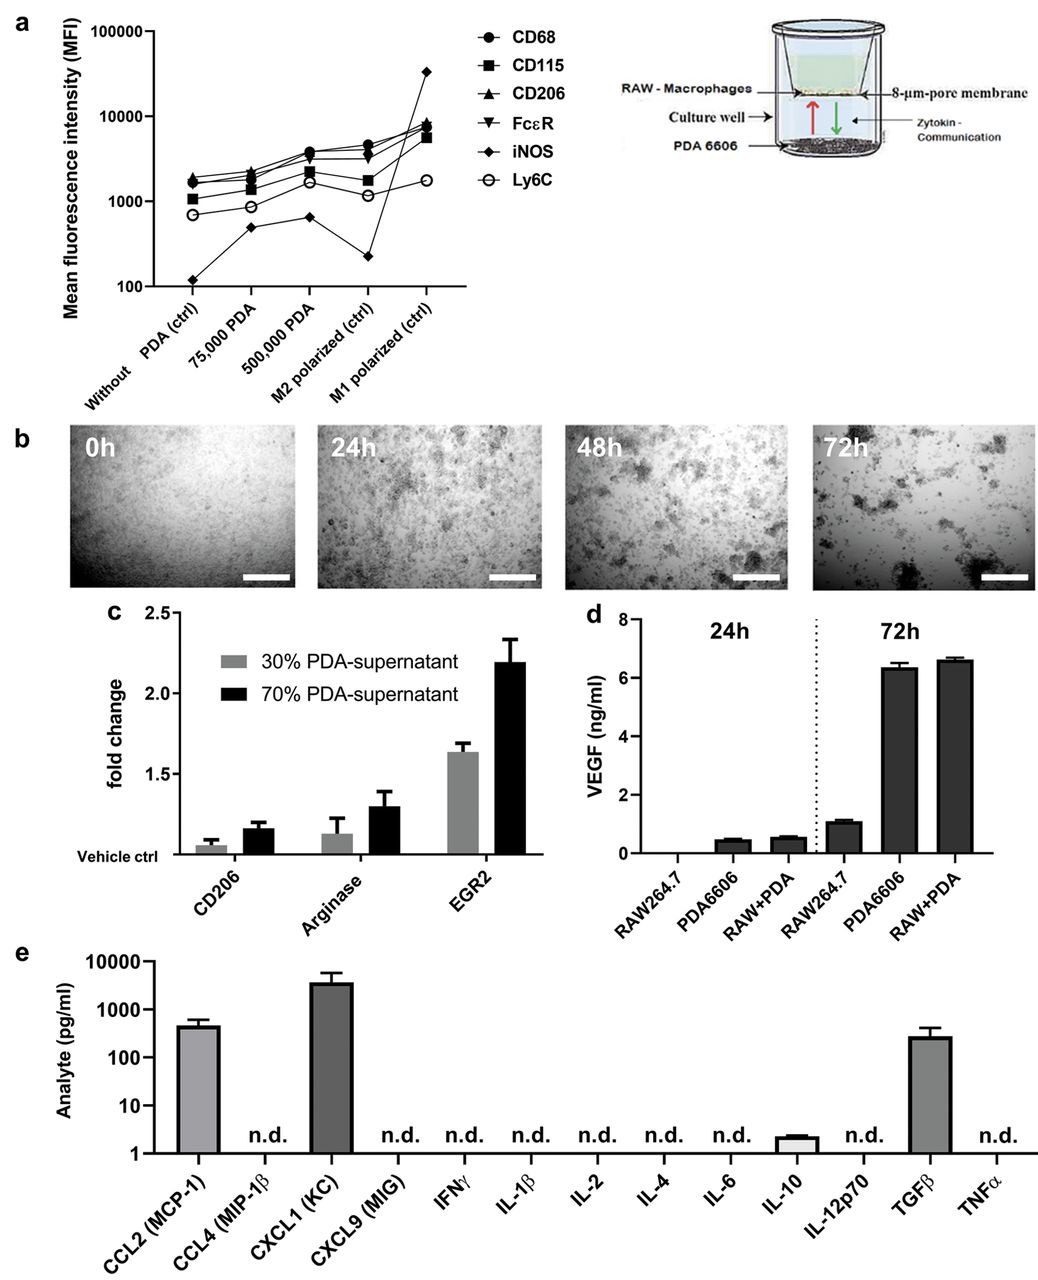
Secretory products of PDA6606 cells are sufficient to induce M2 polarization in RAW macrophages. (a) Transwell co-culture of RAW (sitting inside the transwell insert) and PDA (at well bottom) cells as well as M1 and M2 macrophages as control, and flow cytometry analysis of RAW surface markers at day 3 of culture; (b) brightfield images (5×) of RAW macrophages cultured with PDA6606 supernatants (70%) at different time points; (c) flow cytometry of M2 macrophage surface markers (normalized to unstimulated macrophages) of RAW cells incubated with supernatants of PDA6606 cells for 3 days; (d) quantification of VEGF in supernatants of mono and co-cultures of RAW and PDA cells via ELISA; (e) absolute concentrations of cytokines in PDA6606 supernatants at 18 h using multiplex bead-array. Data are from 2-3 independent experiments with several replicates each. Scale bar is 100 μm. n.d.=None determined meaning the signal was below the kit-specific limit of detection.

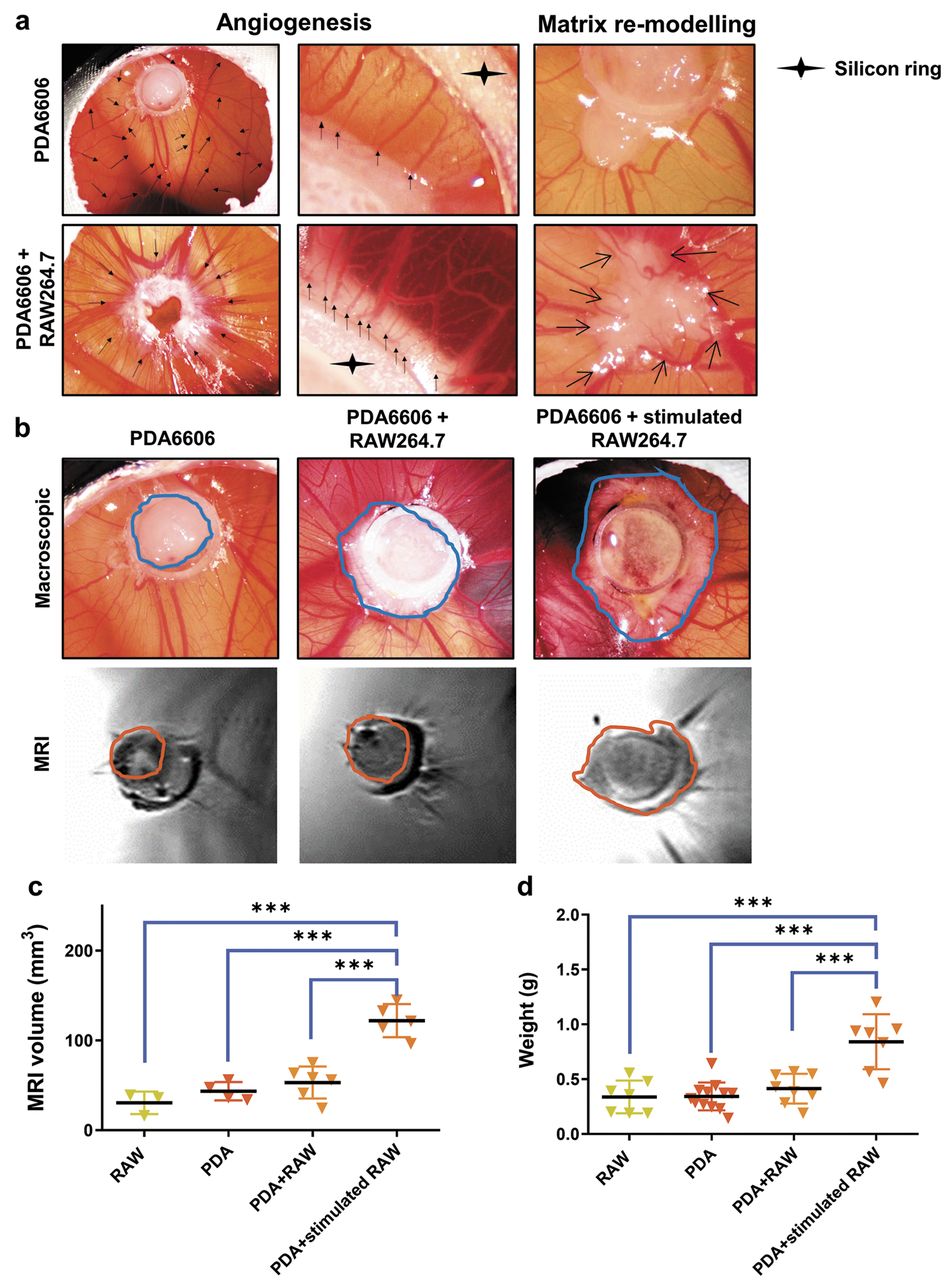
RAW macrophages spur angiogenesis and growth of tumours implanted on the CAM of chicken eggs. (a) Angiogenesis and matrix remodelling macroscopically observed in PDA and PDA-RAW tumours; (b) macroscopic size of PDA tumours increased with addition of RAW macrophages, especially if pre-stimulated with supernatants of PDA cells (upper panel), quantification of tumour volume via MRI (lower panel); (c) quantitative analysis of tumour volume and (d) tumour weight. Data are from 3-12 eggs.

RAW macrophages co-cultured with PDA cells on chicken embryos display an M2 phenotype. (a) Flow cytometry dot plots of macrophages, macrophages and PDA cells, PDA-supernatant-stimulated macrophages, and PDA cells grown on chicken embryos; (b) ratio of F4/80hi/CD11blow and F4/80int/CD11bhi cells in different tissues; (c-g) flow cytometry analysis of F4/80hi/CD11blow cells for several markers of macrophage polarization. Data are pooled from tumours retrieved from three eggs per group. (h) and (i) are representative immunofluorescence images of tissue sections retrieved from tumours (macrophages+PDA cells), scale bar is 100 μm.
PDA6606 cells educate RAW264.7 macrophages to spur tumour growth and angiogenesis via M2 polarization. To link our in vitro findings with functional consequences in a living host, PDA6606 and/or RAW264.7 macrophages were implanted onto CAMs of chicken embryos. Compared to PDA6606 tumours implanted as monocultures, implantation of co-cultures of PDA6606 cancer cells with RAW264.7 macrophages significantly spurred angiogenesis (Figure 4a). This was macroscopically visible as an increased number of thick blood vessels radially directed towards the co-culture but not the monoculture tumour implants. In addition, magnified images showed a denser vessel network at the edge of co-culture implants compared to monoculture ones. Moreover, matrix re-modelling, visible as grey areas, was observed at the edges of tumours containing macrophages at the tumour edges. This was also visible in RAW264.7 (data not shown) but not PDA6606 monoculture tissue on the CAM. In the latter case, the edges were abrupt and not interacting intensively with the surrounding mesh, attributing the finding of matrix remodelling to RAW cells. Comparing the overall macroscopic size, co-culture tumours were also larger although both mono- and co-culture tumours were implanted at equally cell counts initially. Interestingly, PDA6606 that were mixed with stimulated macrophages (RAW264.7 cells cultured in 50% PDA-supernatant medium to retrieve M2 macrophages) were even larger than co-culture tumours containing non-stimulated macrophages (Figure 4b). This was underlined by the MRI results. Absolute quantification of tumour volume calculated by MRI revealed a significant increase in co-culture tumours with stimulated macrophages compared to all other groups (Figure 4c). This finding was supported by the measurement of the absolute weight of the tumours (Figure 4d). To characterize the phenotype of macrophages within these different conditions, some of the tumours were digested to retrieve single cell suspensions for subsequent flow cytometric analysis. Because this protocol is prone to loss of cells, we had to pool the three tumours (replicates) into a single sample (containing all events of the three replicates) to retrieve sufficient cell numbers per condition and provide robust statistics. Nonetheless, we were able to clearly identify RAW264.7 cells via the expression of CD11b and also of F4/80 (Figure 5a). For subsequent quantification of phenotypic marker molecules, the geometric mean fluorescent intensity (gMFI) was used (Figure 5c g) as it is less prone to outliers (that occur more likely in samples with lower cell numbers) compared to the MFI. Comparing the ratios of F4/80hi over F4/80int RAW264.7 cells, the co-culture tumours with non-stimulated tumours were found to be increased (Figure 5b). However, the F4/80 expression in the F4/80hi population was much lower in this sample compared to the other two (Figure 5a), possibly pointing to only a number of cells maturing into F4/80hi macrophages. For the subsequent marker analysis, only the F4/80hi population was considered to be true macrophages, and gated on. The results regarding CD206 (Figure 5d) and FcεR (Figure 5e) corroborated our in vitro findings indicating increased expression of these markers in RAW macrophages upon co-culture with PDA6606 cells or incubation with their supernatants. The expression pattern of CD115 was distinct in each treatment group (Figure 5c). iNOS expression was also slightly increased (Figure 5f); however, we feel that this is insignificant keeping in mind that M1 macrophages express iNOS up to 200-fold above that of M0 macrophages (Figure 3a). A small but consistent increase in the expression of Ly6C was seen in the co-culture tumours compared to the mono-cultures (Figure 5g). These data illustrated not only the ability of (polarized) macrophages to spur angiogenesis but also the potency of tumour-conditioned macrophages (here referred to as M2, but generally also referred to as tumour-promoting or tumour-associated macrophages) to significantly spur tumour growth. This was supported by immunofluorescence indicating that CD11b+ macrophages not only induced formation of blood vessels (Figure 5h) but also seemed to cluster in ovo while releasing pro-angiogenic VEGF (Figure 5i).
Discussion
Macrophages are described as cells with high plasticity and differentiation potential (18). As tumour associated macrophages with M2 properties (19), they play an important role in tumour progression and metastasis development in several cancerous diseases (20-22), such as pancreatic carcinoma (23-25). Our previous findings (13) as well as other studies (26, 27) have shown the ability of PDA6606 pancreatic carcinoma cells to alter macrophage differentiation to their favour. Differentiation into the pro-tumour M2 subtype has been shown both in vitro and in vivo. Furthermore, M2 macrophages have been shown to influence tumour progression by promoting angiogenesis (28-30) and matrix remodelling (31). Hence, there is a need to study induction of tumour-promoting macrophage phenotype and their plasticity. In this study, we have used for the first time an in vitro and in ovo model system to study the interaction of macrophages and pancreatic cancer cells that may present a suitable addition to traditional rodent model systems or primary cells obtained from rodents.
Flow cytometry was used to analyse intra-tumour RAW264.7 macrophages in ovo following their isolation from PDA6606 tumours and staining for the macrophage-specific antigen CD11b. This method also allowed us to compare the differentiation status of in ovo-stimulated RAW264.7 cells with that of RAW264.7 cells stimulated in vitro using established methods such as supernatant assay, trans-well assay, and co-cultivation with cancer cells. Our results indicated that differentiation to M2 macrophages was positively correlated with the intensity of their interaction with PDA6606 cells. However, as in previous studies (32-34), cell-to-cell contact was not found to be a prerequisite for the induction of the M2 phenotype. In this study, high levels of VEGF were found in PDA cell culture supernatants. As a functional consequence, both pre-stimulated as well as non-stimulated macrophages, increased angiogenesis and matrix re-modelling in co-culture tumours in ovo, which is a typical trait of TAMs of the M2 subtype (30, 35, 36). Yet, angiogenesis in PDA tumours was considerably less prominent, ruling out the possibility that VEGF released by PDA6606 is responsible for the increased angiogenesis. It is possible that VEGF released by PDA cells is part of a feed-back loop that exists between PDA and macrophages. Moreover, only pre-stimulated macrophages significantly increased tumour weight in comparison to PDA monoculture tumours, while naive macrophages did not. Similar results have been obtained by a group using tumour educated macrophages in a murine in vivo model (37). Unfortunately, polarization of macrophages was not tested in that study. It is known that tumour growth is limited by a finite supply of oxygen and nutrients caused by insufficient vascularization. Our hypothesis is that pre-stimulated (M2) RAW macrophages were able to accelerate angiogenesis and therefore nutrient supply, leading to increased tumour growth. By contrast, tumour cells implanted as co-cultures with non-stimulated (M0) macrophages first needed to polarize macrophages, which then in a second step would accelerate tumour growth via increasing vascularization and inducing matrix re-modelling. However, this idea could not be tested in our model as the assay lasts only for few days on CAM before the embryos need to be euthanized. The importance of TAMs is underlined by current efforts to target M2 into M1 macrophage polarization in a neo-adjuvant clinical setting (38-40). This may even help preventing extensive peritoneal metastasis, which is also supported by M2 macrophages (41). Next to numerous potential targets reported throughout the literature, chemokine secretion by tumour cells including CCL3, CCL4, CCL22 (42), and potentially CCL2 as observed in this and other studies (43-45), may serve as an additional therapeutic avenue.
A more technical finding of our study was that the clustering of RAW264.7 cells is a morphological correlate of M2 differentiation. Clustering has not been described as an M2 “trait”, yet and may be an additional and simple method to recognize differentiation processes in RAW264.7 populations. The universality of this finding needs to be confirmed in further morphological and molecular studies using other monocyte/macrophage cell lines and cancer cells, as well as primary cells. Our findings may be useful for groups frequently using RAW264.7 cells to study macrophage plasticity and differentiation (46-48).
Conclusion
Our study showed the suitability of the PDA6606 pancreatic cancer cells and RAW264.7 macrophages co-culture approach to study the differentiation of macrophages towards the M2 phenotype and their role in tumour promotion. Furthermore, the presented in ovo HET-CAM/TUM-CAM assay is a rapid approach, that is not limited by ethical concerns, used to test the functional consequences of macrophage polarization in the context of living systems.
Acknowledgements
Technical support by Christine Hackbarth, Antje Janetzko, and Felix Nießner is gratefully acknowledged. SB received financial support by the Federal German Ministry of Education and Research, grant number 03Z22DN11.
Footnotes
↵* These Authors contributed equally to this work.
Authors' Contributions
LIP and SB designed the study; AK and AK performed the experiments; AK, AK, KRL, EF and SB analysed the data; SB prepared the draft; all Authors reviewed the manuscript.
Conflicts of Interest
There are no conflicts of interest to declare regarding this study.
- Received April 9, 2019.
- Revision received May 6, 2019.
- Accepted May 15, 2019.
- Copyright© 2019, International Institute of Anticancer Research (Dr. George J. Delinasios), All rights reserved


