


Abstract
Background/Aim: The aim of the study was to evaluate the antitumor potential and combination effects of chemotherapeutic drugs. Materials and Methods: The cytotoxicity of 20 drip-type classical and molecular-targeted anticancer drugs was examined against 4 human oral squamous cell carcinoma cell lines and 5 human oral normal mesenchymal and epithelial cells. Cell cycle progression was monitored by a cell sorter. Combination effect was evaluated by combination index. Results: Most of the classical anticancer drugs showed much higher antitumor activity than molecular-targeted drugs, except bortezomib. Among 12 classical anticancer drugs, taxanes and gemsitabine showed the highest tumor-specificity (TS) and potency-selectivity expression (PSE) values, whereas platinum analogs showed the least TS value. Combination of two classical or a classical and a molecular-targeted drug showed mostly additive or antagonistic effect. 5-FU and cisplatin did not produce a subG1 population, but induced G2/M or G1/S arrest, regardless of the addition of cetuximab. Cetuximab, nibolumab and bortezomib showed potent keratinocyte toxicity. Conclusion: The present TS monitoring system may provide useful information for building up the treatment regimens of anticancer drugs.
- Anticancer drugs
- human oral squamous cell carcinoma cells
- tumor-specificity
- combination effect
- cell cycle analysis
- hormesis
Cancer thermotherapy agents are roughly classified into two groups: (i) classical cytotoxic drugs that act on cell division mechanisms and suppress cell proliferation, and (ii) molecular-targeted drugs that target cancer cell-specific molecules that are essential for cancer cell growth and metastasis (1). The latter group of drugs is expected to show relatively lower side effects than classical cytotoxic drugs.
We have recently reported that classical anticancer drugs exerted both good effect [extremely higher cytotoxicity against human oral squamous cell carcinoma (OSCC) cell lines than human normal oral mesenchymal cells], and bad effect (potent cytotoxicity against human normal oral epithelial cells) (2, 3). Recently, molecular-targeted drugs, such as cetuximab (Cmab) and nivolumab (Nmab) have been approved for the treatment of head and neck cancer in Japan (November 10, 2016). However, comparative studies of the direct cytotoxicity of both classical and molecular-targeted drugs against human malignant as well as non-malignant cells has been limited. In contrast to our expectation, several molecular-targeted drugs showed side effects, such as interstitial pneumonia, dermatitis and mucositis/stomatitis (4) and aggravation of cardiotoxicity (5).
It has been reported that many toxic substances and irradiation modulate the growth of cultured cells in a biphasic fashion, growth stimulating or beneficial effects at lower concentrations are known as hormesis (6). If anticancer drugs could induce such hormesis in OSCC, cancer growth may be accelerated.
Based on this background, we investigated the cytotoxicity and hormesis-inducing activity of 12 classical and 8 molecular-targeted anticancer drugs, used for the treatment of cancer patients in our hospital, against 4 human OSCC cell lines (Ca9-22, HSC-2, HSC-3, HSC-4), 3 human normal oral mesenchymal cells [human gingival fibroblast (HGF), human periodontal ligament fibroblast (HPLF), human pulp cell (HPC)] and 2 human normal epithelial cells [human oral keratinocyte (HOK), primary human gingival epithelial cell (HGEP)]. Since present treatment regimens of cancer patients usually adopt the combination of more than one anticancer drugs, we also investigated whether such combination treatment induces synergistic cytotoxicity and apoptosis in HSC-2 cell line.
Materials and Methods
Materials. The following chemicals and reagents were obtained from the indicated companies: Dulbecco's modified Eagle's medium (DMEM) from GIBCO BRL (Grand Island, NY, USA); fetal bovine serum (FBS), 3-(4,5-dimethylthiazol-2-yl)-2,5-diphenyltetrazolium bromide (MTT), actinomycin D and ribonuclease (RNase) A from Sigma-Aldrich Inc. (St. Louis, MO, USA); dimethyl sulfoxide (DMSO), propidium iodide (PI), and 4% paraformaldehyde phosphate buffer solution from Wako Pure Chem. Ind. (Osaka, Japan); Nonidet P-40 (NP-40) from Nakalai Tesque Inc. (Kyoto, Japan); abraxane (NabPTX) from Taiho Pharmaceutical Co. Ltd. (Tokyo, Japan); pembrolizumab (Pmab) from MSD K. K. (Tokyo, Japan); trastuzumab (Tmab) and bevacizumab (Bmab) from Chugai Pharmaceutical Co., Ltd. (Tokyo, Japan); bortezomib (Bmib) from Janssen Pharmaceutical K, K. (Tokyo, Japan); ramucirumab (Rmab) from Eli Lilly Japan K. K. (Kobe, Japan); oxaliplatin (L-OHP) from Yakult Honsha Co., Ltd. (Tokyo, Japan); elotuzumab (Emab) from Bristol Myers Squibb. K. K., (Tokyo, Japan); gemcitabine (GEM) and cisplatin (CDDP) from Nichi-Iko Pharmaceutical Co. Ltd. (Toyama, Japan); paclitaxel (PTX) from Nipro Corporation. (Osaka, Japan); cetuximab (Cmab) Merck Serono K. K. (Tokyo, Japan); carboplatin (CBDCA) and docetaxel (DTX) from Sawai Pharmaceutical Co. Ltd. (Osaka, Japan); etoposide (ETP) Sandoz K. K. (Yamagata, Japan); 5-fluorouracil (5-FU) and irinotecan (IRT) from Towa Pharmaceutical Co. Ltd. (Osaka, Japan); azacitidine (AZA) from Nippon Shinyaku Co. Ltd. (Kyoto, Japan); nivolumab (Nmab) from Ono Pharmaceutical Co. Ltd. (Osaka, Japan). Culture plastic dishes and plates (96-well) were purchased from Becton Dickinson (Franklin Lakes, NJ, USA).
Cell culture. Human normal oral mesenchymal cells (HGF, HPLF and HPC) were established from the first premolar tooth extracted from the lower jaw of a 12-year-old girl, according to the guidelines of intramural ethic committee (7). Human OSCC cell lines [Ca9-22 (derived from gingival tissue), and HSC-2, HSC-3, and HSC-4 (derived from tongue)] were purchased from Riken Cell Bank (Tsukuba, Japan). These cells were cultured at 37°C in DMEM supplemented with 10% heat-inactivated FBS, 100 units/ml penicillin G and 100 μg/ml streptomycin sulfate, under a humidified 5% CO2 atmosphere. Human oral keratinocytes (HOK) (purchased from ScienCell Research Laboratories, Carlsbad, CA, USA) were cultured in oral keratinocyte medium. Primary human gingival epithelial cells (HGEP) (purchased from CELLnTEC Advanced Cell Systems AG, Bern, Switzerland) were grown in CnT-PR medium. HGF, HPLF and HPC at 15~20 population doubling levels (PDL), and HOK and HGEP at 7~11 PDL were used in the present study. Cell morphology was checked periodically under a light microscope (EVOS FL; Thermo Fisher Scientific, Waltham, MA, USA).
Assay for cytotoxic activity. Cells were inoculated at 2×10³ cells/0.1 ml in a 96-microwell plate. After 48 h, the medium was replaced with 0.1 ml of fresh medium containing different concentrations of test compounds. All drip-type anticancer drugs (dissolved in saline) were diluted with culture medium. Cells were incubated further for 48 h and the relative viable cell number was then determined by the MTT method (3). In brief, control and treated cells were incubated for 2 h with 0.1 ml of 0.2 mg/ml MTT reagent. Then, the MTT-containing medium was removed, and the purple crystals were lysed with 0.1 ml of DMSO. The relative viable cell number was determined from the absorbance of the cell lysate at 560 nm, using a microplate reader (Infinite F50R; TECAN, Männedorf, Switzerland). The concentration of compound that reduced the viable cell number by 50% (CC50) was determined from the dose–response curve and the mean value of CC50 for each cell type was calculated from triplicate assays.
Assay for hormesis. The hormetic response was evaluated by the maximum response in each dose-response curve, as described in our previous publication (8).
Calculation of tumor-specificity index (TS). TS was calculated using the following equation: TS=mean CC50 against three normal oral mesenchymal cells (HGF+HPLF+HPC) /mean CC50 against four OSCC cell lines (Ca9-22+HSC-2+HSC-3 + HSC-4) [(D/B) in Table I]. Since both Ca9-22 and HGF cells were derived from the gingival tissue (9), the relative sensitivity of these cells was also compared (C/A in Table I).
Calculation of potency-selectivity expression (PSE). For the treatment of cancer patients, both tumor-specificity (TS) and cytotoxicity (reciprocal of CC50 value) of anticancer drugs should be considered. PSE, that is the product of these two factors was calculated using the following equation: PSE=100×TS/CC50 (tumor cells) [that is, 100×D/B2 (HGF+HPLF+HPC vs. Ca9-22 + HSC-2+HSC-3+HSC-4) and 100×C/A2 (HGF vs. Ca9-22 in Table I) (10).
Assay of combination index. The CompuSyn software program (ComboSyn, Inc.; Paramus, NJ, USA) was used to calculate the combination index (CI) to determine the presence of drug interactions affecting a cell proliferation (11). Briefly, the CI value was determined by the following equation: CI=(% decrease of viable cell number by compound A+% decrease of viable cell number by compound B)/(% decrease of viable cell number by combination of compound A and B). The combination effect was judged “synergistic”, “additive” or “antagonistic” when CI was <1, 1 and >1, respectively (12).
Cell-cycle analysis. Treated and untreated cells (approximately 106 cells) were harvested, fixed with 1% paraformaldehyde in PBS without calcium and magnesium ions [PBS(−)]. Fixed cells were then washed twice with PBS(−) and treated for 30 min with 400 μl of 0.2 mg/ml RNase A (preheated for 10 min at 100°C to inactivate DNase) to degrade RNA. Cells were then washed twice with PBS(−) and stained for 15 min with 0.01% propidium iodide (PI) in the presence of 0.01% NP-40 in PBS(−) to prevent cell aggregation. After filtering through Falcon® cell strainers (40 μM) (Corning, NY, USA) to remove aggregated cells, PI-stained cells were subjected to cell sorting (SH800 Series; SONY Imaging Products and Solutions Inc., Kanagawa, Japan). Cell-cycle analysis was performed with Cell Sorter Software version 2.1.5. (SONY Imaging Products and Solutions Inc.) (10).
Cytotoxic activity of 12 classical and 8 molecular-targeted anticancer drugs against oral malignant and non-malignant cells. Each value represents the mean of triplicate determinations. Tumor-selectivity index (TS) and potency-selectivity expression (PSE) values were determined using the data of Figure 1 and additional repeated experiments (data not shown) with all oral squamous cell carcinoma (OSCC) compared with non-malignant cells, and paired cells derived from the same (gingival) tissue.
Statistical analysis. Statistical analyses were performed using the Origin pro 2018 software (Origin Lab Corporation, MA, USA). Experimental data are presented as the mean±standard deviation (SD) of triplicate determinations. The statistical analysis was performed using one-way analysis of variance (ANOVA) followed by Bonferroni's post-hoc test for multiple comparisons. A value of p<0.05 was considered to indicate statistically significant differences. Fitted curves or lines and R2 values were calculated by Microsoft Excel (Windows 10, Microsoft Corporation, Redmond, WA, USA).
Results
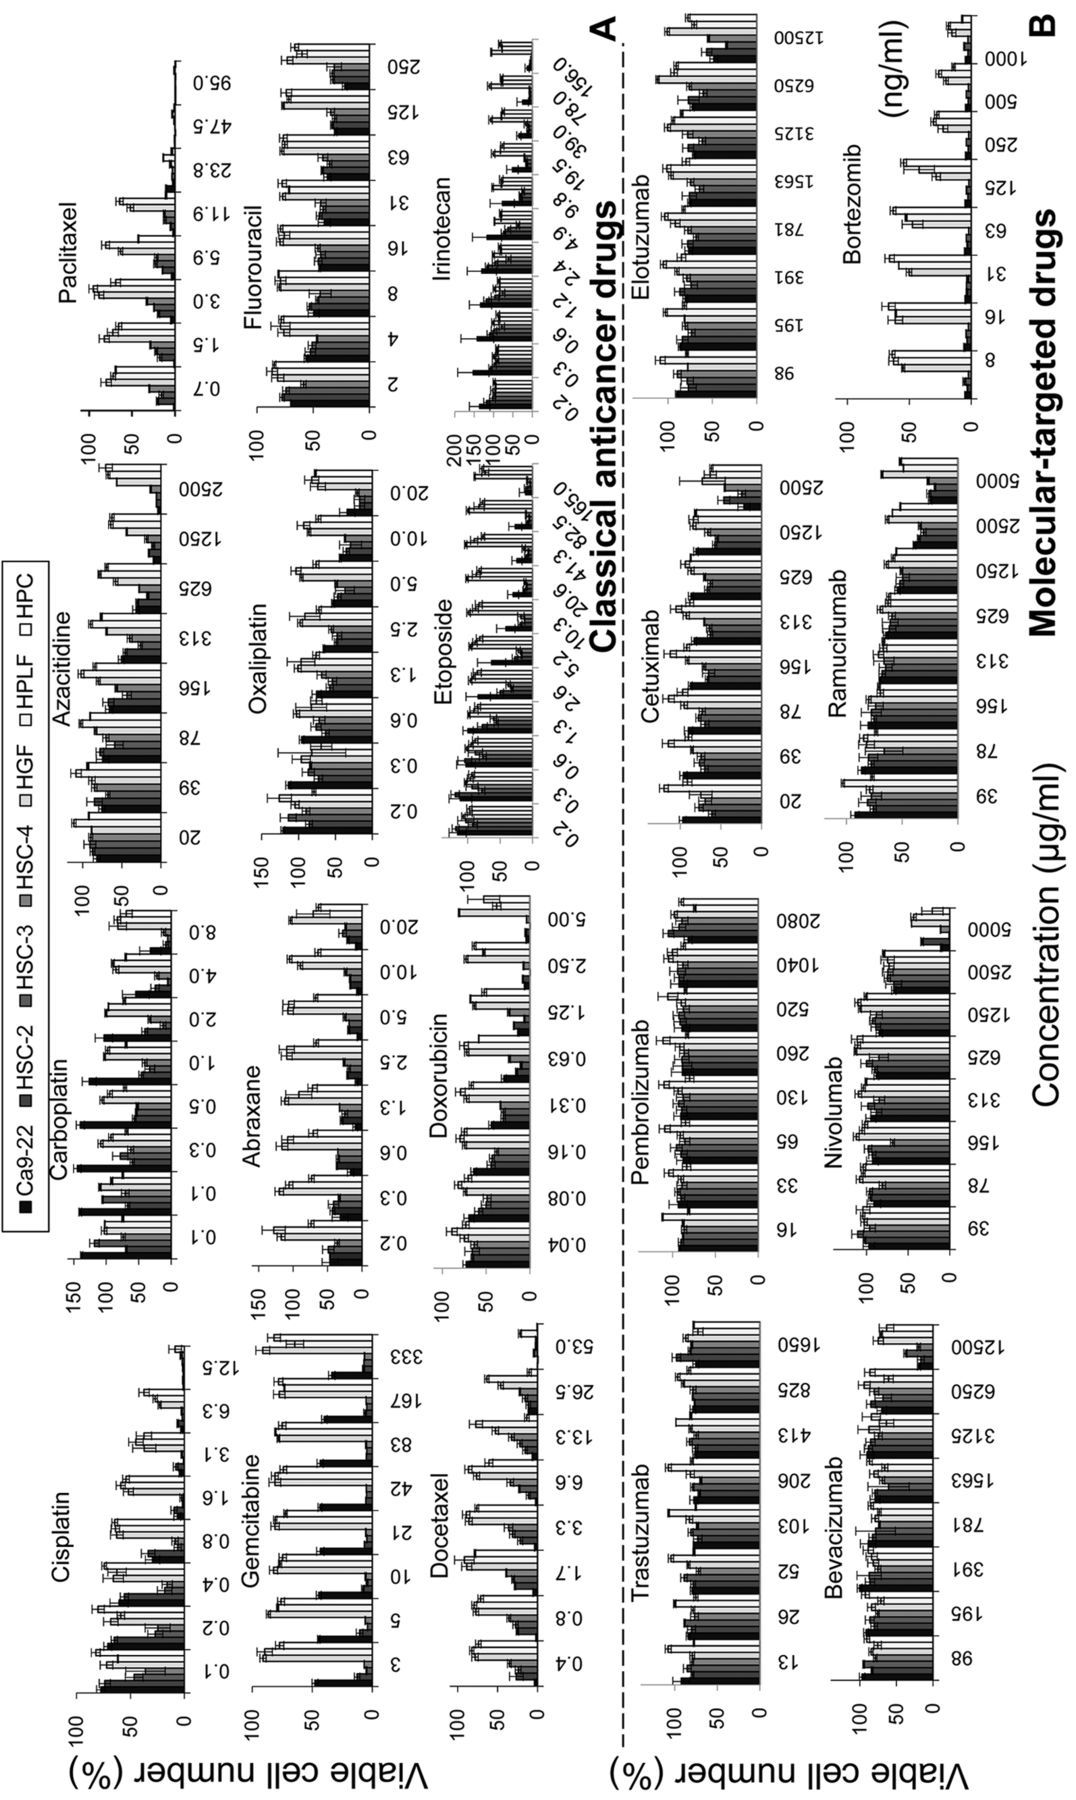
Higher cytotoxicity of classical anticancer drugs against OSCC than molecular targeted drugs except bortezomib. A total of 12 classical anticancer drugs [abraxane (NabPTX), cisplatin (CDDP), carboplatin (CBDCA), fluorouracil (5-FU), oxaliplatin (L-OHP), irinotecan (IRT), paclitaxel (PTX), gemcitabine (GEM), etoposide (ETP), docetaxel (DTX), azacitidine (AZA), doxorubicin (DOX)] and 8 molecular targeted drugs [cetuximab (Cmab), elotuzumab (Emab), ramucirumab (Rmab), bevacizumab (Bmab), trastuzumab (Tmab), pembrolizumab (Pmab), nivolumab (Nmab), bortezomib (Bmib)] were investigated for their cytotoxicity against four human OSCC (Ca9-22, HSC-2, HSC-3, HSC-4) and three human normal oral mesenchymal cells (HGF, HPLF, HPC), using the MTT method.
Dose-response curve (Figure 1) demonstrated that all of the classical anticancer drugs induced potent cytotoxicity, with the 50% cytotoxic concentration (CC50) ranging from less than 0.00049 to 138 μM, reducing the viable cell number by 68 to 100% (GI in Table I). However, 7 molecular-targeted drugs except Bmib (CC50=<0.0013 μM) showed much lower cytotoxicity (CC50=1714~10565 μM), reducing the cell viability only by 10~76% (Table I). Among 20 tested compounds, DTX showed the highest cytotoxicity (CC50=<0.00049 μM), followed by Bmib (<0.0013) > PTX (<0.0015) > GEM (<0.0039) > DOX (0.1) > NabPTX (<0.2) >CDDP (0.7) > ETP (3.7) > L-OHP (4.3) > IRT (4.8) > 5-FU (10.4) > CBDCA (27.9) > AZA (138) > Rmab (1370) > Cmab (1714) > Pmab (>2080) > Nmab (3436) > Bmab (8879) > Tmab (9392) > Emab (10565) (Bold: molecular targeted drugs) [(B) in Table I].
Molecular-targeted drugs showed potent keratinocyte toxicity (HOK and HGEP are shown by an open circle and open square, respectively in Figure 2). Cmab showed approximately 2-fold higher cytotoxicity against HOK (CC50=1031 μg/ml) and HGEP (CC50=853 μg/ml) than against OSCC (CC50=1714 μg/ml) and normal mesenchymal cells (CC50=>2500 μg/ml). Similarly, Nmab showed approximately 5-fold higher cytotoxicity against HOK (CC50=680 μg/ml) and HGEP (CC50=898 μg/ml) than against OSCC (CC50=3436 μg/ml) and mesenchymal cells (CC50=4281 μg/ml). Bmib showed much higher cytotoxicity to both HOK and HGEP (CC50<0.003906 μg/m).
There was a possibility that the higher sensitivity of OSCC cell lines over normal cells may be due to the different cell density between tumor and normal cells. To test this possibility, the CC50 values of all compounds were plotted as a function of cell density, expressed as the absorbance at 560 nm of MTT-stained untreated OSCC (black color), mesenchymal (gray color) and epithelial cells (white color). Figure 2 shows that the higher sensitivity of OSCC cell lines were observed regardless of cell density, thus eliminating this possibility.
In contrast to our expectation, most of classical and molecular-targeted drugs did not show any apparent hormetic growth stimulation at lower concentration ranges (ND (not detectable) in Table II], except for Cmab, Emab, Rmab and Mmab in Ca9-22 and HSC-2 cells. However, there is a possibility that hormetic stimulatory response (MHSR) can be detected by searching much lower concentration ranges of the test compounds (13).
Higher antitumor potential of classical anticancer drugs than molecular targeted drugs except bortezomib. Since classical anticancer drugs show much less cytotoxicity against human normal oral mesenchymal cells, they showed higher antitumor potential. Antitumor potential was calculated by two parameters: tumor-specificity (TS) and potency-selectivity expression (PSE).
TS was calculated by dividing the CC50 against normal oral mesenchymal cells by the CC50 against aOSCC cells. Calculation of TS with 4 OSCC and 3 normal oral cells (D/B in Table I) yielded a broad distribution pattern ranging from the order of 105 to 100: GEM (TS=>377949) > DTX (>86122) > PTX (>7267) > NabPTX (>853) > Bmib (>505) > 5-FU (170) > ETP(52) > IRT (TS=28) > DOX (TS=25) > AZA (TS=20) > CDDP (TS=10) > L-OHP (TS=6.8) > CBDCA (3.8) > Rmab (>3.6) > Cmab (>1.5) > Bmab (>1.4) > Emab(>1.2) > Nmab (>1.2) > Tmab (>1.1) > Pmab (><1). Calculation of TS for Ca9-22 and HGF cells (both derived from gingival tissue) (C/A in Table I) showed similar distribution pattern: GEM (TS >347131) > DTX (>122041) > PTX (>12551) > NabPTX (990) > 5-FU (244) > Bmib (>27) > ETP(22) > AZA (16) > DOX (11) > IRT (7.6) > L-OHP (4.7) > CDDP (4.6) > Rmab (>3.2) > Cmab (>2.2) > CBDCA (1.5) > Bmab, Nmab, Emab (>1.4) > Tmab (>1.1) > Pmab (><1).
PSE was calculated by dividing TS by CC50 of OSCC and then multiplied by 100. Calculation of PSE with 4 OSCC and 3 normal oral mesenchymal cells (100xD/B2 in Table I) yielded a broad distribution pattern ranging from the order of 1010 to 10−2: DTX (PSE >17590948906) > GEM (>9691386163) > PTX (>483156504) > Bmib (>38838817) > NabPTX (>475309) > DOX (19421) > 5-FU (1638) > CDDP (1551) > ETP (1427) > IRT (583) > L-OHP (159) > AZA, CBDCA (14) > Rmab (>0.26) > Cmab (>0.09) > Nmab (0.04) > Bmab (>0.02) > Emab, Tmab (>0.01) > Pmab (><0.05). Calculation of PSE with Ca9-22 and HGF cells (100xC/A2 in Table I) showed similar distribution pattern: DTX (PSE >24902509578) > GEM (>7113688406) > PTX (>1281739526) > Bmib (>2772419) > NabPTX (577687) > DOX (4738) > 5-FU (2965) > ETP (261) > CDDP (246) > IRT (74) > L-OHP (72) > AZA (7) > CBDCA (2) > Rmab (>0.20) > Cmab (>0.19) > Pmab (><0.05) > Nmab (0.04) > Emab (>0.02) > Bmab, Tmab (>0.01).
Hormetic response of human oral normal and tumor cells after treatment with classical and molecular-targeted drugs. These values were calculated from the data of Figure 1 and additional repeated experiments (data not shown).
These data demonstrated that classical antitumor drugs showed much higher antitumor activity, measured by either by TS or PSE, than molecular-targeted drugs except for Bmid.
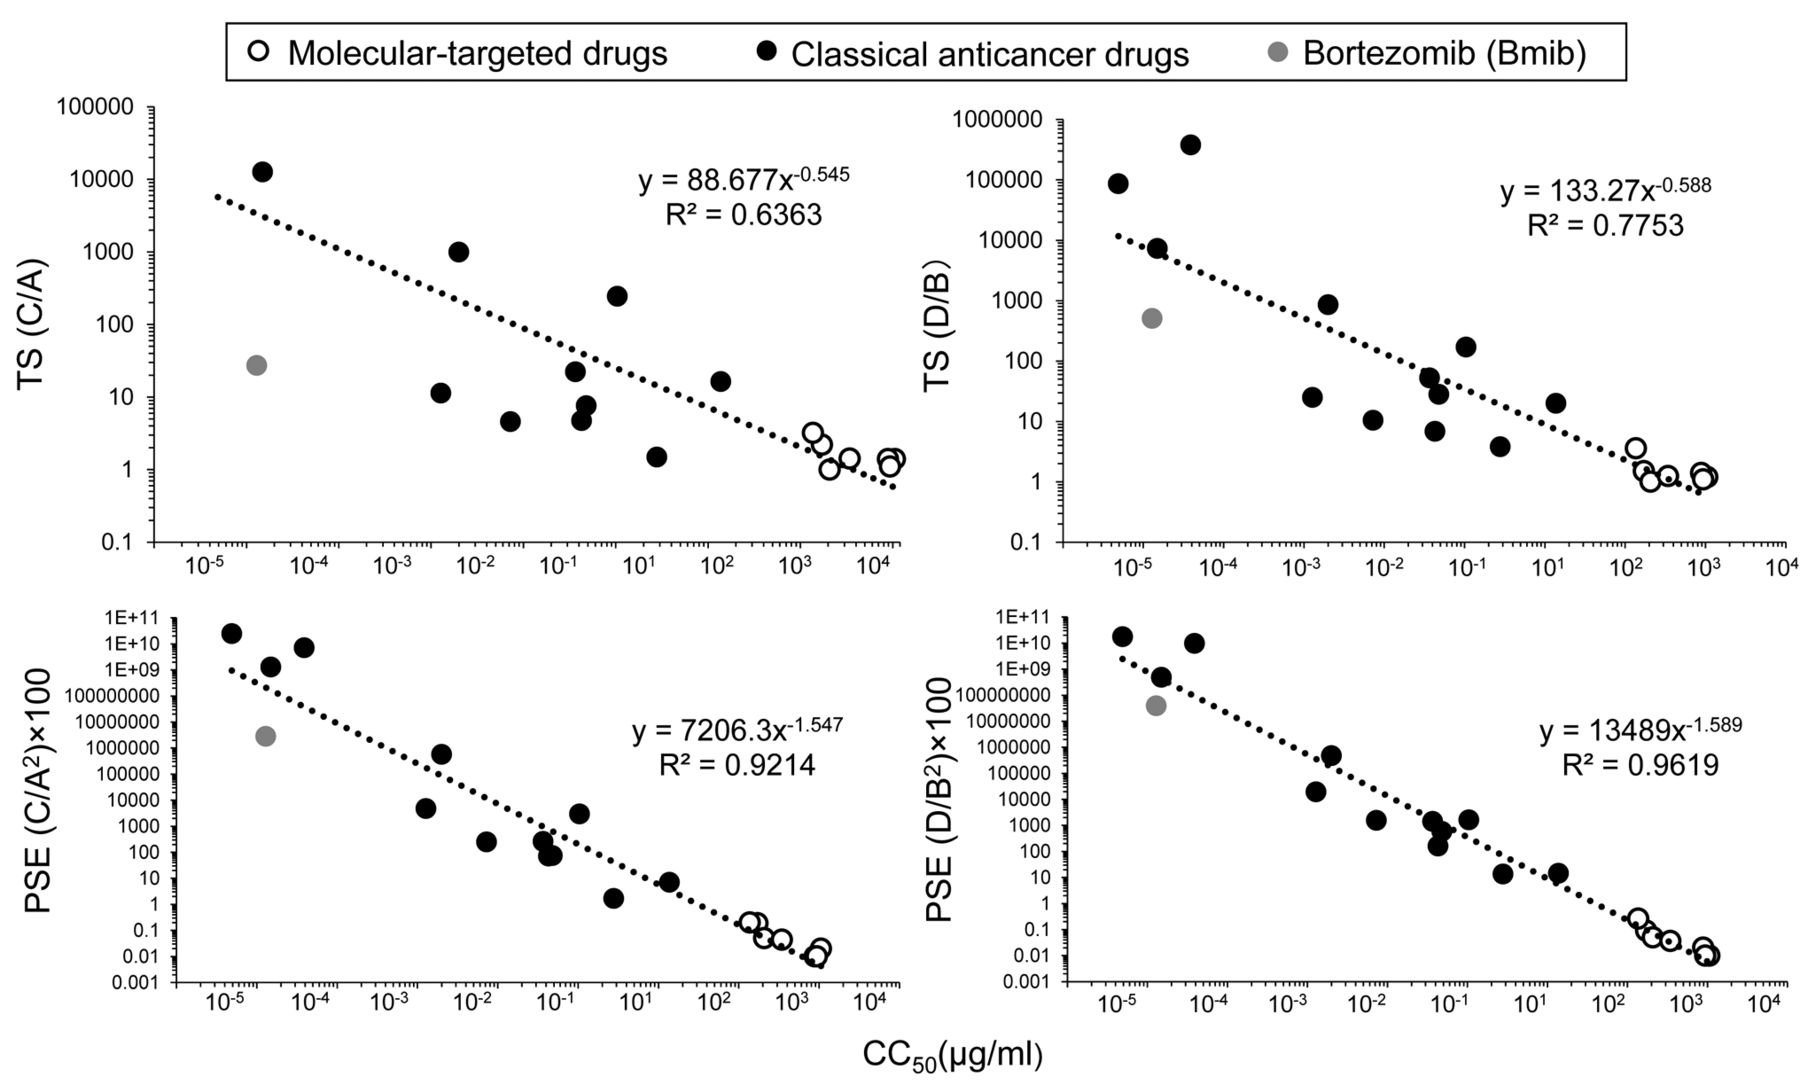
Correlation between anticancer potential and cytotoxicity. When the CC50 values (in log scale) of the 20 anticancer drugs were plotted as a function of the TS or log PSE value (in log scale), well-fitted regression lines were produced with R2 value of 0.7753 (D/B), 0.6363 (C/A), 0.9619 (D/B2)×100, 0.0214 (C/A2)×100) (Figure 3). All 20 anticancer drugs including Bmib lined up on the same line. This indicates that the anti-cancer activity, either TS or PSE, can be estimated by measuring the cytotoxic activity (CC50).
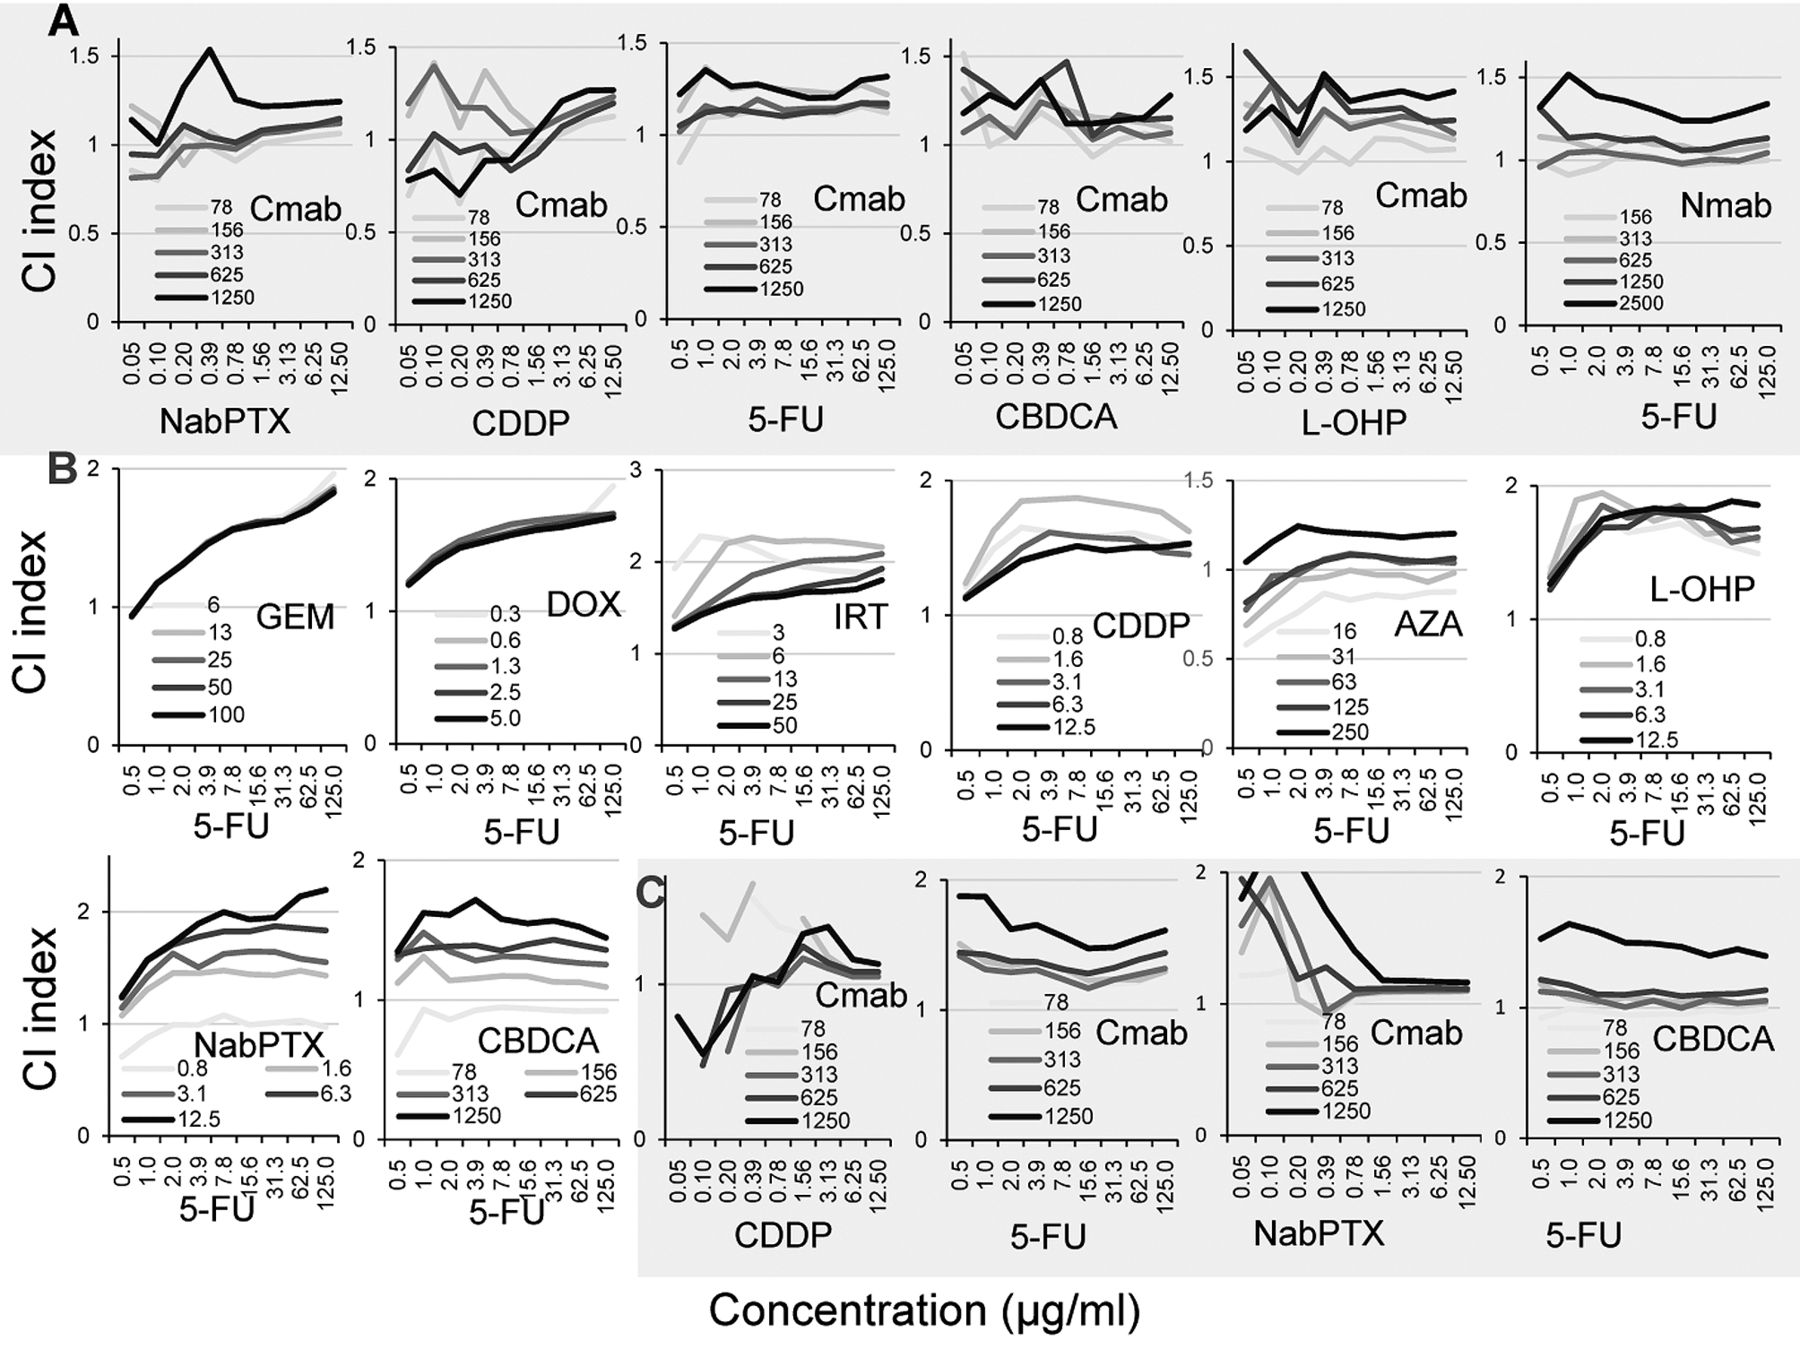
Additive or antagonistic interaction between classical and molecular-targeted anticancer drugs. In order to investigate the combination effect of two anticancer drugs, HSC-2 cells were incubated for 48 h with various concentrations of each compound (data not shown). Drug interaction between the two compounds, such as synergism, additivity and antagonism, can be monitored by combination index (CI) (Figure 4). Combination of Cmab (78 μg/ml) with NabPTX, CDDP, 5-FU, CBDCA, L-OHP, or 5-FU (0.05~125 μg/ml) produced the CI index of nearly 1, indicating additive interaction in HSC-2 cells. At higher concentrations of Cmab, the CI exceeded 1, suggesting antagonistic interaction (Figure 4A). Similarly, combination of Nmab (156 μg/ml) and 5-FU (0.5~125 μg/ml) produced additive interaction, whereas higher concentrations of Nmab produced antagonistic interaction (Figure 4A). Combination of 5-FU (0.5 μg/ml) with GEM (6-100 μg/ml), DOX (0.3-5 μg/ml), IRT (3 μg/ml), CDDP(0.8 μg/ml), AZA (16 μg/ml), L-OHP (0.8-12.5 μg/ml), NabPTX (0.8 μg/ml) or CBDCA (78 μg/ml) produced additive interaction, whereas higher concentrations of 5-FU showed antagonistic interaction in HSC-2 cells (Figure 4B).
Combination of Cmab and CDDP, 5-FU or NabPTX, and combination of CBDCA and 5-FU produced additive or antagonistic interaction on Ca9-22 cells (Figure 4C).
Cell cycle arrest induced by Cmab combined with CDDP or 5-FU. Cell cycle analysis (Figure 5) demonstrated that treatment of HSC-2 cells with Cmab (625 μg/ml), CDDP (0.4 and 0.8 μg/ml, corresponding to 1× and 2× CC50), 5-FU (11.6 and 23.6 μg/ml, corresponding to 1× and 2× CC50) failed to induce accumulation of cell population in the subG1 phase (apoptosis marker), in contrast to actinomycin D (1 μM) (positive control). CDDP dose-dependently reduced the G1 population but increased the S and G2/M population, suggesting growth arrest at G2/M. On the other hand, 5-FU slightly increased the number of cells in the G1 and S phases, and reduced the number of cells in the G2/M phase, suggesting the inhibition of entry into S phase. Combination of Cmab and CDDP or 5-FU produced nearly the same distribution pattern observed in cells treated with CDDP or 5-FU alone. This suggested that cell cycle distribution is controlled mainly by classical anticancer drugs rather than by molecular-targeted drugs.

Dose-response curve of growth inhibition by 12 classical anticancer drugs and 8 molecular-targeted drugs. Cells (2×10³/ml) were inoculated and incubated for 48 h to allow the complete attachment to 96-microwell plates. Near confluent cells were incubated for further 48 with the indicated concentrations of test compounds, and viable cell number was determined by MTT methods. Each value represents mean±S.D. of triplicate determinations.

OSCC cell lines show higher sensitivity against anticancer drugs regardless of cell density. CC50 values (in log scale) for OSCC (black), human normal oral mesenchymal (gray) and epithelial cells (white) (derived from Table I) were plotted as a function of cell density (expressed as absorbance at 560 nm of untreated control cells).

Correlation of antitumor activity (evaluated by TS or PSE) and the cytotoxic anticancer potential of the 20 anticancer drugs. TS or PSE values (in log scale) of 12 classical anticancer drugs (black circle), 7 molecular-targeted drugs (white circle) and bortezomib (gray circle) were plotted vs their cytotoxicity [CC50 value (in log scale) derived from Table I]. Fitted curves or lines and R2 values were calculated as described in Materials and Methods.
Discussion
We have investigated the tumor-specificity of 20 anticancer drugs used clinically as drip treatment of cancer patients. These water-soluble samples can be applied to cells, without the use of organic solvent such as DMSO, and thus provides much reliable information regarding the cytotoxicity of each drug. The possible difference of antitumor potency and action mechanism between water-soluble and water-insoluble compounds remains to be investigated, since many researchers studying in vitro anticancer activity have used fat-soluble anticancer drugs, dissolved with organic solvent such as DMSO.
The present study demonstrated that among 12 classical anticancer drugs, taxanes such as PTX (TS>7267, PSE>483156504) and DTX (TS>86122, PSE>17590948908), and GEM (TS> 377949, PSE> 9691386163) showed the highest tumor-specificity, suggesting its potent anticancer activity. However, platinum analogs such as CDDP (TS=10; PSE=1551), CBDCA (TS=4, PSE=14) and L-OHP (TS=7, PSE=159) showed surprisingly low tumor-specificity. Taxanes and platinum analogs are well known to show neurotoxicity (14). These data may explain why adding taxanes to GEM and platinum improved overall survival but worsened neurotoxicity (15). These suggest the importance of more detailed in vitro study that can propose the optimal dose for the treatment.
Among the 8 molecular-targeted drugs, only Bmib, proteasome inhibitor, showed excellent tumor-specificity (TS>505, PSE>38838817) (Table I). Bmib is mainly used as a therapeutic agent for refractory multiple myeloma in hematology clinic, due to its potent anti-tumor activity and yet-unknown biological function (16). It has been reported that Bmib caused the high incidence of neutropenia and stomatitis (17), peripheral neuropathy (18) and epidermal necrolysis (19). We also found potent cytotoxicity of Bmib against OSCC cell lines as well as normal oral cells, especially oral keratinocytes. Therefore, application of the cytotoxic chemotherapeutic agents in combination with Bmib in immuno-compromised patients could further increase the incidence of side effects (16). The other 7 molecular-targeted drugs (Cmab, Emab, Rmab, Bmab, Tmab, Pmab, Nmab) showed much lower antitumor potency (TS=1~3.6; PSE=0.01~0.2), and some of them (Cmab and Nmab) showed potent keratinocyte toxicity (Figure 2 and unpublished data). Clinical investigation revealed the incidence of dermatitis and acneiform rash (20) (Cmab) and myocarditis with or without a complete heart block by Cmab and Nmab (21).

Combination effect of two types of anticancer drugs. HSC-2 cells were incubated for 48h with the indicated sets of compounds, and CI index was then determined as described in Materials and Methods.
The present study demonstrated that Cmab and classical anticancer drugs, when added simultaneously, inhibited the growth of HSC-2 cells in an additive fashion (Figure 4). This supports the present regimen that recommends administration of Cmab first, followed by classic anticancer drugs, considering the absence of synergism in the simultaneous administration. Furthermore, the popular FOLFOX regiments for treatment of colon cancer patients use L-OHP and 5-FU sequentially (22), and FOLFIRI regimen uses IRT and 5-FU sequentially (23). We also observed that combination of 5-FU and other classical anticancer drugs produced rather antagonistic interaction, that could increase the incidence of side effects. Based on these results, administration of a single chemotherapeutic agent, rather than a combination seemed to be preferable. To find drugs with synergistic effect, which include the concomitant use of radiation therapy (24) is another choice.

Cell-cycle analysis of HSC-2 cells treated with various anticancer drugs. Cells were incubated for 24 h with actinomycin D (positive control), Cmab (625 μg/ml), CDDP (0.4, 0.8 μg/ml) or 5-FU (11.6, 23.2 μg/ml) alone or in combination, and then assessed for cell-cycle distribution by cell sorting. The differences between groups were evaluated by one-way analysis of variance (ANOVA) followed by Bonferroni's post-hoc test for multiple comparisons. A value of *p<0.05 compared with positive control.
Lastly, we investigated the correlation between the maximum serum concentration (Cmax) after administration of the indicated doses (cited from the interview form from the supplier pharmaceutical companies) (Table III), and in vitro cytotoxicity against OSCC (B) and normal cells (D) (derived from Table I). When Cmax of each compound was divided by the CC50 for normal cells (D), most of the compounds except CDDP and DOX showed the value below 1 (Cmax/D in Table III), indicating that clinical administration may not be so harmful. When the Cmax was divided by the CC50 for OSCC, NabPTX, PTX, GEM, DTX and Bmib showed very high values (Cmax/B=100, 283, 5590, 4082 and 172, respectively), indicating that clinical administration of these drugs can yield an efficient anticancer effect.
Conclusion
The present study with a total of 20 clinically used antitumor drugs demonstrated that classical antitumor drugs showed higher cytotoxicity and antitumor potential as compared with molecular-targeted drugs except bortezomib. When the antitumor potential of all compounds (either TS or PSE) was plotted as a function of cytotoxicity (CC50), highly significant correlation curves were produced. This suggests that the anti-tumor potential of any unknown anticancer drug candidate can be easily estimated from this regression line. Simultaneous addition of both types of anticancer drugs failed to induce apoptosis nor synergistic growth inhibition, suggesting the necessity of reconsidering the antitumor potency of the present combination regimens with more than two compounds. The present TS monitoring system may provide useful information for building up the treatment regimens of anticancer drugs.
Correlation between clinical data of maximum serum concentration (Cmax) and cytotoxicity of 20 anticancer drugs (determined in this study). Cmax was obtained from the interview form from the supplier. CC50 for OSCC (B) and normal oral cells (D) are derived from Table I.
Acknowledgements
This work was partially supported by KAKENHI from the Japan Society for the Promotion of Science (JSPS) (16K11519).
Footnotes
Authors' Contributions
Y.I. and H.S. performed most of the experiments of the present study and wrote the manuscript. K.B. performed the cell cycle analysis and reviewed the manuscript. S.H., M.S., T.K., N.H. and H.S. provided the interpretation of experimental results, and edited the manuscript.
This article is freely accessible online.
Conflicts of Interest
The Authors confirm that there are no known conflicts of interest associated with this publication and there has been no significant financial support for this work that could have influenced its outcome.
- Received November 13, 2019.
- Revision received November 19, 2019.
- Accepted November 20, 2019.
- Copyright© 2019, International Institute of Anticancer Research (Dr. George J. Delinasios), All rights reserved
References
In this issue


Jump to section
Related Articles
Cited By...
- Potentiation of Anticancer Activity of G2/M Blockers by Mild Hyperthermia
- Inhibition of Neurotoxicity/Anticancer Activity of Bortezomib by Caffeic Acid and Chlorogenic Acid
- Accelerated Fractionation With Concomitant Boost vs. Conventional Radio-chemotherapy for Definitive Treatment of Locally Advanced Squamous Cell Carcinoma of the Head-and-Neck (SCCHN)
- Comparison of Conventional Fractionation and Accelerated Fractionation With Concomitant Boost for Radiotherapy of Non-metastatic Stage IV Head-and-Neck Cancer
- Antitumor Effects and Tumor-specificity of Guaiazulene-3-Carboxylate Derivatives Against Oral Squamous Cell Carcinoma In Vitro
- Protection of Bortezomib-induced Neurotoxicity by Antioxidants
- Biological Properties of the Aggregated Form of Chitosan Magnetic Nanoparticle
- Augmentation of Neurotoxicity of Anticancer Drugs by X-Ray Irradiation