


Article Figures & Data
Figures
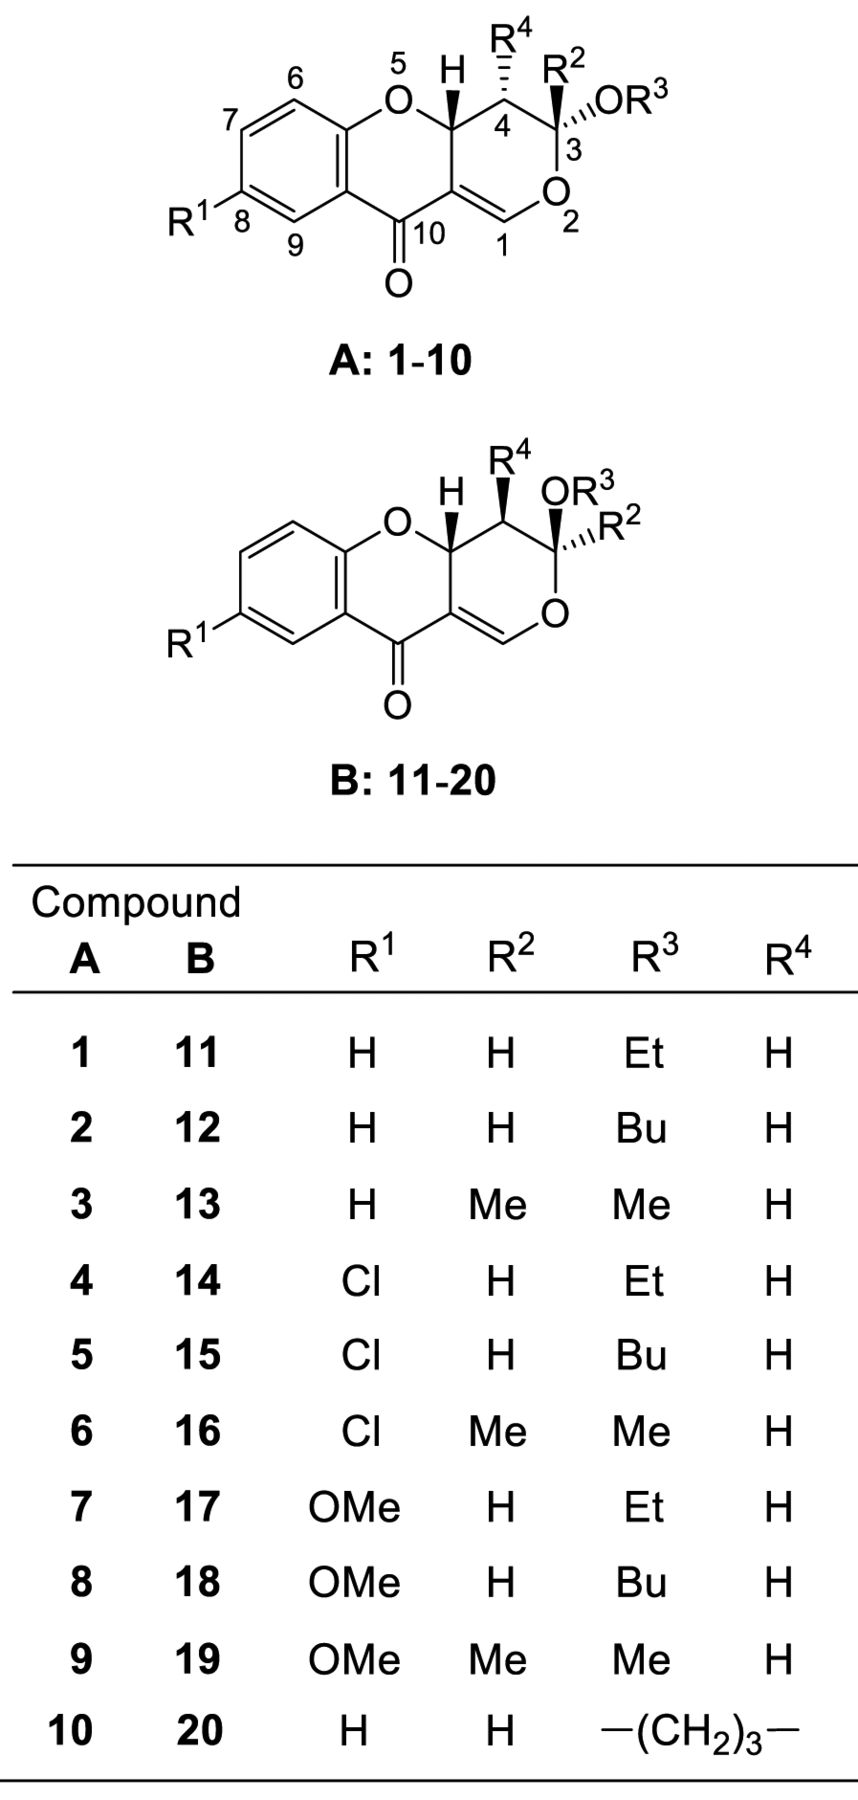
- Figure 1.
Structure of 20 pyrano[4,3-b]chromones investigated in this study.
- Figure 2.
Cytotoxicity of compounds 16 and 17 against human oral squamous cell carcinoma cell lines Ca9-22 and HSC-2, and human normal oral cells, human gingival fibroblast (HGF) and human periodontal ligament fibroblast (HPLF). Cells were incubated for 48 h without (control) or with the indicated concentrations of 16 or 17, and cell viability was determined by MTT method, and expressed as a percentage that of the control. Each value represents the mean±S.D. of triplicate assays.
- Figure 3.
Correlation of tumor-specificity (TS) and potency-selectivity expression (PSE) for diastereomer pairs from A (1-10) and B (11-20) series of compounds, plotted per pair: (1, 11), (2, 12), (3, 13), (4, 14), (5, 15), (6, 16), (7, 17), (8, 18), (9, 19) and (10, 20). Fitted curves or lines and r2 values were calculated by Microsoft Excel (Windows 10, Microsoft Corporation, Redmond, WA, USA). Correlations are shown for TS and PSE values for all oral squamous cell carcinoma (OSCC) cell lines versus non-malignant cells (left), and paired cells derived from the same (gingival) tissue (right).
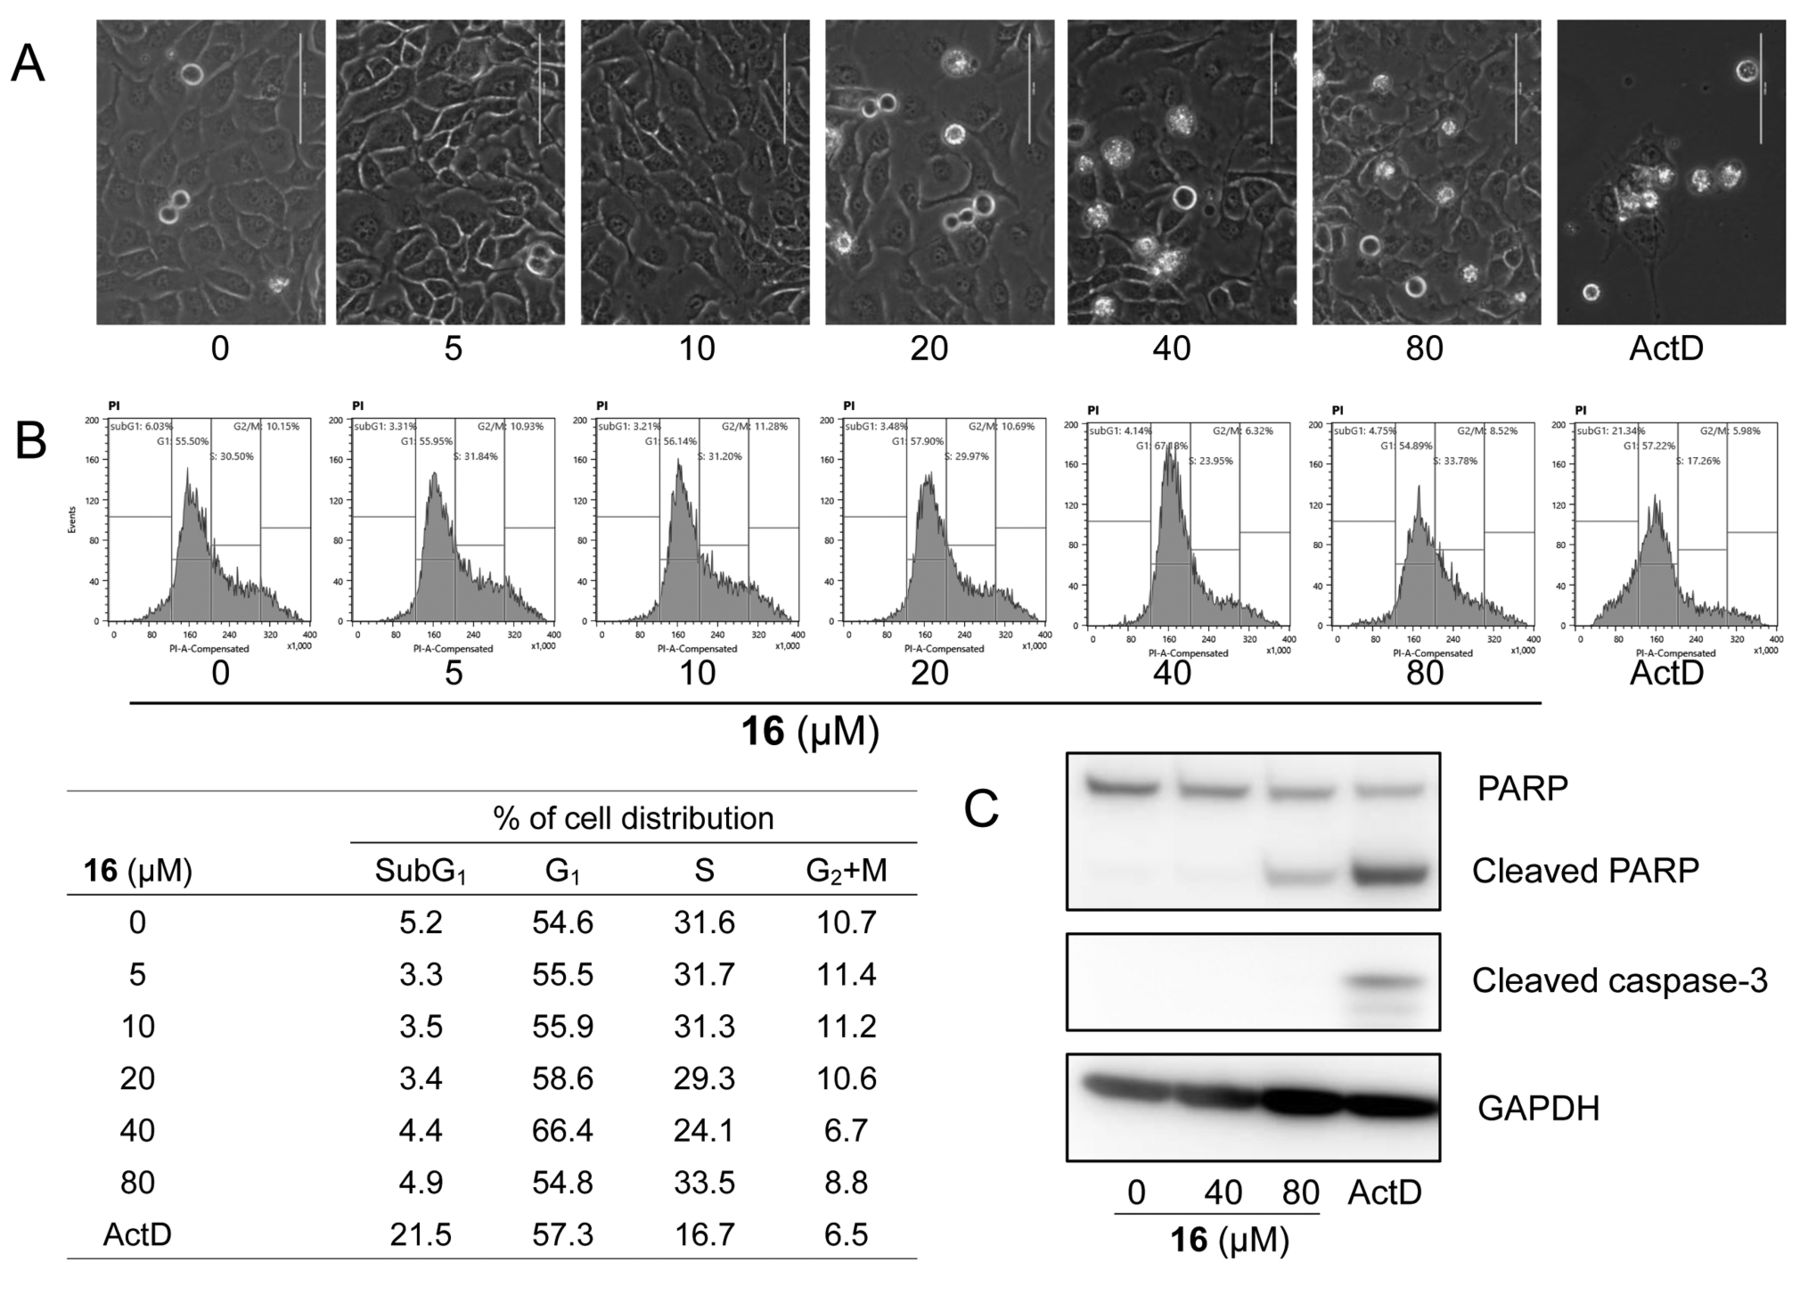
- Figure 4.
Effect of compound 16 on cell morphology (A), cell-cycle distribution (B) and expression of apoptosis-related proteins (C) in oral squamous cell carcinoma cell line HSC-2. Cells were incubated for 24 h with the indicated concentrations of 16 or 1 μM actinomycin D (Act D) as positive control and then assessed for morphology under light microscopy (EVOS FL; Thermo Fisher Scientific), cell-cycle distribution by cell sorting and apoptosis induction by western blot. Bar=100 μm. GAPDH: Glyceraldehyde 3-phosphate dehydrogenase, PARP: poly (ADP-ribose) polymerase.
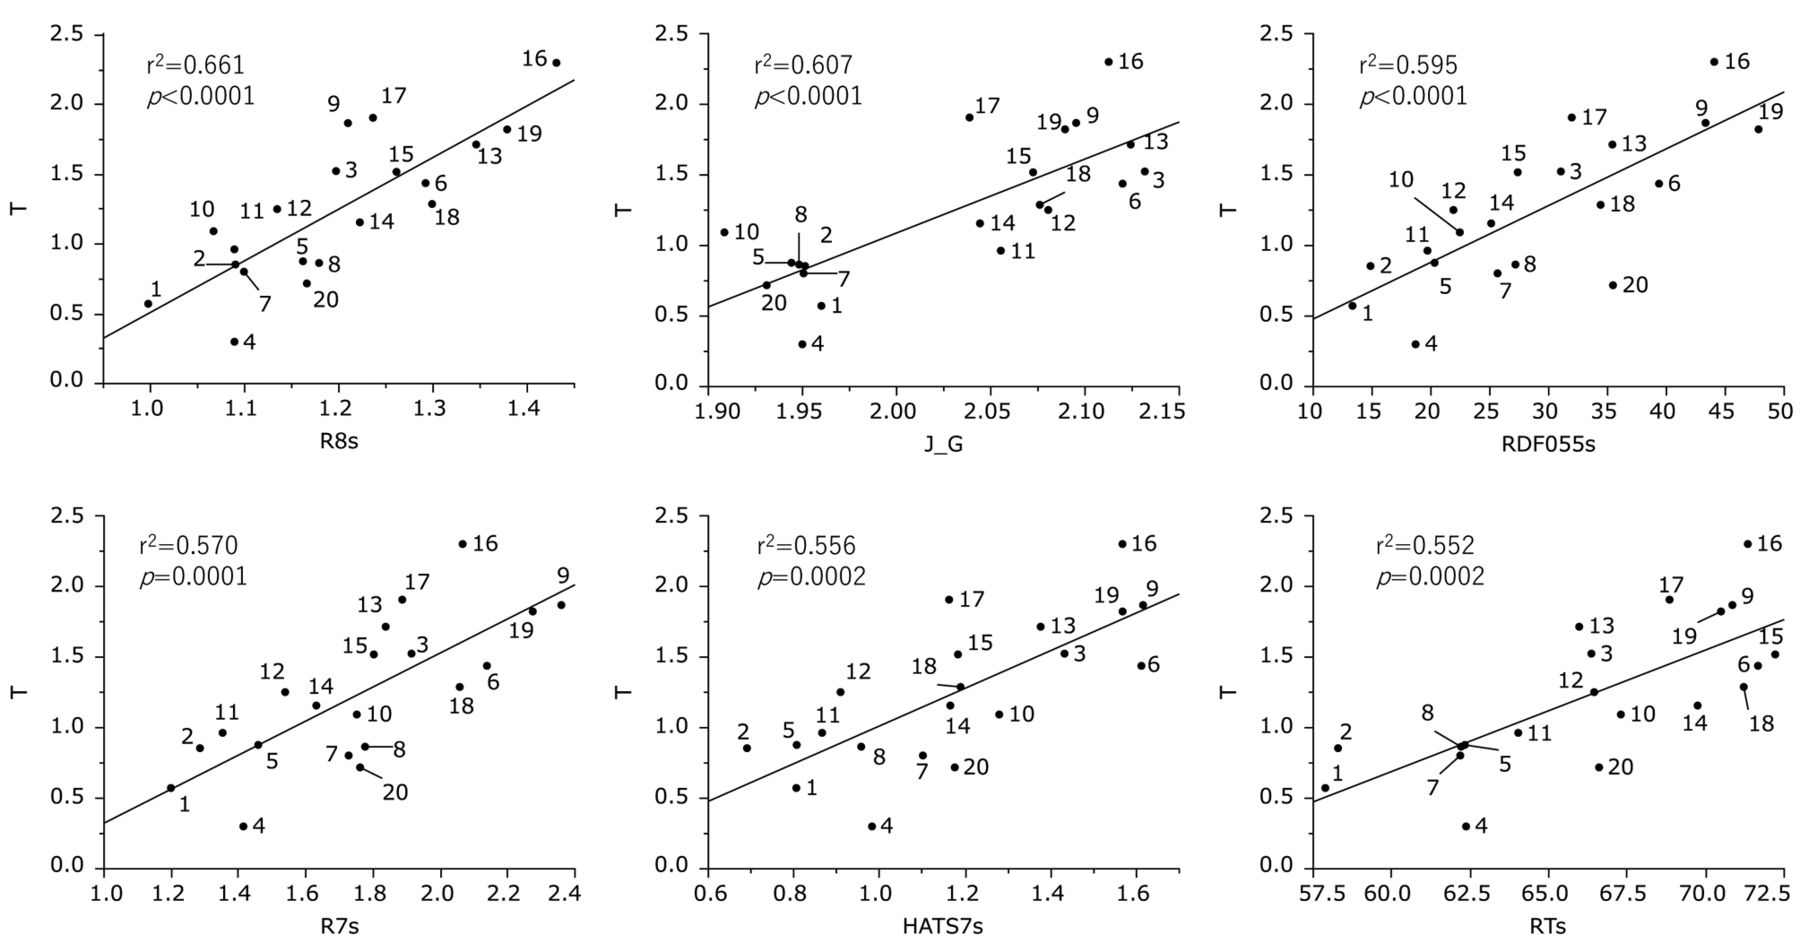
- Figure 5.
Determination of correlation coefficient between chemical descriptors and cytotoxicity of 20 pyrano[4,3-b]chromones against tumor cells. The mean values of the negative log of the concentration of compound that reduced the viable cell number by 50% (CC50) (T) against tumor cells were plotted. CC50: Concentration of compound that reduced the viable cell number by 50%. The following chemical descriptors were used: HATS7s, R7s, R8s, RTs: 3D shape, size and electric state; J_G: 3D shape; RDF055s: 3D shape and electric state.
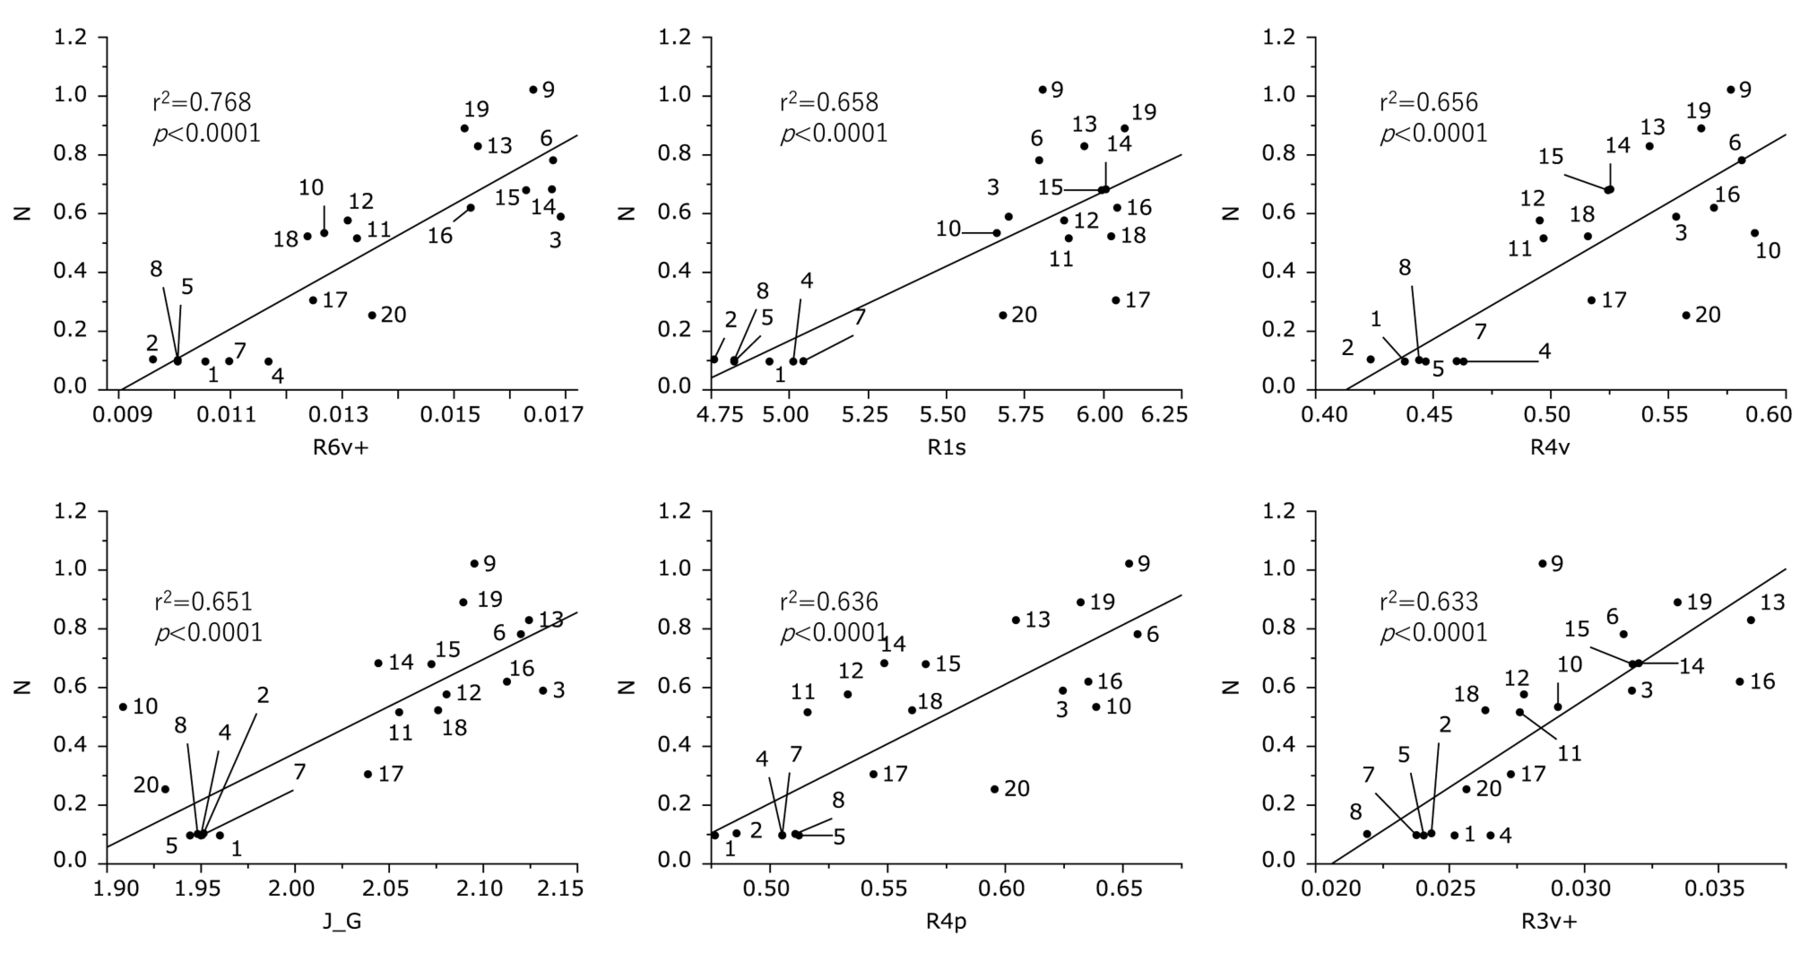
- Figure 6.
Determination of correlation coefficient between chemical descriptors and cytotoxicity of 20 pyrano[4,3-b]chromones against normal cells. The mean values of the negative log of the concentration of compound that reduced the viable cell number by 50% (CC50) (N) against normal cells were plotted. The following chemical descriptors were used: R3v+, R4v, R6v+: 3D shape and size; R1s: 3D shape, size and electric state; J_G: 3D shape; and R4p: 3D shape, size and polarizability.
- Figure 7.
Determination of coefficient between chemical descriptors and tumor specificity of 20 pyrano[4,3-b]chromones [defined as: cytotoxicity against tumor cells–cytotoxicity against normal cells (T–N)]. The following chemical descriptors were used: R8s: 3D shape, size and electric state; HATS3i, HATS7i, 3D shape, size and ionization potential; HATS3u, HATS7u: 3D shape and size; Mor10i: 3D shape and ionitation potential.


