


Abstract
Background/Aim: N-(4-hydroxyphenyl)retinamide (4-HPR) is a synthetic retinoid, less toxic than the parent all-trans retinoic acid (RA). Unlike RA, 4-HPR induces apoptosis in tumor cells. Because 4-HPR can hydrolyze to liberate RA, a potent human teratogen, the unhydrolyzable ketone analog of 4-HPR, 4-hydroxybenzylretinone (4-HBR) has been prepared and has been found to cause apoptosis in tumor cells and shrink carcinogen-induced rat mammary tumors as 4-HPR does. Herein, we examined the mechanism whereby 4-HPR and 4-HBR induce apoptosis and death in breast cancer cells. Materials and Methods: Gene expression profiling was conducted in MCF-7 cells over a 1.5- to 6-h time course and changes were validated by quantitative polymerase chain reaction (qPCR). Growth arrest and DNA damage-inducible protein 153 (GADD153 or C/EBP homologous protein, CHOP) was knocked down and the effect on 4-HPR-induced cell death and gene expression was assessed. 4-HPR synergy with tumor necrosis factor (TNF)-related apoptosis-inducing ligand (TRAIL or Apo2 ligand) was also examined. Results: Drug treatment induced increased expression of endoplasmic reticulum (ER) stress-related and pro-apoptotic genes. Gene expression changes were verified by qPCR in three invasive ductal breast carcinoma cell lines (MCF-7, T-47D, MDA-MB-231). GADD153 showed the largest increase in the microarray experiment; however, knockdown of GADD153 did not abrogate apoptosis and death. Genes related to the extrinsic pathway of apoptosis including a receptor for TRAIL, death receptor 5 (DR5), were up-regulated by drug treatment. A dose of 4-HPR that alone is ineffective in killing TRAIL-resistant MCF-7 cells, synergized with recombinant TRAIL to induce breast cancer cell death. Conclusion: 4-HPR and analogs might be useful in sensitizing tumor cells to death receptor agonists.
N-(4-hydroxyphenyl)retinamide (4-HPR) and its non-hydrolyzable analog, 4-hydroxybenzylretinone (4-HBR), induce apoptosis and cell death in a variety of cell types including breast cancer, neuroblastoma and leukemia cells (1, 2). Both drugs are active in vivo and reduce the size and number of dimethylbenz[a]anthracene (DMBA)-induced mammary tumors in rats (3, 4). In vivo and in vitro studies on the effects of the non-hydrolyzable analog 4-HBR have supported that liberation of free retinoic acid (RA) from 4-HPR is not required to induce cell death (1). Earlier work has suggested that 4-HPR and 4-HBR act by similar mechanisms and that induction of endoplasmic reticulum (ER) stress plays a role in the ability of both compounds to induce cell death (2).
4-HPR induces apoptosis and death in many cancer cell types through activation of the intrinsic pathway, although the initiating event is unknown (5). In breast cancer cells, 4-HPR decreases levels of B-cell lymphoma 2 (BCL-2) (6) and results in the release of cytochrome c, activates caspase-3, and induces poly (ADP-ribose) polymerase (PARP) cleavage (7). 4-HPR has been shown to stimulate redox-sensitive ceramide production; however, blocking of this action did not prevent the 4-HPR-induced decline in cell survival (8). Moreover, 4-HPR increases the levels of free radical nitric oxide (NO) and although abrogation of NO has been shown to reduce the growth inhibitory activities of 4-HPR, its effect on apoptosis is unknown (9, 10). It has been shown that exposure of a number of cancer cell lines to 4-HPR results in ER stress (11, 12). Our group has previously demonstrated that both 4-HPR and 4-HBR up-regulate ER stress-related genes including growth arrest and DNA damage 153 (GADD153) and BCL2 binding component 3 (BBC3 or PUMA) in breast cancer cells, suggesting a role for ER stress in the mechanism of action for both drugs (2).
The ER of eukaryotic cells is the first compartment in the secretory pathway and is responsible for protein folding and a multitude of post-translational modifications. Cellular stress leads to impairment of protein folding and activates the unfolded protein response (UPR), which aims to reduce the accumulation of misfolded proteins under conditions of mild ER stress (13, 14). However, uncontrolled ER stress can lead to activation of apoptotic cell death mechanisms (15, 16).
ER stress is sensed by the transmembrane proteins protein kinase R (PKR)-like ER kinase (PERK), inositol-requiring enzyme 1 (IRE1), and activating transcription factor 6 (ATF6). Under resting conditions, the ER luminal domain of these sensors is associated with binding immunoglobulin protein (BIP or GRP78), which maintains them in an inactive state. Upon ER stress, BIP binds to unfolded proteins resulting in release and activation of the sensors (16, 17). Activation of signal transduction downstream of the ER sensor proteins leads to suppression of protein translation and ER-associated degradation of terminally misfolded proteins. Upon persistent ER stress, key transcriptional activators such as activating transcription factor 4 (ATF4) are up-regulated leading to further induction of downstream target stress-responsive genes, including the transcription factors activating transcription factor 3 (ATF3) and GADD153 (13).
GADD153 is an initiator of ER stress-induced apoptosis (18, 19). It up-regulates the expression of certain BCL-2 family members including BCL-2 homology 3 (BH3)-only proteins (BBC3 or PUMA and BIM) and decreases BCL-2 expression (20, 21). The BCL-2 family proteins are essential regulators of the intrinsic pathway of ER stress-induced apoptosis (22, 23). The pro-apoptotic executioner family members, BAX and BAK, oligomerize and permeabilize both the ER and mitochondrial membranes leading to the release of calcium and cytochrome c, respectively. The BH3-only activators, truncated BID (tBID), BIM and BBC3, directly engage BAX and BAK to trigger cytochrome c release, whereas the sensitizers, BAD and phorbol-12-myristate-13-acetate induced protein 1 (PMAIP1 or NOXA), bind to and antagonize anti-apoptotic BCL-2 members releasing more activator BH3-only proteins (15, 22, 24).
In an effort to better understand how 4-HPR initiates cell death, and to compare its activity to that of the non-hydrolyzable analog 4-HBR, cDNA microarray analysis was used to investigate temporal changes in gene expression at early times after the exposure of MCF-7 breast cancer cells to these drugs. Herein we report that gene changes induced by 4-HPR and 4-HBR are remarkably similar, with both affecting a similar cadre of ER stress- and apoptotic pathway-related proteins. We also describe a role for 4-HPR in sensitizing previously unresponsive breast cancer cells to the effects of the death receptor ligand, tumor necrosis factor (TNF)-related apoptosis-inducing ligand (TRAIL).
Materials and Methods
Chemicals and cell culture. 4-HPR was kindly provided by McNeil Pharmaceuticals (Springhouse, PA, USA). 4-HBR was synthesized as previously described (4). MCF-7, T-47D, and MDA-MB-231 cell lines were obtained from American Type Culture Collection (Rockville, MD, USA). MCF-7 and T-47D cells were cultured as previously described (2). MDA-MB-231 cells were cultured in Leibovitz's L-15 basal medium (Sigma-Aldrich, St. Louis, MO, USA) supplemented with 10% fetal bovine serum (Thermo Scientific, Rockford, IL, USA) at 37°C in air atmosphere.
Microarray experiments. MCF-7 cells were seeded in 6-well plates (5×10⁶ cells/well in 2 ml). After two days, cells were treated with vehicle (0.2% ethanol) or 4-HPR or 4-HBR (31.6 μM) and were collected at various timepoints for analysis. After treatment, floating and adherent cells were harvested, the latter using Accutase (1 ml; Innovative Cell Technologies, San Diego, CA, USA), and pooled together. Cells were collected by centrifugation, and the pellet was flash-frozen in liquid nitrogen and stored at −80°C until RNA extraction was performed. For microarray analysis, three separate experiments were performed to produce 3 biological replicates for each drug.
The RNeasy mini kit from Qiagen (Hilden, Germany) was used to extract RNA. The generation and labeling of cDNA probes, hybridization and washing of microarrays were performed by the University of Wisconsin-Madison Biotechnology Gene Expression Center. The GeneChip Human Gene 1.0 ST Array containing 28,869 well-annotated genes and 764,885 distinct probes (Affymetrix, Santa Clara, CA, USA) was used in these experiments. Chips were post-processed on the AFX Fluidics450 Station and were scanned on the GC3000 G7 Scanner (Affymetrix). Data was extracted and processed using the Affymetrix Command Console and custom R scripts (R package Version 2.8.1) (25). Data from all 27 microarrays were normalized by robust multi-array averaging using xps, version 1.0.2, in order to remove background and array effects, and to obtain gene-level expression measurements (26). Differentially expressed genes were identified by gene-specific analysis of variance (ANOVA), which allowed measurement of expression changes while accounting for multiple sources of variation. In the ANOVA formalism (27) logarithmic-scale expression data were decomposed additively into the effects from treatment type (vehicle, 4-HBR, 4-HPR), treatment time (1.5, 3, 6 h) with a blocking factor to account for the triplicate experimental replication. The ANOVA linear model also encoded possible interactions which allow the magnitude of differences, for example between 4-HBR and control, to depend on the time factor. More specifically, the R-language coding implementation is: [fit<-lm(log.expression~block+type*time)] (25). A primary list of treatment-associated transcripts was obtained by computing ANOVA p-values for treatment main effects, and then applying the Benjamini-Hochberg multiplicity adjustment, retaining transcripts at the 1% false discovery rate (FDR). A secondary list of transcripts for which 4-HBR and 4-HPR have differential effects was obtained using an uncorrected p=0.01 threshold applied to the appropriate interaction term, restricting analysis to transcripts from the primary list.
Gene ontology (GO) term enrichment analysis. Clustering of primary transcripts (880) with significant treatment effects was performed using Cluster 3.0 (clustering method: robust K-means clustering, similarity metric: Pearson correlation) (28). Subsequent hierarchical clustering of individual groups was performed and Java Treeview was used to produce heat maps (similarity metric: Euclidean distance, clustering method: centroid linkage) (29).
Each cluster was subjected to GO term enrichment analysis using Database for Annotation, Visualization and Integrated Discovery (DAVID) (30, 31) to identify significant gene categories associated with the Biological Processes domain of the GO Consortium. Overall major categories of biological processes were formed by manually combining specific subcategory terms having related or overlapping functions with the assistance of GOrilla (32) and REViGO online tools (33).
Live cell number and TUNEL assays. Time course viability (live/dead cells) and TUNEL assays were performed as described previously (2). Cells were examined at various time points (12-48 h) after treatment with vehicle (0.2% ethanol) or 4-HPR (10 or 31.6 μM). Total and live cell numbers were assessed after staining with fluorescein diacetate followed by counting on a Cellometer Auto X4 (Nexcelom, Lawrence, MA, USA). The number of cells undergoing apoptosis was determined by TUNEL staining using the In Situ Cell Death Detection Kit (Roche Applied Science, Indianapolis, IN, USA).
Knockdown of GADD153. Control (scrambled) and GADD153 small hairpin RNA (shRNA; sc-35437-V) lentiviral particles (Santa Cruz Biotechnology, Santa Cruz, CA, USA) were used to generate MCF-7 cells stably expressing a scrambled or GADD153 shRNA. Cells were seeded in 12-well plates at 1×10⁵ cells/well (1 ml medium/well), allowed to attach overnight, and then were treated with polybrene (5 μg/ml) followed by the dropwise addition of 20 μl of the lentiviral particles. Cells were transduced with copGFP control lentiviral particles (Santa Cruz Biotechnology) to monitor transduction efficiency. Stable clones were selected with puromycin (2 μg/ml). Immunoblot analysis of protein and quantitative polymerase chain reaction (qPCR) of GADD153 transcript (see below) was performed to verify GADD153 knockdown.
Quantitative real-time PCR. Total RNA (1 μg) was reverse-transcribed using the High Capacity cDNA Reverse Transcription Kit (Applied Biosystems, Foster City, CA, USA) and real-time quantitative PCR was performed on either a LightCycler (Roche) using LightCycler FastStart DNA master SYBR Green I or a StepOne Plus PCR System (Applied Biosystems) using Fast SYBR Green Master Mix, all according to the manufacturers' protocols. The LightCycler protocol was as follows: denaturation at 95°C for 15 s, primer annealing at 62°C for 5 s, and extension at 72°C for 10 s, for a total of 55 cycles with a concentration of 0.5 μM for each primer. The StepOne cycler protocol consisted of a holding stage of 95°C for 20 s, followed by 50 cycles of denaturation at 95°C for 1 s and annealing/extension at 60°C for 20 s. Primer concentrations ranged from 0.05 to 0.9 μM. Values were normalized to β-actin expression levels and were expressed as fold-change compared to the control vehicle-treated samples. The following primer sets were used (upstream, downstream): GADD153, 5’-GCC TTT CTC CTT CGG GAC AC-3’, 5’-TCT GCT GGT TCT GGC TCC TC-3’; PERK (EIF2AK3), 5’-AGA CTG GAT GAA TGG ACG ATG-3’, 5’-ATG TTG GAT GGC TTG AGG TC-3’; HERPUD1, 5’-CCA GCC CCT ATT CAC AAC CA-3’, 5’-CGT CAG GAG GAG GAC CAT CA-3’; PPP1R15A (GADD34), 5’-GAA CGC GCT GGC CTC CCT AA-3’, 5’-TGA TGG GGT GCT TGG CCT GG-3’; ATF3, 5’-CTA ACC TGA CGC CCT TTG TC-3’, 5’-GCT ACC TCG GCT TTT GTG AT-3’, HSPA5 (BIP), 5’-TCC TAT GTC GCC TTC ACT CC-3’, 5’-ATG TCT TTG TTT GCC CAC CT-3’; CHAC1, 5’-TGA GGA GAA GGA GCC CTG TA-3’, 5’-AGT GGC CCA GAC AGA CAA GT-3’; DDIT4 (REDD1), 5’-GCA CTG GCT TCC GAG TCA TC-3’, 5’-TAT TCC CCC ACC TCC ACC TT-3’; PMAIP1 (NOXA), 5’-TGA AGG GAG ATG ACC TGT GA-3’, 5’-GAG TGG GCA CTG AAA AGC AA-3’; TNFRSF10B (DR5), 5’-CTT GGA GAC GCT GGG AGA GA-3’, 5’-GGG TGA TGT TGG ATG GGA GA-3’; TNFRSF21 (DR6), 5’-CCC CAC CAC AGA CAC ATC CT-5’, 5’-AGC CCT GCC TTT TCC ACA AT-3’; GDF15 (PLAB), 5’-TCA GGA CGG TGA ATG GCT CT-3’, 5’-CGC ACT TCT GGC GTG AGT ATC-3’; TNFRSF10A (DR4), 5’-TTG TTC CGT TGC TGT TGG TG-3’, 5’-CTG GCT TTC CAT TTG CTG CT-3’; TNFRSF11B (OPG), 5’-GGC ACC AAA GTA AAC GCA GA-3’, 5’-TTA TTC GCC ACA AAC TGA GCA-3’; β-actin, 5’-AGC ACA GAG CCT CGC CTT T-3’, 5’-CAC GAT GGA GGG GAA GAC-3’; and CASP8, 5’-ACC CCG CCA ACA GCT TCA GA-3’, 5’-AAC CAG GGG CTG CTC AGA CA-3’.
SDS-PAGE and immunoblotting. For GADD153, cleaved caspase-8, BID, and β-actin detection, cells were lysed in SDS sample buffer (2% SDS, 10% glycerol, 0.002% bromophenol blue, 0.0625 M Tris-HCl, 5% β-mercaptoethanol) and resolved on AnyKD Mini-PROTEAN TGX Precast Gels (Bio-Rad, Hercules, CA, USA). Proteins were transferred onto a 0.2 μm nitrocellulose membrane (Bio-Rad) for 2 h at 70 V. Membranes were blocked with 2.5% nonfat dry milk powder in Tris-buffered saline (TBS; 20 mM Tris, 137 mM NaCl, pH 7.5 at room temperature) with 0.1% Tween-20 (TBS-T) followed by incubation with primary antibodies against GADD153 (Santa Cruz, CA, USA; sc-7351, 1 μg/ml), DR5 (ProSci, Poway, CA, USA; 2019, 0.33 μg/ml), cleaved caspase-8 (9496; Cell Signaling Technology, Danvers, MA, USA, 1:500), BID (Cell Signaling Technology; 2002, 1:500) and β-actin (Sigma-Aldrich; A5441, 1:8000). Membranes were then washed in TBS-T and incubated with HRP-conjugated secondary antibody (1010-05 and 4010-05, Southern Biotech Birmingham, AL, USA) in blocking buffer. After washing in TBS-T, immunoblots were visualized using the SuperSignal West Pico Chemilumnescent kit (Thermo Scientific) and exposure to CL-XPosure X-ray film (Thermo Scientific).
For DR5 protein analysis and the β-actin control, cells were lysed in 100-300 μl RIPA buffer (150 mM sodium chloride, 1% NP-40, 0.5% sodium deoxycholate, 0.1% SDS, 50 mM Tris pH 8.0) containing protease inhibitors (cOmplete ULTRA protease inhibitor cocktail, Roche). Lysates were centrifuged at 16,000 g at 4°C, supernatant was collected and diluted 1:1 in 2X SDS sample buffer. Immunoblots were quantitated by densitometry using a Personal Densitometer SI (Molecular Dynamics/Amersham, GE Healthcare, Piscataway, NJ, USA). Film exposures were scanned into the ImageQuant program, background was subtracted from boxed regions of interest, and the value for the DR5 protein band was normalized to that of β-actin.
Analysis of TRAIL synergy. MCF-7 cells were seeded in 12-well plates at 50,000 cells/well in 1 ml of medium, allowed to attach overnight, and were treated with 4-HPR for 24 h in the presence or absence of 250 ng TRAIL/Apo2 ligand (PeproTech, Rocky Hill, NJ, USA) for the final 16 h of the experiment.
Statistical analysis for quantitative PCR and cell assays. Analyses were performed in Microsoft Excel 16.14 or GraphPad Prism 6.0 (GraphPad Software, Inc., La Jolla, CA, USA). A t-test was used to compare mRNA levels in drug treated cells to the vehicle sample collected at each timepoint. One-way or two-way analysis of variance (ANOVA) was used with Tukey's post-hoc multiple comparisons to analyze 4HPR/TRAIL synergy. All other multi-group analyses were performed using a two-way ANOVA with Tukey's post-hoc multiple comparisons test. Results are presented as mean±standard error of the mean. Statistical significance was defined as p≤0.05.
Results
Microarray analysis identifies genes involved in ER stress, apoptosis, and cell death as major drug targets. To gain insight into the mechanism whereby 4-HPR and 4-HBR induce cell death, a microarray experiment was performed in MCF-7 breast cancer cells exposed to drug or vehicle for 1.5, 3 or 6 h. Out of a total of 28,869 well-annotated genes present on the microarray, 880 genes were differentially expressed relative to treatment at a 1% corrected p-value (data available on request). Clustering (Cluster 3.0) was performed to group genes showing similar changes with time and a heat map was constructed using Java Treeview (Figure 1). Transcript changes were highly similar at all times for the two drug treatments when compared to vehicle-treated cells, with only 61 of the 880 transcripts differing between 4-HPR and 4-HBR (data available on request). The direction of gene expression change was the same for both drugs for the 61 transcripts, and only the magnitude of the change differed. Thus, 4-HPR and 4-HBR act similarly on the transcriptome of MCF-7 cancer cells.
The DAVID database was used to look for enriched categories of biological processes, as defined in the GO database. GO term enrichment transcript clusters were assembled using terms with overlapping functions with the assistance of GOrilla and REViGO (Figure 2). Group 1, containing genes with the largest degree of up-regulation between 3 and 6 h, was enriched in transcripts with GO terms associated with response to stress, regulation of apoptosis, death, and the ER-nuclear signaling pathway, with the majority being ER-stress related. Group 2, containing transcripts most up-regulated from 1.5 to 3 h, also contained genes involved in cell death.

Heat map of transcript clusters. The 880 transcripts with significant treatment effect (<1% false discovery rate) are represented as rows and experimental groups (4-HPR and 4-HBR) as columns. Yellow indicates an increase in expression over vehicle during the time period being assessed and cyan indicates a decrease (black indicates no change). The genes are arranged vertically into 6 groups based on similarity of expression pattern over time, defined by a robust K-means clustering algorithm. Groups 1-3 were up-regulated at late, intermediate, and early times, respectively; whereas Groups 4-6 were down-regulated at these time intervals. The number of genes per group, as well as the percentage of total genes is presented. The values on the color bar represent log2 expression ratios (1.5 h) or differences in the log2 ratios (1.5-3 h or 3-6 h) for which the highest value (positive and negative) is set arbitrarily equal to +1.0 or −1.0, respectively.

Gene ontology (GO) term enrichment of transcript clusters. Gene clusters in Figure 1 were analyzed using GOrilla, DAVID, and REViGO to determine enriched GO terms in each cluster. Bar charts represent the genes with the indicated GO term present in the cluster as a percentage of the total number of annotated genes on the array (array; grey bar) or as a percentage of the total number of genes in the cluster (cluster; black bar). Cell death and ER stress-related GO terms are in bold.
Changes in the expression of selected sets of ER stress-related transcripts as well as those involved in apoptosis and cell death were confirmed by qPCR in mRNA from MCF7 cells exposed to 4-HPR or 4-HBR over a time course of 1.5, 3, 6 and 12 h. An increase in 7 selected ER-stress-related transcripts: ATF3, BIP, ChaC glutathione specific gamma-glutamylcyclotransferase 1 (CHAC1), GADD34, GADD153, homocysteine-inducible ER protein with ubiquitin-like domain 1 (HERPUD1), and PERK (Figure 3); as well as changes in 8 involved in apoptosis and cell death: increase in caspase 8 (CASP8), DNA damage-inducible transcript 4 protein (DDIT4), DR4, DR5, DR6, NOXA, and placental bone morphogenetic protein (PLAB), and a decrease in osteoprotegerin (OPG) (Figure 4) was confirmed. These same transcripts underwent similar changes in T-47D and MDA-MB-231 cells (Figures 3 and 4), breast cancer cell lines that also undergo apoptosis and cell death in response to 4-HPR and 4-HBR (2) and data not shown.

4-HPR and 4-HBR increased the expression of specific endoplasmic reticulum (ER) stress-related genes. Bar charts present the results from quantitative PCR analysis of ATF3, BIP (HSPA5), CHAC1, GADD34, GADD153, HERPUD1, and PERK mRNA levels in MCF-7, T-47D, and MDA-MB-231 cells treated with vehicle, 4-HPR, or 4-HBR (31.6 μM). Transcript values are normalized to β-actin and expressed as fold-change from vehicle-treated control cells. The graphs are representative of 3-4 independent experiments and t-test was performed for statistical analysis (*p≤0.05, **p≤0.01, ***p≤0.001, ****p≤0.0001). 4-HPR, N-(4-hydroxyphenyl)retinamide; 4-HBR, 4-hydroxybenzylretinone; ATF3, activating transcription factor; BIP, binding immunoglobulin protein; CHAC1, ChaC glutathione specific gamma-glutamylcyclotransferase 1; GADD34, growth arrest and DNA damage-inducible protein 34 or protein phosphatase 1 regulatory subunit 15A; GADD153, growth arrest and DNA damage-inducible protein 153; HERPUD1, homocysteine-inducible ER protein with ubiquitin-like domain 1; PERK, protein kinase R (PKR)-like ER kinase.
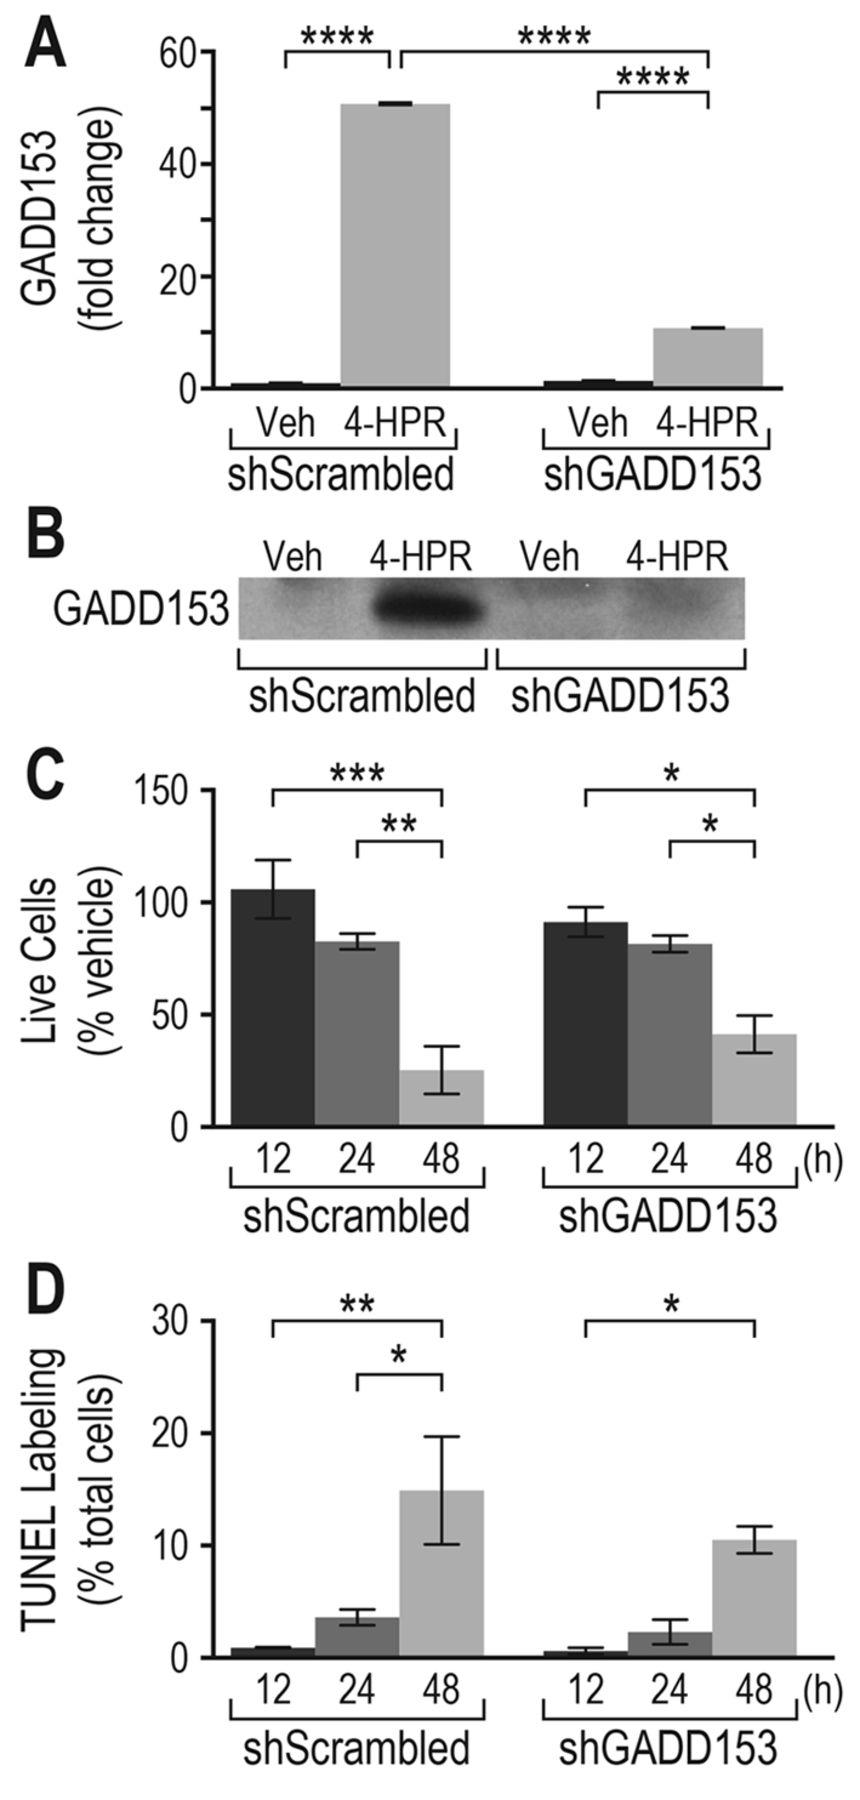
Knockdown of GADD153 does not abrogate 4-HPR-induced cell death or apoptosis in breast cancer cells. Previous work in our group showed that GADD153 is induced in MCF-7 breast cancer cells after exposure to 4-HPR or the analog, 4-HBR (2). In the present study, the most highly induced mRNA in the microarray encoded for GADD153. GADD153 is a transcription factor involved in programmed cell death in cells undergoing ER stress (18, 34). Herein, loss-of-function studies were performed by knocking down GADD153 in MCF-7 cells transduced with lentiviral particles expressing GADD153-targeting shRNA, followed by the evaluation of apoptosis and cell death after exposure to 4-HPR. GADD153 knockdown was verified via qPCR and immunoblot analysis (Figure 5A and 5B). The expected increase in GADD153 mRNA and protein was observed in control cells transduced with scrambled shRNA and exposed to 4-HPR, whereas in cells transduced with GADD153 shRNA, the effect of 4-HPR on GADD153 mRNA and protein was significantly reduced. Despite the inability of 4-HPR to induce GADD153 in knockdown cells, there was no significant increase in the survival of 4-HPR-treated knockdown cells (Figure 5C) nor was any reduction in apoptosis noted in knockdown versus control cells exposed to 4-HPR (Figure 5D). These results suggest that the increase in GADD153 is not required for drug-induced cell death.
When the effect of GADD153 knockdown on pro-apoptotic mRNAs was examined, the 4-HPR-induced increase in several genes downstream of GADD153 activation (GADD34, DR5, NOXA) (19, 35-37) was reduced but not eliminated. Knockdown of GADD153 had little or no effect on the 4-HPR-mediated induction of the upstream genes PERK and ATF3, whereas CHAC1, DDIT4 and HERPUD1 mRNAs were increased to an even greater extent in 4-HPR-treated GADD153 knockdown cells compared to drug treated shScrambled controls (Figure 6). Thus, 4-HPR induction of ER stress and apoptosis-related mRNAs remains intact or increased for a subset of mRNAs in GADD153 depleted cells which may explain why knockdown of GADD153 alone was ineffective in reducing apoptosis and cell death after exposure to 4-HPR.
4-HPR increases DR5 protein expression, and this increase requires GADD153. DR4 and DR5 are the receptors for the death-inducing ligand, TRAIL, and both mRNAs were up-regulated in the microarray samples from cells exposed to 4-HPR. Western blotting confirmed that DR5 protein was increased in MCF-7 cells exposed to 4-HPR, whereas DR4 protein was nearly undetectable regardless of treatment (Figure 7A and data not shown). There are two alternatively spliced isoforms of DR5 (38, 39). The smaller isoform was present in both the vehicle and 4-HPR treated cells, whereas the larger isoform was only present after drug treatment (Figure 7A). The ability of 4-HPR to increase DR5 protein was then studied in GADD53 knockdown cells. Treatment of MCF-7 cells transfected with scrambled shRNA showed the expected increase in DR5 protein after exposure to 4-HPR, whereas this increase was eliminated in the GADD153-shRNA transfected cells. Thus, the increase in DR5 mRNA (Figure 6) and protein (Figure 7B) by 4-HPR is dependent on GADD153.
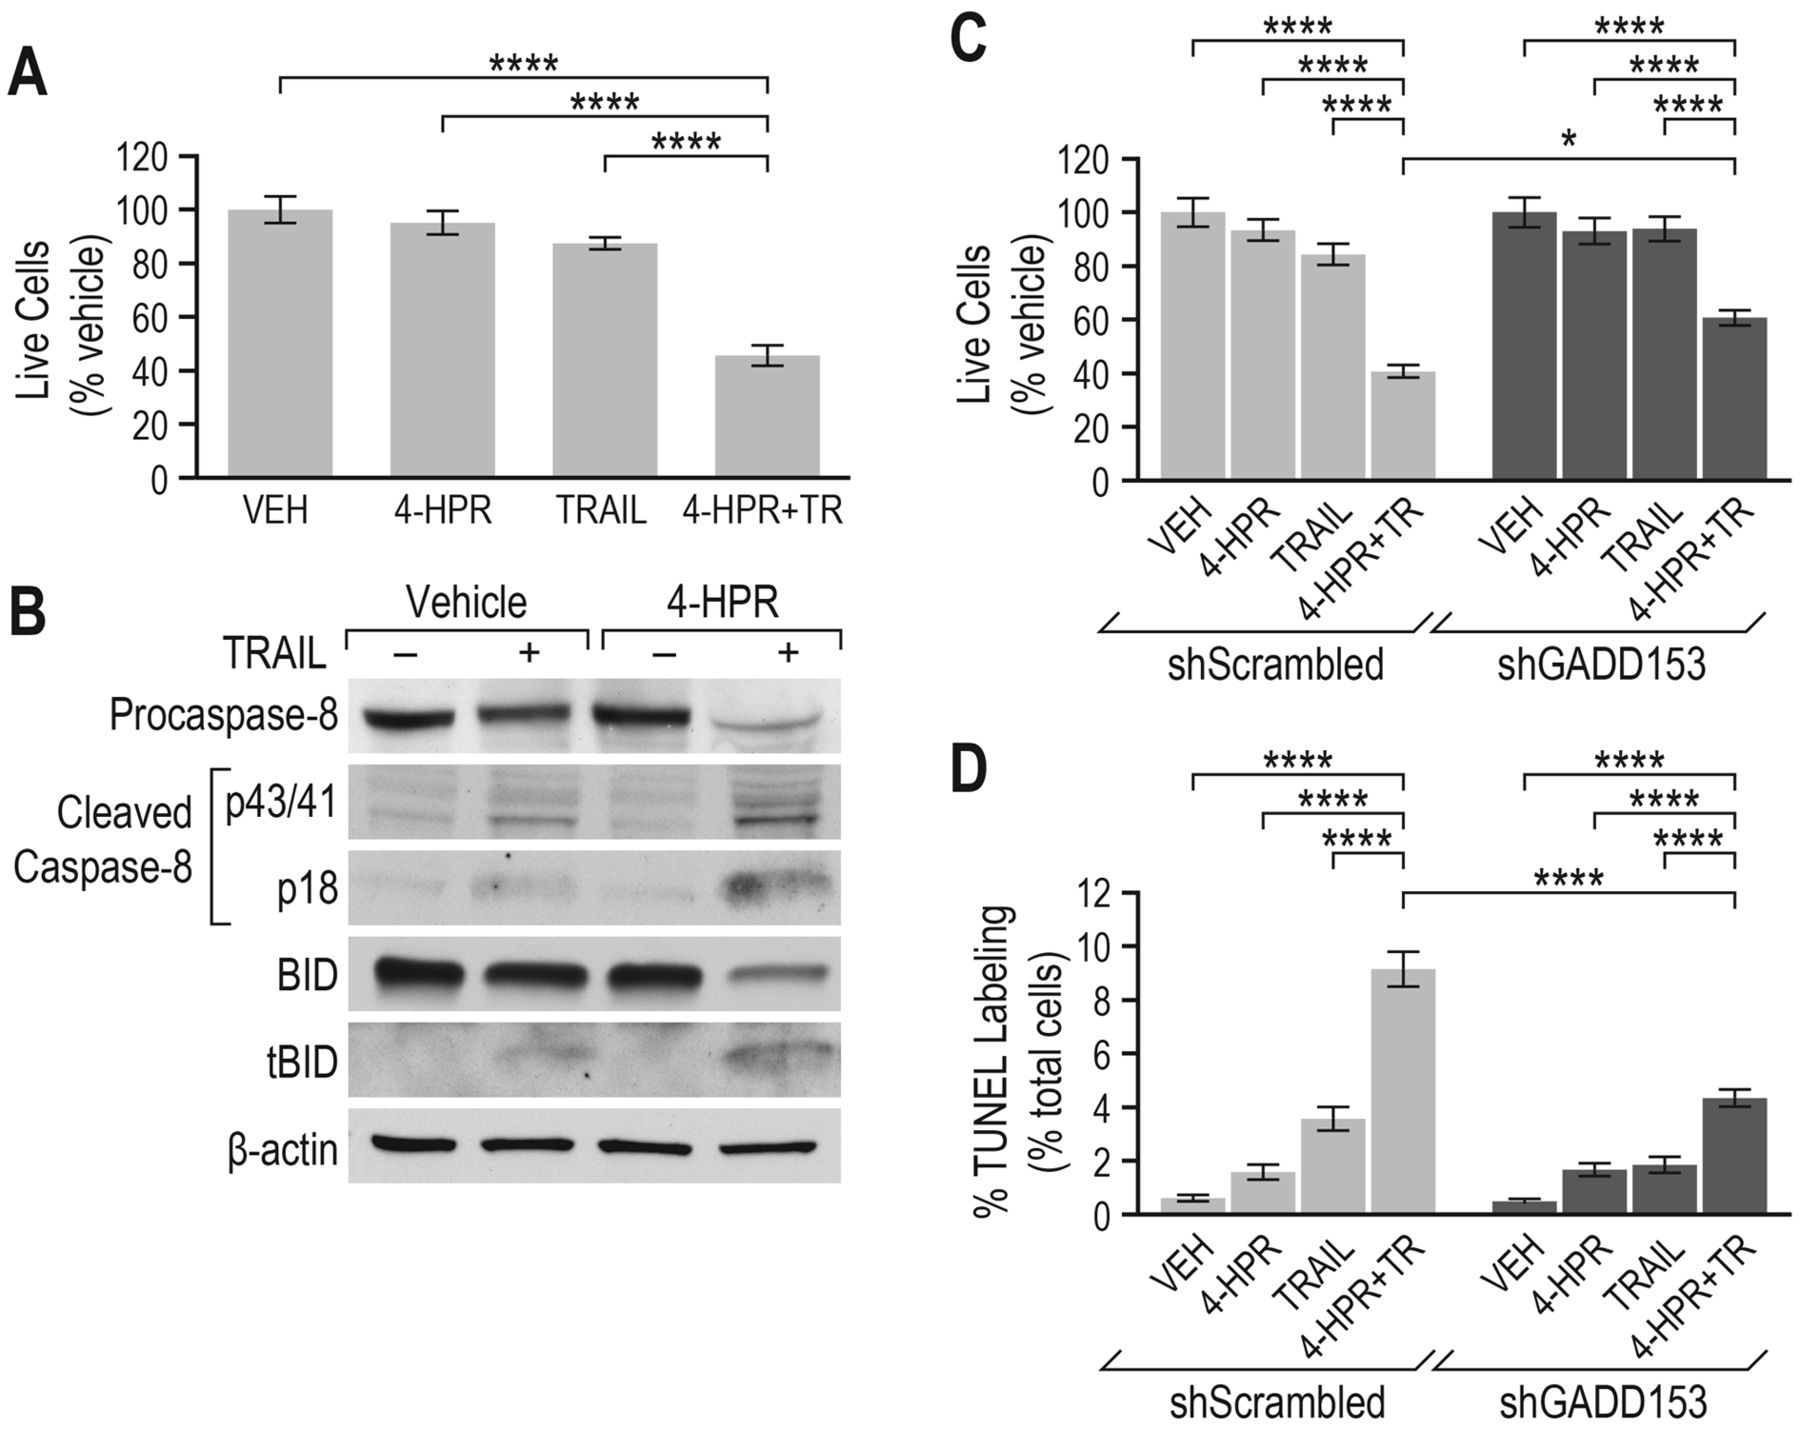
4-HPR synergizes with TRAIL to induce cell death in MCF-7 cells that are normally refractory to the effects of this DR ligand. Many cancer cell types, including MCF-7 cells, are resistant to the effects of TRAIL (40). One strategy to sensitize resistant cells to TRAIL is the induction of a cellular stress response (41). Since 4-HPR produces ER stress in breast cancer cells, we selected a dose of 4-HPR (10 μM) or TRAIL (250 ng/ml) which is ineffective in inducing apoptosis when given alone. MCF-7 cells were then treated with 4-HPR or TRAIL alone, or in combination. It was confirmed that the number of live cells after exposure to either TRAIL or 4-HPR alone was not significantly different from vehicle (Figure 8A). However, when cells were treated with TRAIL and 4-HPR together, live cell number was significantly reduced (Figure 8A), showing that 4-HPR and TRAIL act synergistically to increase cell death.
TRAIL signaling leads to cell death through both the extrinsic and intrinsic pathways (42). Caspase 8, a critical caspase in the TRAIL signaling pathway (43), was examined by western blotting. Treatment of MCF-7 cells with both 4-HPR and TRAIL produced the expected increase in caspase-8 cleavage compared to cells exposed to vehicle or either 4-HPR or TRAIL alone (Figure 8B). The active (cleaved) caspase-8 appeared as a p43/p41 cleavage fragment resulting from the full length 57 kDa caspase-8 proenzyme in cells treated with both drugs together. Activation of caspase 8 leads not only to further downstream caspase activation (extrinsic pathway), but also cleavage of BID to form tBID, a component of the intrinsic apoptosis pathway (44). When both 4-HPR and TRAIL were combined, the cleavage of BID to tBID was increased over that of vehicle or cells exposed to either drug alone, confirming activation of apoptosis in a manner and to an extent which neither drug could do alone (Figure 8B).

4-HPR and 4-HBR changed the expression of specific apoptosis-related genes. Bar charts present the results from quantitative PCR analysis of CASP8, DDIT4, DR4, DR5, DR6, NOXA, PLAB, and OPG mRNA from MCF-7, T-47D, and MDA-MB-231 cells treated with vehicle, 4-HPR, or 4-HBR (31.6 μM). Values are normalized to β-actin and expressed as fold-change from vehicle-treated control cells. The graphs are representative of 3-4 independent experiments experiments and t-test was performed for statistical analysis (*p≤0.05, **p≤0.01, ***p≤0.001, ****p≤0.0001). 4-HPR, N-(4-hydroxyphenyl)retinamide; 4-HBR, 4-hydroxybenzylretinone; CASP8, caspase 8; DDIT4, DNA damage-inducible transcript 4 protein; DR4, death receptor 4 or tumor necrosis receptor superfamily member 10A, TNFRSF10A; DR5, death receptor 5 or tumor necrosis factor receptor superfamily member 10B, TNFRSF10B; DR6, death receptor 6 or tumor necrosis receptor superfamily member 21, TNFRSF21; NOXA, phorbol-12-myristate-13-acetate induced protein 1; PLAB, placental bone morphogenetic protein; OPG, osteoprotegerin.
ER stress has been shown to sensitize various TRAIL resistant cancer cells by a variety of mechanisms, including GADD153-dependent induction of DR5 transcription (41, 45). Since induction of DR5 by 4-HPR requires GADD153, the effect of GADD153 knockdown on live cell number and apoptosis was examined in cells treated with a combination of 4-HPR and TRAIL. The number of live cells was increased and the percentage of cells undergoing apoptosis in response to the combination treatment was significantly reduced in MCF-7 cells transduced with shGADD153 compared to the shScrambled control (Figure 8C and D). This suggests that a 4-HPR-mediated increase in DR5 expression may underlie, at least in part, the ability of MCF-7 cells to respond to a dose of TRAIL which would otherwise be ineffective.
Discussion
4-HPR and its non-hydrolyzable analog, 4-HBR, induce apoptosis and cell death in breast cancer cells (2). Using microarray analysis and gene ontology term enrichment analysis we found that both ER stress-related and pro-apoptotic genes are enriched in MCF-7 cells exposed either to 4-HPR or 4-HBR. Similar changes in gene expression occurred in two additional invasive ductal carcinoma cell lines, T-47D and MDA-MB-231. Both drugs altered components of the intrinsic and extrinsic pathways of apoptosis, and both were effective in promoting apoptosis and cell death regardless of estrogen or progesterone sensitivity (MCF-7 and T47D: ER/PR positive; MDA-MB-231: ER/PR negative) or p53 status (MCF7: WT; T-47D and MDA-MB-23: mutated) (46-50).

Knockdown of GADD153 did not alter 4-HPR-induced cell death and apoptosis. The increase in GADD153 mRNA and protein levels by 4-HPR was nearly eliminated in MCF-7 cells transduced with GADD153 small hairpin (sh)RNA. A: Quantitative PCR of GADD153 mRNA in MCF-7 cells expressing either scrambled shRNA (shScrambled) or GADD153 shRNA (shGADD153) and dosed with vehicle or 4-HPR (31.6 μM) for 12 h. Values are normalized to β-actin and expressed as fold change compared to shScrambled vehicle-treated samples. GADD153 mRNA was significantly increased in shScrambled cells by exposure to 4-HPR, while the induction of GADD153 mRNA in cells stably expressing shGADD153 was significantly reduced compared to that of the control cells (shScrambled). B: Western blot analysis of GADD153 protein levels from breast cancer cells treated as described in (A) and harvested at 24 h. C: Effect of GADD153 knockdown on cell viability after exposure to 4-HPR. MCF-7 cells stably expressing scrambled shRNA (negative control) or GADD153 shRNA were treated for the indicated times with 4-HPR and the number of live cells was counted. Live cells were significantly reduced after exposure of cells to 4-HPR regardless of shRNA treatment. D: Effect of GADD153 knockdown on the percentage of cells undergoing apoptosis after exposure to 4-HPR. Cells were treated for the indicated times and apoptosis was assessed using the TUNEL assay. The percentage of TUNEL-labeled cells increased significantly with time in both the 4-HPR-treated shScrambled and shGADD153 groups. Multi-group analyses in panels A, C and D were performed using a two-way ANOVA with Tukey's post-hoc multiple comparisons test (*p≤0.05, **p≤0.01, ***p≤0.001, ****p≤0.0001). The data shown in panels C and D are representative of three independent experiments. 4-HPR, N-(4-hydroxyphenyl)retinamide; 4-HBR, 4-hydroxybenzylretinone; GADD153, growth arrest and DNA damage-inducible protein 153.

The effect of GADD153 knockdown on endoplasmic reticulum stress and apoptosis-related mRNAs. Bars charts present the expression levels of selected genes in MCF-7 cells tranduced with shScrambled or shGADD153 treated for 12 h with vehicle or 4-HPR (31.6 μM). Data are expressed as fold change over shScrambled vehicle-treated samples and mRNA levels are normalized to β-actin. Multi-group analyses were performed using a two-way ANOVA with Tukey's post-hoc multiple comparisons test (*p≤0.05, **p≤0.01, ****p≤0.0001). 4-HPR, N-(4-hydroxyphenyl)retinamide; GADD153, growth arrest and DNA damage-inducible protein 153.

4-HPR up-regulation of DR5 protein was eliminated by GADD153 knockdown. A: Immunoblot analysis showed that DR5 (TRAIL receptor protein) is increased in MCF-7 cells after exposure to 4-HPR compared to vehicle. DR5 densitometry results were normalized to β-actin and expressed as fold-change over control-vehicle (Veh). B: 4-HPR effect on DR5 protein in MCF-7 cells stably transfected with the shScrambled or shGADD153. DR5 protein in non-transfected cells with and without 4-HPR-treatment was used as control. 4-HPR, N-(4-hydroxyphenyl)retinamide; DR5, death receptor 5; GADD153, growth arrest and DNA damage-inducible protein 153.
Components of the PERK-dependent pathway were particularly affected by the exposure of breast cancer cells to 4-HPR or 4-HBR. PERK and ATF3 as well as downstream genes, including CHAC1, DDIT4, NOXA, GADD153, and GADD34, had increased mRNA levels. Increased expression of many of these genes has also been observed in other 4-HPR-treated cell lines (2, 11, 51, 52); however, CHAC1 has not been previously reported as a 4-HPR target. CHAC1 is transcriptionally regulated by ATF4 and ATF3 and is a pro-apoptotic component of the unfolded protein response (53, 54). Additional genes implicated in ER stress/apoptosis were increased in breast cancer cells after exposure to 4-HPR or 4-HBR, including HERPUD1 and the less well described pro-apoptotic factor PLAB. PLAB has previously been reported to be a mediator of 4-HPR-induced apoptosis in ovarian cancer cells (55).

4-HPR synergized with TRAIL to induce breast cancer cell death. A: MCF-7 cells were treated for 24 h with vehicle or 4-HPR with or without TRAIL (TR) for the last 16 h of treatment. Live cells in the group treated with 4-HPR+TR differed significantly from those treated with vehicle, or with 4-HPR (10 μM) or TR (250 ng/ml) alone (one-way ANOVA, ****p<0.0001). The percentage of live cells did not differ between the vehicle-treated and drug-treated (4-HPR or TRAIL alone) groups. The results are presented as mean±standard error from 4 independent experiments. B: MCF-7 cells were treated as in (A) and whole-cell lysates were analyzed for procaspase-8, cleaved caspase-8, BID, truncated BID (tBID), and β-actin by western blotting. C, D: MCF-7 cells stably expressing either a scrambled or GADD153 shRNA were treated as in (A) and the percentage of live cells (C) or TUNEL-labeled cells (D) was analyzed. Live cells treated with 4-HPR+TR differed significantly from those treated with vehicle or with 4-HPR or TR alone regardless of shRNA treatment (two-way ANOVA, ****p<0.0001). Live cells did not differ between the vehicle-treated and drug-treated (4-HPR or TRAIL alone) groups. When cells were treated with a 4-HPR+TR, the percentage of live cells was significantly increased in the shGADD153 knockdown group compared to the shScrambled controls (two-way ANOVA, *p<0.05). The percentage of TUNEL-positive cells in the group treated with 4-HPR+TR was significantly higher than those treated with vehicle or with 4-HPR or TR alone regardless of sh treatment (two-way ANOVA, ****p<0.0001). The percentage of cells that were positive for TUNEL staining was significantly reduced in GADD153-knockdown cells treated with 4-HPR +TRAIL compared to the shScrambled control cells (two-way ANOVA, ****p<0.0001). The results in panels C and D are presented as mean±standard error from 4 and 3 independent experiments, respectively.
GADD153 was the most highly induced gene in the microarray and its expression was increased at both the mRNA and protein level. Despite its dramatic induction by 4-HPR, knockdown of GADD153 did not reduce or eliminate drug-induced apoptosis or cell death. Although GADD153 knockdown partially inhibited the increase in several ER stress/apoptosis-related genes after exposure to 4-HPR, PERK and ATF3 mRNAs were largely unchanged, and CHAC1, DDIT4 and HERPUD1 mRNAs were actually increased in the 4-HPR-treated knockdown cells. Antisense GADD153 has been reported to decrease 4-HPR-induced apoptosis in neuroblastoma cells (56); however, other groups have reported that knockdown of GADD153 does not alter 4-HPR-induced apoptosis in colon and A375 melanoma cells (11, 57). The work presented herein showed that GADD153 is dispensable for cell death and apoptosis in MCF-7 breast cancer cells in response to 4-HPR alone.
An important finding of the present study is that combined treatment with 4-HPR and TRAIL at doses that were ineffective alone induced apoptosis and cell death in TRAIL-resistant MCF-7 cells. 4-HPR has been reported to sensitize ovarian and colon cancer cells to the effects of TRAIL (57, 58). A small additive effect of 4-HPR and TRAIL was noted in MDA-MB-231 cells, however, these cells are already highly responsive to TRAIL even in the absence of 4-HPR (59). In the present study, the development of TRAIL sensitivity in previously insensitive MCF-7 cells may result, in part, from the effect of 4-HPR on components of the extrinsic apoptosis pathway, including increase in DR5 and caspase-8 mRNA levels, and a decrease in the level of the soluble decoy receptor, osteoprotegerin (OPG). When 4-HPR and TRAIL are used together, only then is caspase 8 activated and the downstream intrinsic pathway engaged. The death receptor, DR5, is a downstream target of GADD153 (36), and the finding that GADD53 knockdown reduces 4-HPR/TRAIL synergy suggests a role for DR5 induction in this response. Thus, results from the present study provide a rationale for further study of 4-HPR and analogs as a means to sensitize resistant tumors to the effects of TRAIL in breast cancer therapy.
Acknowledgements
The Authors thank L. Vanderploeg in the Department of Biochemistry Media Lab for the artwork. They also thank the University of Wisconsin-Madison CALS Statistical Consulting Group for their statistical analysis support distinct from the microarray statistical analysis. This work was supported by a grant from the NIH-National Cancer Institute (CA49837). A.L.A was supported in part by a graduate fellowship from the Department of Biochemistry at the University of Wisconsin-Madison. M.A.N.'s effort was supported by the Biostatistics Shared Resource of the University of Wisconsin Carbone Cancer Center (CA014520).
Footnotes
↵* Current address: Zafgen, Inc., 175 Portland Street, 4th Floor, Boston, MA, U.S.A.
↵** Current address: Department of Neurobiology, University of Pittsburgh, Pittsburgh, PA, U.S.A.
This article is freely accessible online.
Conflicts of Interest
The Authors declare they have no conflict of interest. This article does not contain any studies with human subjects or animals.
- Received May 17, 2018.
- Revision received July 11, 2018.
- Accepted July 12, 2018.
- Copyright© 2018, International Institute of Anticancer Research (Dr. George J. Delinasios), All rights reserved
References
In this issue


Jump to section
Related Articles
Cited By...
- No citing articles found.