


Abstract
Background/Aim: Tissue factor (TF) expression increases cancer stem cell (CSC) activity in breast and lung cancer. There are ongoing studies focused on targeting CSCs via anti-TF treatment, for breast and lung cancer therapy. Herein, the aim was to determine whether targeting TF could have an anti-CSC therapeutic role in colorectal cancer (CRC). Materials and Methods: Evaluation of colonosphere-forming efficiency (CFE) and aldehyde dehydrogenase (ALDH) expression level was used to quantify CSC activity in two CRC cell lines, after TF knockdown (TFKD) or TF over-expression (TFOE). Results: TFKD resulted in increased levels of ALDH in SW620 (1.31±0.04-fold, p<0.001) and DLD-1 (1.63±0.14-fold, p=0.04) cells. CFE was increased in SW620 (1.21±0.23% vs. 2.03±0.29%, p=0.01) and DLD-1 (0.41±0.12% vs. 0.68±0.9%, p=0.01) cells. Conversely, TFOE decreased ALDH expression (0.72±0.04-fold, p=0.001) and CFE (0.33±0.05% vs. 0.66±0.14%, p=0.006) in DLD-1, but had no impact on SW620 cells. Conclusion: In the examined CRC cell lines, TF expression was inversely related to CSC activity suggesting that anti-TF therapies may not have a role in CRC treatment.
Colorectal cancer (CRC) is the third most common cancer in the United Kingdom (UK), after cancer of the breast and prostate, with 40,755 new diagnoses in 2012 (1). It causes 10% of all cancer deaths, second only to lung cancer in the UK (2). Worldwide, 1.36 million new CRC cases are diagnosed annually, and almost 700,000 deaths are estimated annually (1).
Expression of tissue factor (TF), the initiator of the extrinsic clotting pathway, is associated with a poor cancer prognosis in many solid tumours (3, 4). In CRC, expression of TF is associated with higher disease stage (5), hepatic metastases (6) and reduced survival (7). TF has been reported to enhance the metastatic ability of pancreatic cancer cells in murine models (8). This effect may be related to the increased tumorigenicity and the resistance to anoikis that have been observed in TF-expressing cells (9-11). TF also increases primary tumour growth and proliferation (12-15).
Cancer stem cells (CSCs) are a small cellular subpopulation within a tumour, which possess the capacity to self-renew and generate the differentiated cancer cell lineages that comprise the tumour (16). CSCs have a crucial role in the development of metastases and treatment resistance (17, 18); therefore, they are potential therapeutic targets. In CRC, cells with CSC features have increased tumorigenicity when injected into mice models (19). Moreover, in xenogeneic mouse models of CRC, animals treated with chemotherapy and radiotherapy develop residual tumours enriched with CSCs (20, 21). These tumours have increased expression of stem cell markers and possess the ability to regenerate primary tumours (20-21). In vitro, CSC activity can be determined by using stem cell markers or the colonosphere assay. In CRC, aldehyde dehydrogenase (ALDH) is a well-established marker of CSCs (22, 21). On the other hand, in the colonosphere assay, CSCs are identified by their ability to resist anoikis and form clonal-derived spheres when cultured in suspension (23, 24).
The association of clinical effects of tumour TF expression and CSC activity has led to the hypothesis that TF may increase CSC activity. In squamous cell carcinoma (SCC) cells, TF expression correlates with the presence of the CSC marker CD133 and the ability of cells to form cancer spheres in vitro (25). Furthermore, treatment of SCC cells with CNTO 859, a TF-neutralising antibody, impairs their ability to form tumours when injected into mouse tails suggesting a negation of CSC activity (25). In breast cancer, high TF-expressing cells have increased tumour sphere-forming ability and higher expression of stem cell markers (26). The use of TF-targeting agents has been shown promising in breast, lung, and ovarian cancer therapy (27). In CRC, the link between TF and CSC activity has not been determined yet. The aim of this study was to determine the effect of TF on CSC activity in CRC.
Materials and methods
Cell lines and culture. Human CRC cell lines DLD-1 and SW620 [American Type Culture Collection (ATCC), Rockville, MD, USA] were used for all assays. 293T cell line (ATCC) was used for the production of lentiviral particles. DLD-1 cells were maintained in McCoy's 5A (modified) medium supplemented with 10% heat-inactivated foetal bovine serum (FBS) (Thermo Fisher Scientific, Waltham, MA, USA), 100 U/ml penicillin sodium and 100 mg/ml streptomycin sulphate. SW620 and 293T cells were maintained in Dulbecco's modified Eagle's medium (DMEM) supplemented with 10% heat-inactivated FBS (Thermo Fisher Scientific), 100 U/ml penicillin sodium, 100 mg/ml streptomycin sulphate, and 2 mM/l GlutaMAX (Thermo Fisher Scientific). All cell lines were maintained in an atmosphere of 5% CO2 at 37°C.
Lentiviral particle preparation. For knockdown transfection, lentiviral particles harbouring small hairpin RNA (shRNA) encoding human TF DNA or control shRNA were acquired from Santa Cruz Biotechnology (Santa Cruz, CA, USA). For TF overexpression (TFOE), lentiviral particles were prepared using the Lenti-Pac™ HIV Expression Packaging Kit (GeneCopoeia, Rockville, MD, USA) and the TF open reading frame (ORF) clone EX-Q0306-Lv105-10 (GeneCopoeia). An empty vector control, EX-NEG-LV105 (GeneCopoeia) was used as negative control (NC). 293T cells were seeded in 10-cm culture dishes at a density of 1.5×10⁶. After 48 h, 2.5 μg of the lentiviral ORF expression plasmid and 5 μl of Lenti-Pac HIV mix (GeneCopoeia) were diluted in 200 μl of Opti-MEM (Thermo Fisher Scientific). Afterwards, 15 μl of EndoFectin Lenti (GeneCopoeia) pre-diluted in 200 μl of Opti-MEM were added to the plasmid mix. Following incubation at room temperature for 20 min, the final solution was added to the culture dishes containing 293T cells. After 10 h, medium was replaced with fresh supplemented with 1:500 TitreBoost (GeneCopoeia). After a 48-h incubation, medium containing lentiviral particles was centrifuged at 500 × g for 10 min, and supernatant was harvested following filtration through 0.45 μm polyethersulfone low protein binding filters. Lentiviral particles were stored at -80°C until required.
Cell transfection. DLD-1 and SW620 cells were seeded in a 12-well plate at a density of 2.5×10⁴ cells per well. After 24 h, the culture media was removed and replaced with 1 ml of DMEM supplemented with 5% heat-inactivated FBS, 2 mM/l GlutaMAX and polybrene (Santa Cruz Biotechnology, CA, USA) at a final concentration of 8 μg/ml. A volume of 20 μl or 1 ml of lentiviral particles for TFKD or TFOE, respectively, and the corresponding negative controls were added for 8 h. Medium was then replaced with fresh DMEM supplemented with 10% heat-inactivated FBS and GlutaMAX. After 48 h, transfected cells were selected using 2 μg/ml puromycin dihydrochloride (Thermo Fisher Scientific).
Flow cytometry. DLD-1 and SW620 cells were suspended in 100μl of phosphate buffered saline (PBS) (3.0×10⁵ cells/100 μl) and incubated with a mouse monoclonal antibody against human TF (dilution 1:25; Sekisui Diagnostics, Lexington, MA, USA) for 20 min, at room temperature in the dark. The suspension was centrifuged at 800 × g for 2 min before being washed twice with PBS and resuspended in 200 μl of PBS. Goat anti-mouse IgG cross-adsorbed secondary antibody APC conjugate (Thermo Fisher Scientific) was added at a dilution of 1:100 and the mixture was incubated at room temperature for 20 min in the dark. Unstained cells were used as negative control samples. After centrifugation at 800 × g for 2 min and two washes with PBS, pellet was resuspended in 400 μl of PBS and 5 μl of 7-aminoactinomycin D (7AAD, Thermo Fisher Scientific) was added as a cell viability marker. Staining with 7AAD was used for the exclusion of dead cells from the analysis, and it also allowed the comparison of cellular viability between different expressions of TF as a validation assay. Flow cytometry was carried out using a BD FACSCalibur with CellQuest Pro v6.0 software (BD Biosciences, Franklin Lakes, NJ, USA). Data were analysed using FlowJo v10.0 (FlowJo, LLC, Ashland, OR, USA).
ALDH activity assay. The ALDEFLUOR™ Kit (Stemcell Technologies, Vancouver, Canada) was used according to manufacturer's instructions, for the detection of cells with high ALDH activity. Briefly, 1.0×10⁶ cells diluted in 1 ml of assay buffer were placed in the “sample test” tube and 5 μl of ALDEFLUOR reagent were added. Immediately, 500 μl of the mixture were transferred to the “sample control” tube containing diethylaminobenzaldehyde, to inhibit ALDH enzyme. Both samples were incubated at 37°C for 30 min. Following centrifugation at 800 × g for 2 min, the cell pellets were resuspended in 500 μl of assay buffer and 5 μl of 7AAD were added as a cell viability marker. Samples were directly analyzed by flow cytometry.
Colonosphere assay. Non-adherent cell culture plates (Corning, New York, USA) were coated with 1.2% (w/v) poly-2-hydroxyehyl methacrylate (polyHEMA, Sigma, Dorset, UK) dissolved in 95% ethanol, and were dried at 60°C. Cells were cultured in colonosphere media (DMEM/F12, Thermo Fisher Scientific) supplemented with B12 supplement (Thermo Fisher Scientific), and 20 mg/ml recombinant EGF (Abbexa, Cambridge UK). A single-cell suspension of DLD-1 and SW620 cells was prepared in PBS by enzymatic and mechanical separation, using 0.25% trypsin-EDTA solution and 10 passes with a 25-gauge needle respectively. The cells were seeded (3.0×10² cells/cm2) in a 6-well non-adherent plate, and were incubated in an atmosphere of 5% CO2 at 37°C. After 5 days, the number of colonospheres >50 μm were counted using a microscope fitted with a graticule at a 4× magnification. Colonosphere forming efficiency (CFE, %) was calculated as follows: (number of colonospheres per well/number of cells seeded per well) ×100. Three wells were used for each variable in each experiment and the experiments were replicated in triplicate.
Proliferation assay. To ensure that any effect on CFE was not secondary to an increase in cellular proliferation, a proliferation assay was performed. DLD-1 and SW620 cells were plated (1×10⁴ cells/180μl/well in the appropriate media), in a 96-well plate (black with clear, flat bottom). A volume of 180 μl of phosphate buffered saline (PBS) was added to surrounding empty wells. The cells were adhered after a 6-h incubation at 37°C, 5% CO2 and 20 μl of PrestoBlue™ (Thermo Fisher Scientific) was added for a further one-hour incubation. The bottom read fluorescence (excitation 544 nm, emission 610 nm) was measured using a FLUOstar Omega microplate reader (BMG Labtech, Aylesbury, UK). This process was repeated at 24, 48, 72 h for DLD-1 cells and 24, 48, 72 and 96 h for SW620 cells. Six wells were used per each experimental condition and each experiment was repeated in triplicate.
Statistical analysis. The student's t-test or Mann–Whitney U-test was used for statistical analysis depending on the data distribution. All p-values <0.05 were considered significant. All results are quoted as the mean±standard error of the mean (SEM) and are the result of three independent experiments.
Results
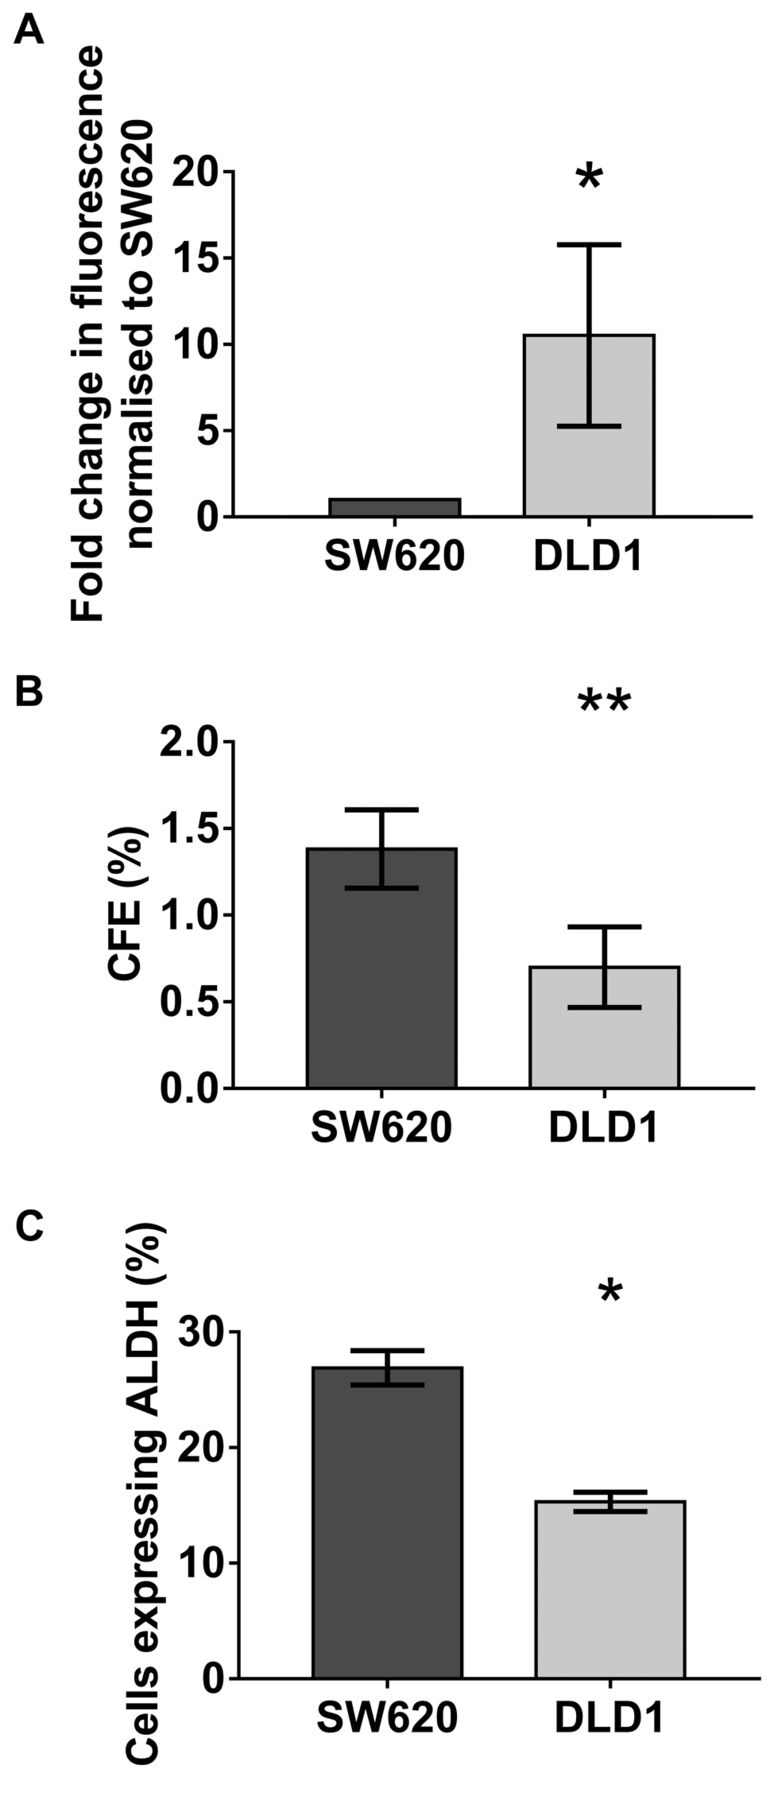
Cell lines with intrinsically high TF expression were associated with decreased cancer stem cell activity. DLD-1 wild type (WT) cells were confirmed to intrinsically express higher levels of TF compared to SW620 WT cells (p<0.05) (Figure 1A). CSC activity was compared between both cell lines. The intrinsically high TF expressing cell line, DLD-1, had a lower CFE (p<0.01) (Figure 1B) and ALDH activity (p=0.02) (Figure 1C) than the intrinsically low TF expressing SW620 cell line. This infers possible reduced CSC activity with high TF expression. However, this difference in CSC activity may simply be a bystander effect due to other differences between the cell lines.
Knockdown of TF was associated with increased cancer stem cell activity. SW620 and DLD-1 cells were stably transfected with TF shRNA to reduce the expression of TF (Figure 2A and 2B). CSC activity of TFKD SW620 and DLD-1 cells was compared to their corresponding negative control cells, transfected with an empty vector. Consistent with findings in the WT cells, SW620 and DLD-1 TFKD cells were associated with increased CFE (SW620 p=0.01, DLD-1 p=0.01) (Figure 2C and D) and ALDH activity (SW620 p<0.01, DLD-1 p=0.04) (Figure 2E and F) compared to the controls. Thus, suggesting that reduced TF expression is associated with increased CSC activity.
Overexpression of TF was associated with decreased cancer stem cell activity. SW620 and DLD-1 cells were stably transfected to overexpress TF (Figure 3A and B). Subsequently, their CSC activity was compared to negative control. In line with the finding that TFKD increased CSC activity, TFOE was associated with decreased CFE (p=0.006) (Figure 3D) and ALDH activity (p=0.001) (Figure 3F) in DLD-1 cells compared to their negative control. However, no difference was observed either in CFE (p=0.4) (Figure 3C) or in ALDH activity (p=0.4) (Figure 3E) between TFOE SW620 cells and their negative control.
Expression of TF did not affect cellular viability. Comparison of CFE and ALDH activity in the WT and the transfected cells suggested that TF inhibits CSC activity. CSC activity assays, particularly the colonosphere assay, may be influenced by any detrimental impact on cellular viability which may be brought upon by the knockdown or overexpression of TF in SW620 and DLD-1 cells (28). Therefore, a viability assay was performed to quantify any differences. Results demonstrated that neither TFKD nor TFOE affected cellular viability in either SW620 or DLD-1 cells (Transfected Cell line compared to their negative control SW620: TFKD p=0.7, DLD-1 TFKD p=0.8, SW620 TFOE p=0.5, and DLD-1 TFOE p=0.8) (Figure 4).

Cancer stem cell activity in wild-type cells. A: Tissue factor expression was assessed in wild type (WT) SW620 and DLD-1 cells using flow cytometry. DLD-1 cells had almost an 11-fold increase in TF expression compared to SW620 cells (10.5±5.23, p<0.05). Data are presented as mean fold change in fluorescence normalised to SW620 cell line±SEM. B: DLD-1 and SW620 cells were seeded in non-adherent conditions. After 5 days the number of colonospheres formed were counted and the colonosphere forming efficiency (CFE) was calculated [CFE%=(number of colonospheres per well/number of cells seeded per well) ×100]. CFE was decreased in DLD-1 cells compared to SW620 cells (0.70±0.13% vs. 1.38±0.23%, p<0.01). Data are presented as mean CFE±SEM. C: Aldehyde dehydrogenase (ALDH) expression was quantified in both cell lines by flow cytometry using the ALDEFLUOR assay kit. ALDH activity was lower in DLD-1 cells compared to SW620 cells (15.3±0.9% vs. 26.9±1.4%, p=0.02). Data are presented as mean percentage of cells expressing ALDH±SEM. Statistical analysis using the unpaired t-test, *p<0.05, **p<0.01.

Tissue factor knockdown increased stem cell activity. A, B: Tissue factor expression was quantified in the SW620 and DLD-1 cell lines following lentiviral knockdown, using flow cytometry. Successful tissue factor knockdown (TFKD) was confirmed in both cell lines. Data are presented as mean fold change in fluorescence normalised to negative control±SEM. C, D: SW620 and DLD-1 TFKD cells were seeded in non-adherent conditions along with their corresponding negative controls. After 5 days, the number of colonospheres were counted and the colonosphere forming efficiency (CFE) was calculated (CFE%=[number of colonospheres per well/number of cells seeded per well] ×100). TFKD was associated with an increase in CFE in both SW620 (2.03±0.29% vs. 1.21±0.23%, p=0.01) and DLD-1 (0.68±0.9% vs. 0.41±0.12%, p=0.01) cells compared to their negative controls. Data presented as mean CFE±SEM. E, F: ALDH expression was quantified in SW620 and DLD-1 TFKD cells and compared with their respective negative controls by flow cytometry using the ALDEFLUOR assay kit. TFKD was associated with an increase in ALDH activity in SW620 (1.31±0.04-fold change, p<0.001) and DLD-1 (1.63±0.14-fold change, p=0.04) cells compared to their negative controls. Data presented as mean fold change in ALDH activity normalised to negative control±SEM. Statistical analysis using the unpaired t-test; *p<0.05; **p<0.01.
TF overexpression may increase proliferation. To ensure that the colonosphere assay was not affected by any change in proliferation resulting from TF expression, the effect of TF on cellular proliferation was determined. Minor differences in proliferation were observed in SW620 TFKD (decreased proliferation at 24h p=0.02, this difference disappeared by 48 h p=0.4) and DLD-1 TFOE increased proliferation at 24 h p=0.01, this difference disappeared by 48 h p=0.5) compared to their negative controls (Figures 5A and D). No differences in proliferation were observed in the DLD-1 TFKD cells compared to their negative controls at any time point (p>0.4) (Figure 5B). However, SW620 TFOE cells demonstrated increased proliferation at 72 h (p<0.0001), which persisted up to 96 h (p=0.01) (Figure 5C). This increased proliferation might explain why there was no reduction in CFE in these cells compared to their negative controls. Since SW620 TFOE cells proliferate more rapidly, any negative effect of TF expression may be masked by the increasing proliferation. The finding that TF increases proliferation in the SW620 is consistent with previous research (29).

Tissue factor overexpression (TFOE) decreased stem cell activity. A, B: TF expression was quantified in the SW620 and DLD-1 cell lines following lentiviral over-expression, using flow cytometry. Successful (TFOE) was confirmed in both cell lines compared to their negative controls. Data are presented as mean fold change in fluorescence normalised to negative control±SEM. C, D: SW620 and DLD-1 TFOE cells were seeded in non-adherent conditions along with their corresponding negative controls. After 5 days the number of colonospheres formed were counted and the colonosphere forming efficiency (CFE) was calculated (CFE%=[number of colonospheres per well/number of cells seeded per well] ×100). TFOE was associated with a decrease in CFE in DLD-1 (0.33±0.05% vs. 0.66±0.14%, p=0.006) but not the SW620 (1.21±0.23% vs. 1.29 ±0.17, p=0.4) cells compared to their negative controls. Data are presented as mean CFE±SEM. E, F: ALDH expression was quantified in SW620 and DLD-1 TFOE cells and compared with their respective negative controls by flow cytometry using the ALDEFLUOR assay kit. TFOE was associated with a significant decrease in ALDH activity in DLD-1 (0.72±0.04-fold change, p=0.001) but not SW620 (0.81±1.00-fold change, p=0.4) cells compared to their negative controls. Data are presented as mean fold change in ALDH activity normalised to negative control±SEM. Statistical analysis using the unpaired t-test; **p<0.01; ***p<0.0001.
Discussion
In this study, the CSC activity of CRC cells was investigated in vitro by using the colonosphere assay and the evaluation of ALDH activity, which is a biomarker of cancer precursor cells. Results demonstrated that the expression level of TF was inversely correlated with CSC activity. High TF-expressing cell line, DLD-1, had reduced CSC activity in comparison to the low TF-expressing cell line, SW620. This could simply be a bystander effect due to other differences between these cell lines. However, consistent with this finding, when the cell lines were transfected to knockdown TF, CSC activity was increased in both DLD-1 and SW620 cells. A consistent inverse relationship between TF expression and CSC activity was also seen following over expression of TF in the DLD-1 cell line. In the SW620 cell line there was no change in the CSC activity when TF expression was increased. This may be the result of increased proliferation, since, as demonstrated by the PrestoBlue proliferation assay, TFOE SW620 cells showed a significant increase in proliferation at 96 h. Cell viability was not affected by either the knockdown or overexpression of TF in either cell line.
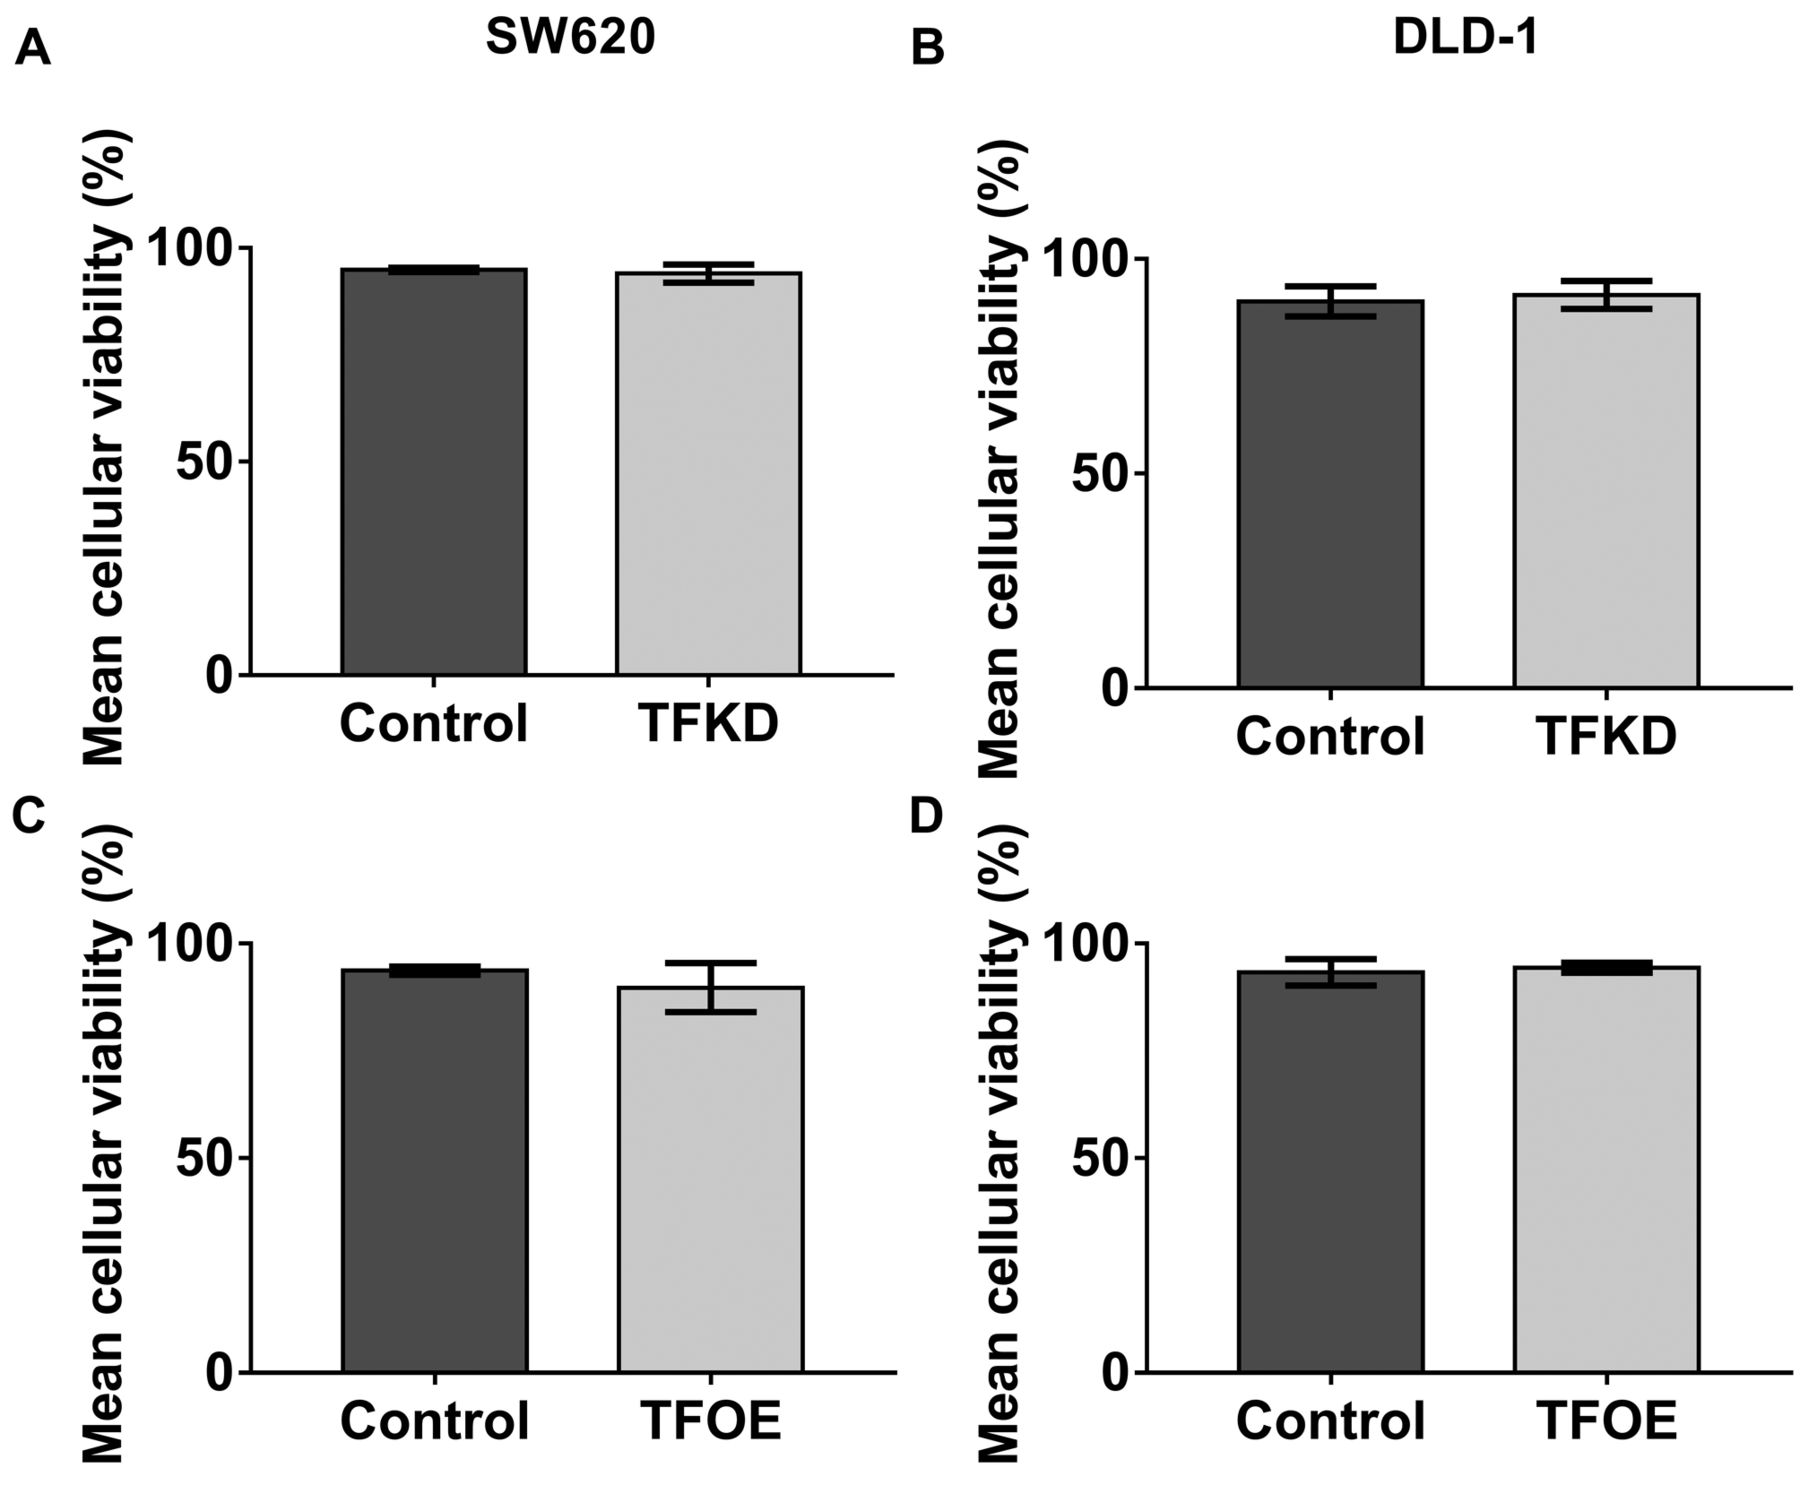
The effect of tissue factor knockdown (TFKD) and TF overexpression (TFOE) on cellular viability. Staining with 7AAD was used as a live/dead discriminatory to ensure that the level of TF expression did not affect cellular viability. No effect was observed on cellular viability between A: SW620 TFKD (94.0±2.6% vs. 94.9±0.5%, p=0.7), B: DLD-1 TFKD (91.6±3.2% vs. 90.1±3.5%, p=0.8), C: SW620 TFOE (89.7±5.7% vs. 93.7±0.9%, p=0.5) or D: DLD-1 TFOE (94.4±1.2% vs. 93.3±0.1%, p=0.8) cells and their respective negative controls. Data presented as mean cellular viability (%)±SEM. Statistical analysis was performed using unpaired t-test.
TF-targeted treatments have recently been proposed as a potential therapeutic approach against cancer (27). Therefore, the finding that TF expression is inversely related to CSC activity in CRC is important. Conversely to these results regarding CRC, studies on other tumour types, including SCC, breast, ovarian and lung cancers, have shown that TF increases CSC activity (27, 25, 26). Although our work is limited to in vitro experiments, it has demonstrated a consistent effect of TF expression across cell lines with the exception of SW620 TFOE cells. In the non-cancer stem cell population (haematological cell line) the expression of TF increases with differentiation away from the pluripotent stem cells(30). The difference between the effect of TF on CRC CSC and the SCC, breast and lung cancers may reflect the complexity of CRC stem cell control. The control of CSC activity in CRC cancer is multifactorial with complex interactions between many pathways. Signalling pathways that have been demonstrated to have a role in the control of CRC CSC activity include the Wnt, Notch, bone morphogenetic protein (BMP)/TGF-β, Hedgehog-Gli (HH-GLI), epidermal growth factor receptor (EGFR)/mitogen-activated protein kinase (MAPK), NF-κB and Akt/mTOR pathways (31). Some of these same pathways are influenced by TF expression, including Wnt (32) and AKT (33), whereas others, including MAPK and ERK, are implicated in the regulation of TF expression (34, 35). The unexpected effect of TF on CRC CSC activity in this study may be the result of interactions between these pathways. The determination of this interaction is beyond the scope of this study and further pathway analysis of the role of TF in CRC CSC is needed. The finding that TF inhibited CSC activity in CRC suggests that, unlike in breast and lung cancer treatments, targeting TF may be unsuccessful as an anticancer treatment. It may be that in CRC inhibition of TF could worsen cancer prognosis by increasing the activity of the treatment resistant tumour subgroup of CSCs.

The effect of tissue factor (TF) expression on SW620 and DLD-1 cell proliferation was assessed using the PrestoBlue proliferation assay. A: SW620 TF knockdown (TFKD) cells were associated with decreased proliferation at 24 h compared to their negative controls (1.78±0.18-fold change vs. 2.64±0.29-fold change, p=0.02). This difference disappeared by 48 h. B: DLD-1 TFKD cells were not associated with any difference in proliferation at any time point. C: SW620 TFOE cells were associated with increased proliferation at 72 h compared to their negative controls (5.82±0.43-fold change vs. 3.17±0.27-fold change, p<0.0001). This difference in proliferation persisted at 96 h (7.53±0.88-fold change vs. 4.97±0.29-fold change, p=0.01). D: DLD-1 TFOE cells were associated with increased proliferation at 24 h compared to their negative controls (2.14±0.13-fold change vs. 1.63±0.14-fold change, p=0.01). This difference in proliferation disappeared by 48 h. Data presented as mean fold change in fluorescence±SEM normalised to time point 0 h. Solid line=negative control, broken line=transfected cell line. Statistical analysis was performed using the unpaired t-test or Mann–Whitney U- test, depending on the distribution of the data. *p<0.05; ***p<0.0001.
Conclusion
This study is the first reporting the effect TF has on CRC CSCs. This study has demonstrated that TF inhibits the activity of CRC CSCs. The results suggest that unlike in other solid cancers, including breast and lung, anti-cancer treatments targeting TF may not have a therapeutic role.
Acknowledgements
This work was supported by a NIHR Clinical Scientist Award (CC Kirwan) and Royal College of Surgeons Fellowship (PA Rees).
Footnotes
This article is freely accessible online.
- Received February 20, 2018.
- Revision received March 26, 2018.
- Accepted March 30, 2018.
- Copyright© 2018, International Institute of Anticancer Research (Dr. George J. Delinasios), All rights reserved
References
In this issue


Jump to section
Related Articles
Cited By...
- No citing articles found.