


Abstract
Background: Non-small cell lung carcinomas (NSCLCs), mainly adenocarcinoma (AC) and squamous cell carcinoma (LSCC), account for about 80% of all lung cancer cases. One of the proteins involved in NSCLC progression may be special AT-rich binding protein 1 (SATB1), a potent transcriptional regulator, able to control the expression of whole sets of genes simultaneously. SATB1 has been found to be associated with aggressive phenotype and poor prognosis in numerous malignancies, including breast, colon, ovary and prostate cancer. However, its role in NSCLC is still not fully understood. The aim of this study was to investigate the expression of SATB1 protein and mRNA in NSCLC and non-malignant lung tissue (NMLT) samples, as well as to determine possible relationships of SATB1 expression with both the expression of Ki-67 and the clinicopathological data of the patients. Materials and Methods: The study was performed on 277 NSCLC (158 AC, 119 LSCC) and 20 NMLT samples. Results: We observed increased SATB1 immunoreactivity in NSCLC when compared to NMLT, and in LSCC when compared to AC cases. We also noted that an elevated SATB1 immunoreactivity was associated with a poor degree of AC differentiation, whereas in LSCC, an inverse relationship was observed. Our analyses revealed that the expression of SATB1 positively correlated with Ki-67 index in NSCLC and LSCC, but not in AC cases. Finally, we found that high SATB1 expression was associated with a better overall survival of patients with NSCLC. Conclusion: SATB1 plays diverse roles in different NSCLC subtypes, and its expression may have a prognostic significance for patients with these tumours.
With 1.8 million new cases and 1.6 million deaths noted worldwide in 2012 alone, lung cancer is the most frequent neoplasm in men, the third most frequent in women (after breast and colon cancer), and the main reason for cancer-related deaths in both sexes (1, 2). Its prognosis depends mainly on the stage at which the cancer is diagnosed, but average 5-year survival rates in the U.S. do not exceed 18% (2). It is estimated that 80-90% of lung cancer cases in highly-developed countries are associated with tobacco smoking, both active and passive (1, 3). Other risk factors are exposure to air pollution, dust, asbestos, radon and arenes, as well as chronic lung diseases and congenital gene mutations (1, 4). For a long time, lung cancer has been more common in men than in women, but its incidence in women began increasing in the 1970s as a result of promoting smoking as a symbol of empowerment (3-5). Nowadays, the percentage of smokers in the male and female populations is similar (16.7% and 13.6% respectively; data from the US), and both groups have a comparable probability of developing lung cancer (7.2% and 6.0% respectively; data from the US) (2, 6).
For clinical and reporting purposes, cases of lung cancer are usually divided into two main groups, based on their histological and biological features: small-cell lung carcinoma (SCLC; 20% of cases) and non-small cell lung carcinoma (NSCLC; 80% of cases) (4, 5, 7). Among NSCLCs, three histological subtypes can be further distinguished: adenocarcinoma (AC), squamous cell carcinoma (LSCC) and large cell carcinoma (LCC) (4). The object of this study was only NSCLC, with particular attention on AC and LSCC.
AC is the dominant type of lung cancer in women and in never-smokers, and comprises of 40-50% of all cases (1, 4). AC tumours are derived from lung alveolar cells and are located mostly on the periphery of the lungs (4, 8). LSCC constitutes 20-30% of all lung cancer cases and is strongly associated with tobacco smoking (4). LSCCs are derived from respiratory epithelial cells and are located mainly in the primary or secondary bronchi, in the central part of the lung (1, 4).
NSCLC represents a difficult therapeutic problem due to its low sensitivity to standard chemotherapy. The most effective form of therapy is surgical treatment, which is strongly recommended for patients with stage I-II NSCLC (9). Unfortunately, lung cancer may not give rise any significant symptoms for a long time. As a result, about 60% of the patients are diagnosed with the more advanced stages (III or IV) of the disease, when it is too late for successful surgery (7). In these cases, platinum-based chemotherapy and high-dose radiotherapy are routinely applied (9). Immunotherapy and targeted drugs, directed against specific proteins crucial for the cancer development, are also used (10, 11). These diverse forms of treatment may seem to be effective, but unfortunately, they are not sufficiently so. In 35 years (from 1975 to 2011), the 5-year survival rate of patients with NSCLC increased only slightly, from 12% to 18% (2).
NSCLC most often metastasizes to brain and bones (4), but metastatic patterns differ depending on histological subtype, sex and age at the diagnosis (12). In order to acquire metastatic potential, cancer cells need to completely change their gene-expression pattern. There are two postulated mechanisms by which tumour cells may become metastatic. The first is the gradual accumulation of genomic changes during the carcinogenesis process. The second is the rapid change in the expression of whole sets of genes, induced by a single factor or a group of them (13). One such factor may be the special AT-rich binding protein 1 (SATB1), a genome organizer and a potent transcriptional regulator.
Eukaryotic gene expression is controlled at multiple hierarchical levels, with the 3-dimensional organization of chromatin being one mechanism for gene regulation (13, 14). SATB1 is a nuclear matrix protein that binds to specific genome sequences named base-unpairing regions, and organizes DNA into tertiary structures (14, 15). It mediates chromatin looping, provides a nuclear platform necessary for the binding of further transcription factors and chromatin modifying enzymes, regulates epigenomic modifications and maintains proper nucleosome positioning (13). It has the ability to simultaneously control the expression of whole sets of genes, even those located on distant chromosomes (8, 14). SATB1 is expressed in embryonic stem cells as well as in numerous adult progenitor cells, e.g. amyloblasts and osteoblasts (13, 16, 17). Physiologically, besides embryonic development, SATB1 takes part in the processes that require rapid changes in cell phenotype, such as the differentiation and maturation of thymocytes and skin epithelial cells (13). Additionally, it is highly expressed in post-natal neurons during the development of the brain cortex, and it is required for proper neuronal plasticity (18). As well as its function in normal cells, SATB1 has been found to be overexpressed in numerous malignancies, including breast, colorectal, prostate, liver, bladder and ovarian cancer (19-24). In these tumour types, a high SATB1 level has been associated with an aggressive phenotype and a poor prognosis (19-24). SATB1 is a regulator of the epithelial-mesenchymal transition in cancer cells (25-28). Han et al. demonstrated that SATB1 knock-down in the highly aggressive MDA-MB-231 breast cancer cell line altered the expression of more than 1,000 genes, resulting in the inhibition of proliferation, invasion and tumour growth, as well as metastasis (19). A similar effect was observed in lung, oesophageal and nasopharyngeal cancer cells (29-32).
Although numerous studies have revealed that SATB1 may have a significant impact on cancer progression, its role in NSCLC remains unclear. SATB1 is necessary for proper lung development during embryogenesis, and its depletion in mice was lethal (33). Expression of SATB1 is also elevated in respiratory epithelial cells, whereas in lung alveoli it is relatively low (8, 29, 30). To date, the role of SATB1 in NSCLC has been examined in just a few studies. Zhou et al. observed that SATB1 mRNA expression was 13-fold higher in NSCLC than in normal lung tissues (34). Three other studies did not confirm these findings – microarray gene-expression analysis showed down-regulation of SATB1 in lung cancer cells when compared to non-malignant lung tissues (8, 35-37). Selinger et al. demonstrated that SATB1 expression was decreased in LSCC as compared to respiratory epithelial cells, and that a low SATB1 level was a negative prognostic factor in that type of lung cancer (8). On the other hand, Huang et al. demonstrated SATB1 to be overexpressed in AC as compared to non-malignant lung tissues. The effect of such overexpression on patient survival was not considered (29). It is still unclear whether the role of SATB1 is the same in all NSCLC subtypes. Moreover, the prognostic significance of SATB1 in NSCLC needs to be further investigated.
All of the studies on SATB1 expression in NSCLC have been based on protein or mRNA testing, but never on both. For this reason, the aim of the present study was to investigate the expression of SATB1 protein and mRNA in a coherent group of patients with NSCLC, as well as to determine the possible relationships of SATB1 expression with both the expression of the proliferative marker Ki-67 and the clinicopathological data of the patients, including their overall survival.
Materials and Methods
Patient cohort. The present study was approved by the Bioethics Commission at the Wroclaw Medical University in Poland, approval no. KB-632/2017. A total of 297 NSCLC and adjacent non-malignant lung tissue samples were collected from patients treated at the Lowers Silesian Centre of Lung Diseases in Wroclaw during the years 2007-2016. The study group consisted of 158 ACs, 119 LSCCs and 20 non-malignant lung tissue (NMLT) samples. From each sample, formalin-fixed paraffin-embedded (FFPE) tissue blocks were prepared. Moreover, 85 fresh fragments of cancer and non-malignant tissues (40 AC, 29 SCC, 16 NMLT) were fixed in RNAlater™ Stabilization Solution (Thermo Fisher Scientific, Waltham, MA, USA) for further real-time polymerase chain reaction (PCR) studies. The histological types of the tumours were assessed by two independent pathologists using the World Health Organization Classification (4) and additionally confirmed by immunohistochemical staining for specific markers: TTF1 (AC marker) and p63 (LSCC marker). The pTNM classification was made according to the recommendations of the International Association for the Study of Lung Cancer (38). Clinical, pathological and survival data were obtained from the hospital archives and are listed in Tables I and II.
Clinicopathological data of the patients: immunohistochemical studies.
Cell lines. Normal lung fibroblasts (IMR-90) and the lung cancer cell lines NCI-H1703 (LSCC) and A549 (AC) were obtained from the American Type Culture Collection (Manassas, VA, USA). The cell culture media used were Minimum Essential Medium supplemented with non-essential amino acids for the IMR90 cell line, RPMI-1640 for the NCI-H1703 cell line and high-glucose Dulbecco's modified Eagle's medium for the A549 cell line. All of the media were additionally supplemented with L-glutamine to a final concentration of 2 mM, and with fetal bovine serum to a final concentration of 10%. All of the cell culture media and reagents were purchased from Sigma-Aldrich (Saint Louis, MO, USA).
Clinicopathological data of the patients: real-time polymerase chain reaction studies.
Tissue microarrays (TMAs). TMAs were created with the use of a TMA Grand Master (3DHistech, Budapest, Hungary) automatic tissue microarrayer. From each FFPE tissue block, 4 μm-thick sections were cut and stained with haematoxylin and eosin. Next, the prepared slides were scanned with a Pannoramic MIDI II (3DHistech) histological scanner. Representative spots for the TMAs (three spots with 1.5 mm diameter from each FFPE block) were selected by a qualified pathologist from the digital slides with the use of Case Viewer (3DHistech) software. Finally, TMAs were created using the TMA Grand Master system, following the manufacturer's instructions.
Immunohistochemistry (IHC). IHC reactions were performed on the 4-μm thick paraffin sections using a DAKO Autostainer Link48 (Dako, Glostrup, Denmark). In order to deparaffinise, rehydrate and unmask the antigens, the sections were boiled in Target Retrieval Solution (pH 9.0 for SATB1 and pH 6.0 for Ki-67) for 20 min at 97°C using the Pre-Treatment Link Platform and, subsequently, cooled in EnVision FLEX Wash Buffer (Tris-buffered saline solution containing Tween 20). The activity of endogenous peroxidase was blocked by incubation in EnVision FLEX Peroxidase-Blocking Reagent (5 min, room temperature). The sections were then washed in EnVision FLEX Wash Buffer. The detection of the SATB1 and Ki-67 antigens was conducted for 20 min at room temperature. The primary antibodies used were mouse monoclonal antibody to human SATB1 (TA500589, diluted at 1:100; OriGene, Rockville, MD, USA), and mouse antibody to human Ki-67 clone MIB-1 (IS626, ready-to-use; Dako). The primary antibodies were diluted in FLEX Antibody Diluent. After washing the sections in EnVision FLEX Wash Buffer, EnVision FLEX/horseradish peroxidise (HRP)-conjugated secondary antibodies were applied (20 min, room temperature). Subsequently, the sections were washed in EnVision FLEX Wash Buffer. After that, the substrate for peroxidase,3,3’-diaminobenzidine (DAB), was applied and the sections were incubated for 10 min at room temperature. Finally, all the sections were counterstained with FLEX hematoxylin for 7 min at room temperature, dehydrated in graded ethanol solutions (70%, 96%, 99,8%) and xylene, and mounted in SUB-X Mounting Medium. All of the reagents used, with the exception of the anti-SATB1 antibody, were obtained from Dako.
Evaluation of IHC reactions. The IHC slides were scanned with the Pannoramic MIDI II (3DHistech) histological scanner and evaluated using QuantCenter (3DHistech) digital image analysis software. The cells of interest (cancer cells or normal lung alveolar cells) were distinguished from other cellular components using the PatternQuant (3DHistech) software module. Next, the NuclearQuant (3DHistech) module was used in order to determine the percentage of positively stained nuclei and the intensity of the reaction of the selected cells only. Nuclear SATB1 expression was assessed using the Allred scale. This scoring system was calculated by adding the number representing the proportion of positive cells (0-5) to the number reflecting the intensity of the nuclear stain (0-3) (39). The final score value is within the range from 0 to 8, where 0 indicates no positive nuclei, and 8 indicates more than 66% of highly positive nuclei (Table III). Nuclear Ki-67 expression was assessed using the simplified scale, based on tumour cell positivity alone (Table IV) (40).
RNA isolation and cDNA synthesis. The total RNA from the analysed cell lines (IMR90, NCI-H1703 and A549), and the NSCLC and NMLT samples was isolated with the use of RNeasy® Mini Kit (QIAGEN, Hilden, Germany), according to the manufacturer's handbook. Genomic DNA was eliminated during the isolation process through on-column DNAse digestion. For each sample, 400 ng of total RNA was transcribed to cDNA with the use of iScript™ Reverse Transcription Supermix for RT-qPCR (Bio-Rad, Hercules, CA, USA) and a C1000 Touch Thermal Cycler (Bio-Rad). The conditions of the reactions were as follows: priming for 5 min at 25°C, reverse transcription for 20 min at 46°C, and final inactivation of reverse transcriptase for 1 min at 95°C.
Real-time PCR. Real-time PCR was used to determine the relative level of SATB1 mRNA expression in the analysed cell lines (IMR90, NCI-H1703 and A549), and the NSCLC and NMLT samples. The reactions were performed using a 7500 Real-Time PCR System (Applied Biosystems, Foster City, CA, USA) and iTaq™ Universal Probes Supermix (Bio-Rad), according to the manufacturer's instructions. The TaqMan probes used were Hs00161515_m1 for SATB1 and Hs00188166_m1 for gene coding for succinate dehydrogenase flavoprotein subunit (SDHA) (Thermo Fisher Scientific, Waltham, MA, US), an endogenous control gene, further used for normalisation purposes. The reactions were carried out in triplicates under the following conditions: initial denaturation for 2 min at 94°C, followed by 45 cycles of denaturation (15 s, 94°C) and annealing with elongation (1 min, 60°C). The relative SATB1 mRNA expression levels were calculated using the ΔΔCt method.
Allred scoring system (39). The final score is calculated as the sum of factors A and B, and ranges from 0 to 8.
Scoring system used for the evaluation of Ki-67 expression (40).
Droplet digital PCR. The Droplet digital PCR method was used to determine the absolute number of SATB1 mRNA copies in the analysed cell lines (IMR90, NCI-H1703 and A549), and to confirm the real-time PCR results. The reaction mixtures contained 1.33 μl of reverse transcription product, 1 μl of SATB1-specific TaqMan probe Hs00161515_m1 (Thermo Fisher Scientific), 7.67 μl of molecular biology-grade water and 10 μl of ddPCR™ Supermix for Probes (Bio-Rad). A total of 20 μl of the reaction mixture was loaded into a plastic cartridge with 70 μl of Droplet Generation Oil for Probes (Bio-Rad) in the QX200 Droplet Generator (Bio-Rad). The droplets obtained from each sample were then transferred to a 96-well PCR plate (Eppendorf, Hamburg, Germany). PCR amplifications were carried out in a C1000 Touch Thermal Cycler (Bio-Rad) under the following conditions: enzyme activation for 10 min at 95°C, followed by 40 cycles of denaturation (30 s, 94°C) and annealing/extension (1 min, 60°C), and a final enzyme deactivation for 10 min at 98°C. Finally, the plate was loaded onto a QX200 Droplet Reader (Bio-Rad) and read automatically. The quantification of the SATB1 mRNA is presented as the number of copies per microlitre of the reaction mixture.
Protein isolation, sodium dodecyl sulfate polyacrylamide gel electrophoresis (SDS-PAGE) and western blot. Whole protein lysates from the IMR90, HCI-H1703 and A549 cell lines were obtained using CelLytic™ MT Cell Lysis Reagent (Sigma-Aldrich) with the addition of Halt™ Protease Inhibitor Coctail (Thermo Fisher Scientific) and 0.2 mM phenylmethylsulfonyl fluoride (Sigma-Aldrich). The protein concentrations were quantified using Pierce BCA Protein Assay Kit (Thermo Fisher Scientific) and a NanoDrop™ 1000 (Thermo Fisher Scientific) spectrophotometer. Equal amounts of total protein (30 μg) were mixed with Laemmli sample buffer and resolved on 10% acrylamide gel by SDS-PAGE (41). After electrophoresis, the samples were transferred to Immobilon-P polyvinylidene difluoride membranes (Merck, Darmstadt, Germany) in an XCell SureLock™ Mini-Cell Electrophoresis System (Thermo Fisher Scientific). Next, the membranes were blocked in 4% bovine serum albumin (Merck) solution in buffer (0.2 M Tris; 1.5 M NaCl; 0,1% Tween-20). After blocking, the membranes were incubated overnight at 4°C with primary mouse monoclonal antibody to human SATB1 (TA500589, diluted at 1:1,000; OriGene).The membranes were then incubated with secondary HRP-conjugated donkey anti-mouse antibody (715-035-150, diluted at 1:3,000; Jackson ImmunoResearch, West Grove, PA, USA), for 1 h at room temperature. Finally, the membranes were rinsed and treated with Luminata Classico (Merck) chemiluminescent substrate. The reactions were visualized using the ChemiDoc Imaging System (Bio-Rad). β-Tubulin, detected with primary rabbit antibody to human β-tubulin (ab6046, diluted at 1:1,000; Abcam, Cambridge, UK), and secondary HRP-conjugated donkey anti-rabbit antibody (711-035-152, diluted at 1:3,000; Jackson ImmunoResearch), was used as an internal control in order to normalize the amounts of SATB1. Densitometric analysis of results obtained was performed with the use of Image Lab software (Bio-Rad).
Statistical analysis of results. The results were analysed with the use of Prism 5.0 (GraphPad Software, La Jolla, CA, USA) and Statistica 12.5 (StatSoft, Krakow, Poland) statistical software. The Shapiro–Wilk test was used to determine whether the sample data were normally distributed. To compare groups of data, the non-parametric Mann–Whitney U-test was used. Correlations between parameters analysed were assessed using Spearman's rank correlation test. Survival times were determined by the Kaplan–Meier method, and the significance of the differences was determined by log-rank test. Cox proportional hazards model was used to calculate univariate and multivariate hazard ratios for the investigated variables. All the results were considered statistically significant when p<0.05.
For the purpose of statistical analyses, the investigated cases were divided into two groups based on the SATB1, SATB1 and Ki-67 expressions. The cut-off point for SATB1 score was determined with the use of the Cutoff Finder web application (42). Cases characterized by an SATB1 score of 0-5 points were regarded as having low expression, whereas those scoring 6-8 points were regarded as having high expression. The cut-off points for the SATB1 RQ and Ki-67 score were the medians of these parameters: RQ=2.5 for SATB1 and score 1 (25% positive nuclei) for Ki-67.
Results
SATB1 immunoreactivity was elevated in NSCLC as compared to NMLT samples. In order to determine SATB1 expression at the protein level, NSCLC and NMLT samples were stained by IHC and further subjected to digital image analysis. Nuclear SATB1 expression was observed in cancer cells (Figure 1A-E), in normal respiratory epithelial cells (Figure 1G) and in infiltrating lymphocytes (Figure 1H). Most of the normal pneumocytes in NMLT samples were SATB1-negative (Figure 1F). Low SATB1 expression was observed in 249 (89.89%) of the NSCLC samples analysed, whereas high expression was found in 28 (10.12%). SATB1 expression was also low in all of the NMLT samples. The statistical analysis revealed that SATB1 expression (mean±SD) was significantly elevated in NSCLCs (3.94±1.16) when compared to adjacent non-malignant lung tissues (3.00±0.44; p<0.0001). SATB1 level differed also among NSCLC subtypes, being significantly higher in LSCC (4.16±1.28) than in AC cases (3.78±1.03; p=0.0164).
SATB1 expression was related to grade of tumour malignancy in AC. We noted that the expression of SATB1 increased with increasing grade (G) of malignancy of the tumour in AC. Average SATB1 scores were significantly higher in G3 (4.16±1.05) than in G1 (3.00±0.58) and G2 tumours (3.46±0.91; p<0.0001 and p=0.0047 respectively;). However, no significant difference was noted between G1 and G2 in AC cases. Interestingly, in LSCCs, the relationship between SATB1 expression and the tumour grade was reversed: in G3 tumours, the average SATB1 score was significantly lower when compared to G2 (3.47±1.20 vs. 4.51±1.17; p<0.0001).
The analysis of the average SATB1 scores for the whole study cohort, as well as in the AC and LSCC subtypes, did not reveal any associations between SATB1 score and the gender and age of the patients, size of the tumour, presence of lymph node metastases or stage of the disease (Table V).
SATB1 mRNA expression was down-regulated in NSCLC as compared to NMLT samples. To quantify SATB1 mRNA expression levels in NSCLC and NMLT samples, real-time PCR was used. SATB1 mRNA was found to be expressed in all of the studied samples. The results obtained revealed that SATB1 expression was significantly reduced in NSCLC (RQ=2.709±1.685) when compared to non-malignant lung tissues (RQ=3.851±1.235; p=0.0076). Moreover, SATB1 expression in AC (RQ=2.42±1.81) was significantly lower than in LSCC (RQ=3.11±1.44; p=0.0395). Further analysis of SATB1 expression for the whole study cohort, as well as in the AC and LSCC subtypes, revealed that lower SATB1 RQ was associated with higher grade of malignancy of NSCLC (p=0.0463; Table VI). No other associations with clinicopathological data were noted.
We observed significant weak positive correlation between SATB1 expression and SATB1 immunoreactivity in the whole study cohort (r=0.3243, p=0.0066; data not shown). Curiously, no significant correlation was observed between SATB1 expression and SATB1 immunoreactivity when NSCLC subtypes were analysed separately (data not shown).

Special AT-rich binding protein 1 (SATB1) expression in lung adenocarcinomas (ACs; A-C) and squamous cell carcinomas (LSCCs; D and E). In AC, SATB1 expression increased with increasing grade of tumour malignancy – in grade 1 (A) and grade 2 (B) cases, it was relatively low, whereas in grade 3 (C) it was significantly elevated. The opposite relationship was observed in LSCC, where SATB1 expression was significantly higher in grade 2 (D) when compared to grade 3 tumours (E). Very low SATB1 expression was noted in non-malignant lung tissues (F), whereas airway epithelial cells (G) and infiltrating lymphocytes (H) were mostly SATB1-positive.
Ki-67 expression reflected expression of SATB1. To determine Ki-67 antigen expression in the NSCLC and NMLT samples, IHC staining and digital image analysis were performed. We observed nuclear Ki-67 expression in cancer cells and in some of the infiltrating lymphocytes, but not in the tumour stroma and non-malignant lung tissues. Ki-67 expression was low in 109 (39.35%) of the NSCLC cases, whereas it was high in 168 (60.65%) of them. We observed the Ki-67 index to be significantly elevated in NSCLC samples (35.26±23.12%) when compared to non-malignant lung tissues (0.082±0.16%; p<0.0001). Additionally, there was a difference in Ki-67 expression between NSCLC subtypes: it was significantly higher in LSCC (42.78±23.49%) compared to AC (29.52±21.17%; p<0.0001). No significant difference was noticed in Ki-67 expression among AC tumours with different malignancy grades. However, in LSCC, the Ki-67 index was higher in G2 (46.92±21.91%) than in G3 tumours (34.61±24.62%; p=0.0078; data not shown). There was an association between an augmented Ki-67 expression and the presence of lymph node metastases in NSCLCs and ACs (p=0.0324 and p=0.0223 respectively; data not shown), as well as with a higher stage of the disease in NSCLCs (p=0.0343; data not shown).
SATB1 score positively correlated with Ki-67 index. Further analyses revealed that there was a weak positive correlation between the SATB1 score and the Ki-67 index for the whole study cohort (r=0.2157, p=0.0003; Figure 2A). Additionally, in LSCC cases, a moderate positive correlation of SATB1 score and Ki-67 index was noted (r=0.4127, p<0.0001; Figure 2C). Surprisingly, no correlation between SATB1 and Ki-67 expression was observed in AC cases (Figure 2B). There was also no correlation between the SATB1 RQ and the Ki-67 index for the whole study cohort nor by NSCLC subtype.
SATB1 protein level did not correspond with SATB1 mRNA expression in NSCLC cell lines and normal lung fibroblasts. The analysis of SATB1 protein level in the studied cell lines revealed an increased expression of SATB1 in NCI-H1703 LSCC cells. The SATB1 level in the A549 AC cell line and in normal lung fibroblasts (IMR90) was relatively small (Figure 3A). Densitometric analysis showed that the relative optical density for SATB1 was significantly higher in the LSCC cell line than in normal lung fibroblasts (p=0.0286) and A549 cells (p=0.0286; Figure 3B).
To investigate the SATB1 mRNA expression in IMR90, NCI-H1703 and A549 cell lines, real-time PCR was used. Surprisingly, SATB1 was expressed only in the IMR90 and the A549 cell lines, while in NCI-H1703 cells, SATB1 mRNA was barely detectable. In IMR90 cells, the RQ for SATB1 was significantly elevated when compared to the NCI-H1703 and A549 cell lines (RQ=204.4 vs. 0.01802 23.23, p=0.0022 and p=0.0022, respectively). There was also a significant difference between the SATB1 expression in the NCI-H1703 and the A549 cell lines (p=0.0048).
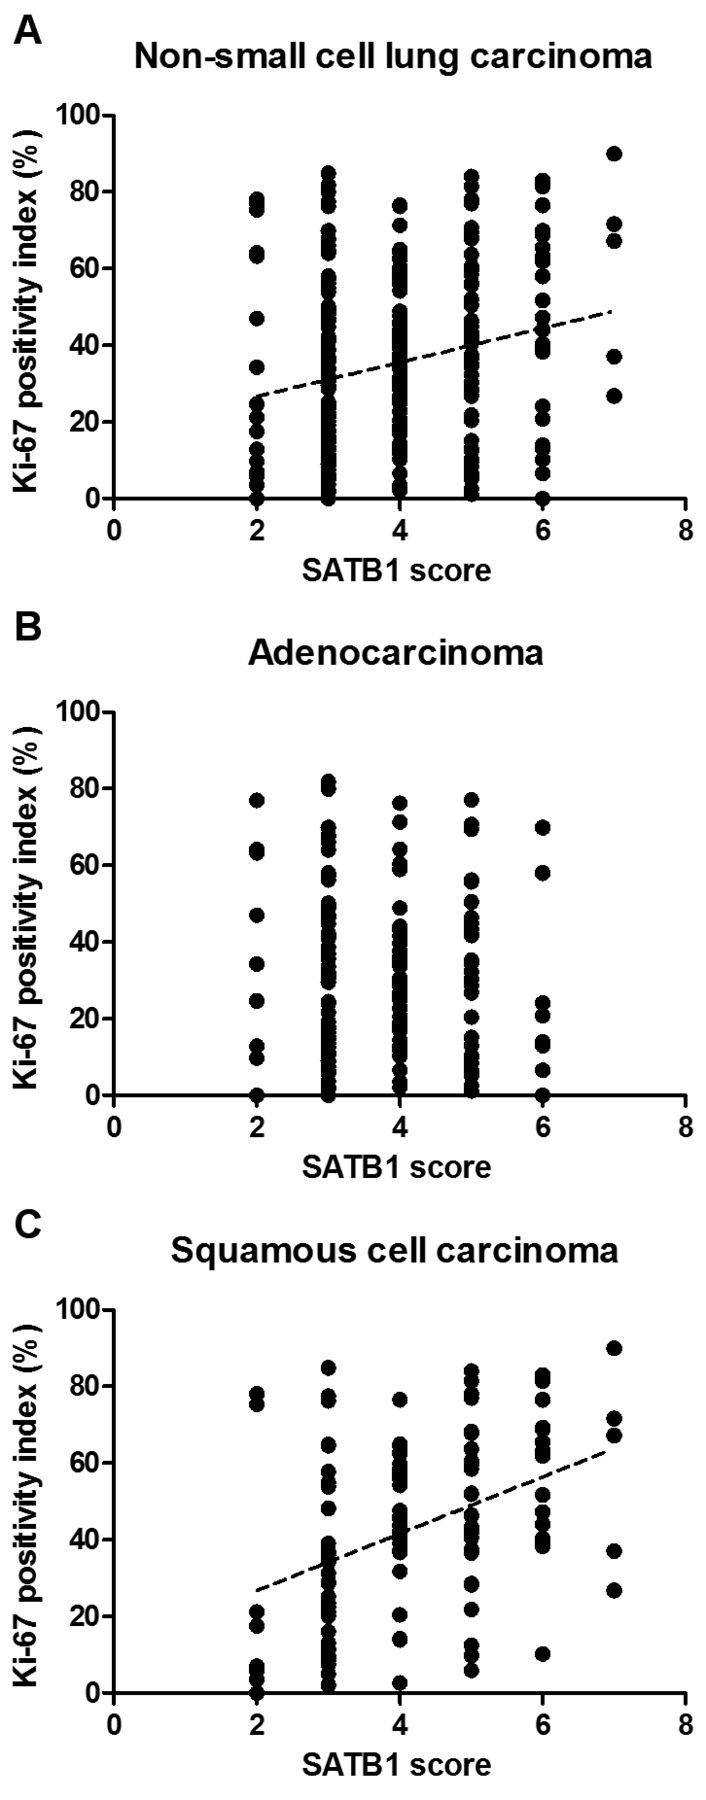
Correlation between special AT-rich binding protein 1 (SATB1) score and Ki-67 positivity index for the whole study cohort and in non-small cell carcinoma (NSCLC) subtypes. SATB1 level correlated positively with Ki-67 expression in NSCLC (A; r=0.2157, p=0.0003, Spearman's rank correlation test) and squamous cell carcinoma cases (C; r=0.4127, p<0.0001, Spearman's rank correlation test). No correlation was noted in adenocarcinomas (B).
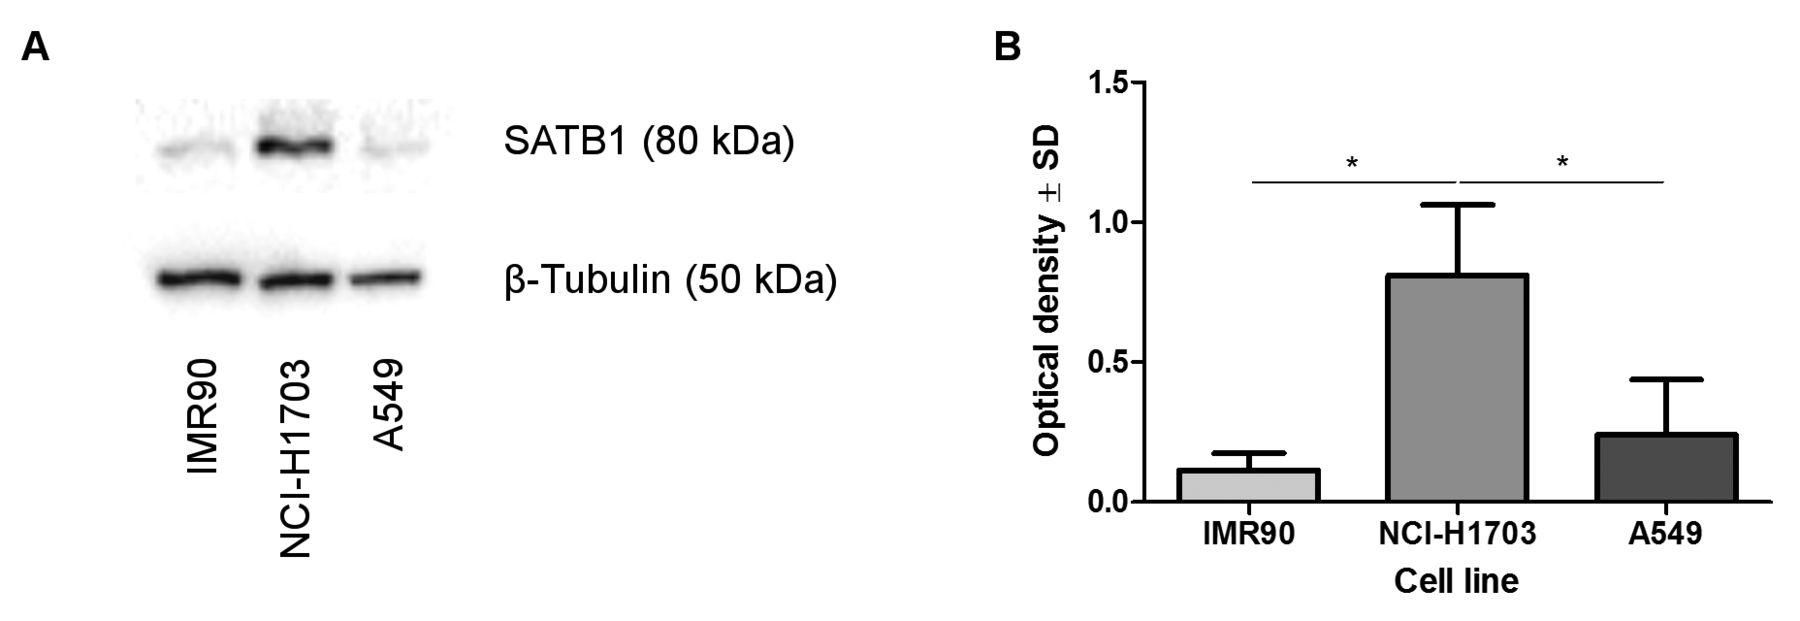
Divergent patterns of special AT-rich binding protein 1 (SATB1) expression in normal lung fibroblast (IMR90), squamous cell carcinoma (NCI-H1703) and adenocarcinoma (A549) cell lines. Densitometric measurement of the bands revealed an increased SATB1 expression in NCI-H1703 cells when compared to IMR90 and A549 cell lines (A, B; p=0.0286 and p=0.0286 respectively, Mann–Whitney U-test). SATB1 levels were normalized against β-tubulin.
To additionally confirm real-time PCR results, the droplet digital PCR was performed. This method is very sensitive and is able to detect the presence even of single copies of the investigated mRNA in the reaction mixture. SATB1 mRNA was detected in all of the analysed samples. However, the amounts in the NCI-H1703 and the A549 cells were very small, at only 0.4433 and 4.933 copies/μl, respectively. SATB1 mRNA expression patterns were similar to those determined by the real-time PCR method, but the differences between cell lines were not statistically significant. To ensure that low SATB1 mRNA levels were not caused by degradation of genetic material, the expression of the housekeeping gene SDHA was additionally checked. SDHA mRNA was found to be stable and abundantly expressed in all of the analysed cell lines (data not shown).
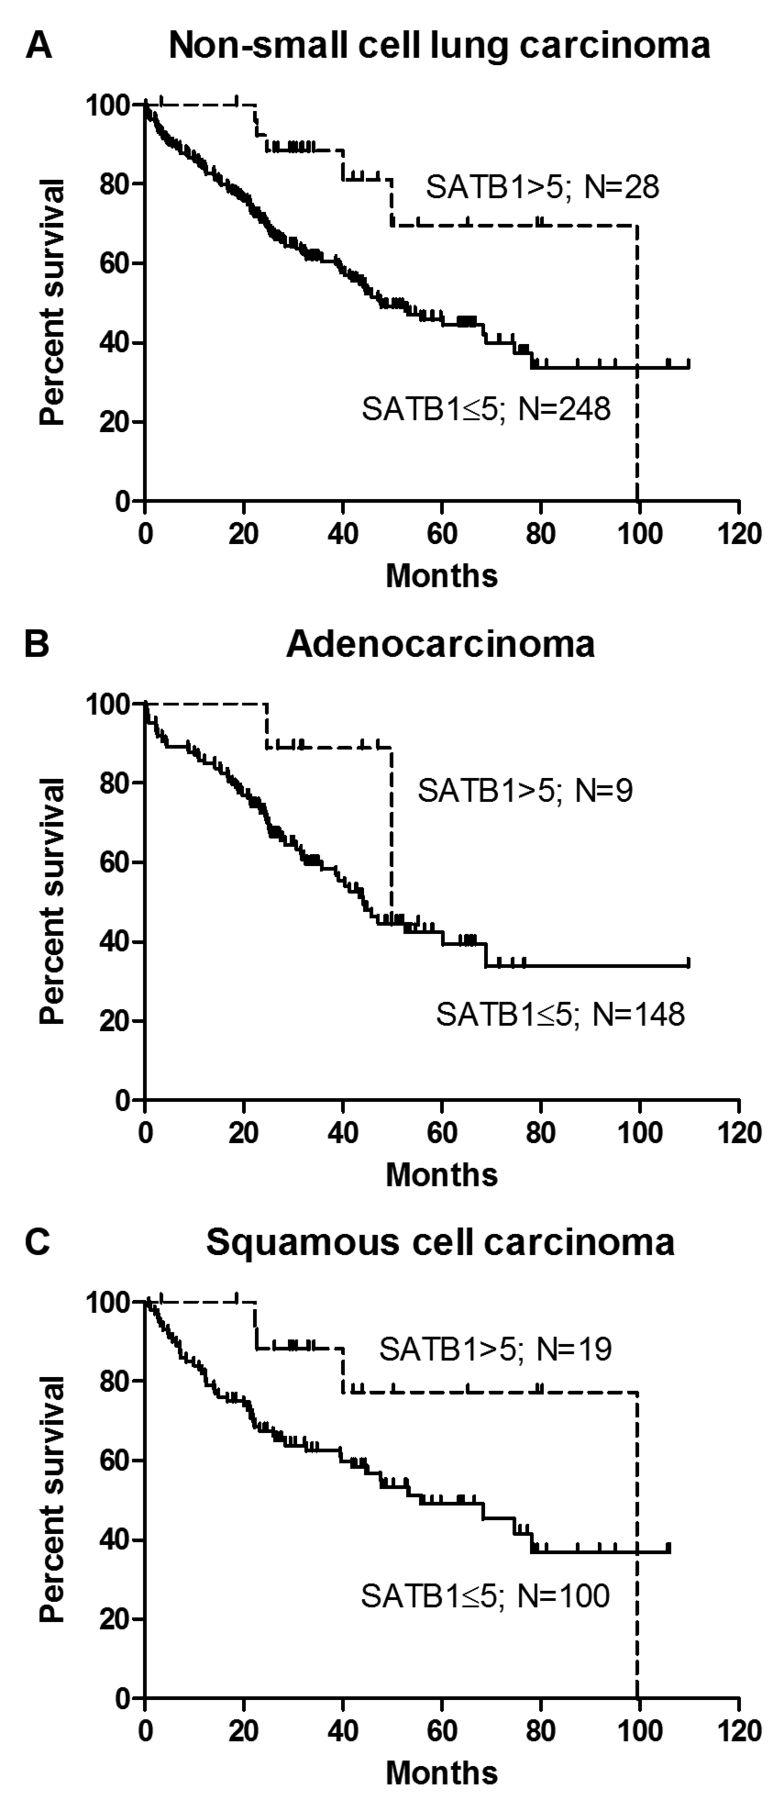
Prognostic significance of SATB1 expression in NSCLC. To determine the impact of SATB1 expression on patient survival, Kaplan–Meier survival curves were compared using the log-rank (Mantel-Cox) test. The results obtained revealed that a high SATB1 level (>5) was a positive prognostic factor for patients with NSCLC (p=0.0167; Figure 4A), but not for those with AC (p=0.1593; Figure 4B) or LSCC (p=0.0585; Figure 4C).
Furthermore, the univariate analysis of patient survival considering the whole study group additionally confirmed a high SATB1 score to be associated with positive patient outcome (p=0.0213; Table VII). From among the analysed factors, the presence of lymph node metastases (p=0.0011), an advanced stage of disease (p=0.0038) and a larger primary tumour size (p=0.0114) were associated with a poor prognosis. The multivariate survival analysis showed that in NSCLC, a high SATB1 score was a predictive factor independent from the presence of lymph node metastases and from the stage of disease (Table VII). In the AC group, the presence of lymph node metastases (p=0.0047, univariate survival analysis; Table VIII), a larger tumour size (p=0.0427) and an advanced stage of disease (p=0.0475) were associated with a poor prognosis. In patients with LSCC, only an advanced stage of disease had a negative impact on overall survival (p=0.0499, univariate survival analysis; Table IX).
Discussion
To the best of our knowledge, our research is the first in which SATB1 expression was assessed at the protein as well as mRNA level in NSCLC and NMLT samples. Surprisingly, we noted a significantly higher SATB1 immunoreactivity in NSCLC compared to normal lung samples, whereas SATB1 mRNA expression in NSCLC specimens was decreased in comparison with adjacent non-malignant lung tissues. It cannot be excluded that these divergences were caused by the presence of small respiratory epithelium fragments in the NMLT samples, homogenized for further mRNA isolation, but on the other hand, similar discrepancies observed in normal lung fibroblasts (IMR90), and the LSCC (NCI-H1703) and AC (A549) cell lines could suggest that SATB1 in NSCLC might be post-trascriptionally regulated. The weak positive correlation between SATB1 immunoreactivity and SATB1 RQ for the whole study cohort but a lack of such correlation NSCLC subtypes seems to support these findings. Our results are similar to those obtained by Kowalczyk et al., who observed similar aberrations in SATB1 protein and mRNA levels in colorectal cancer and in clear cell renal cell carcinoma (44, 45). Moreover, it was shown that SATB1 may be down-regulated by micro-RNA miR-21-5p in clear cell renal cell carcinoma and in rectal cancer cells (45, 46).
Special AT-rich binding protein 1 (SATB1) expression according to clinicopathological data of patients with non-small cell lung carcinoma.
Relative special AT-rich binding protein 1 (SATB1) mRNA expression (RQ) and clinicopathological data of patients with non-small cell lung carcinoma.
SATB1 expression might also be regulated by miRNAs in other malignancies, such as breast cancer (miR-7, miR-155 and miR-448) and osteosarcoma (miR-23a) (25, 47, 48). Additionally, the suppression of miR-448 in breast cancer cell lines resulted in SATB1 up-regulation and induction of epithelial–mesenchymal transition (25).

Kaplan–Meier survival curves for patients with non-small cell lung carcinoma (NSCLC), adenocarcinoma (AC) and squamous cell carcinoma (LSCC). Log-rank (Mantel-Cox) test results revealed a high special AT-rich binding protein 1 (SATB1) score (>5) to be a positive prognostic factor in NSCLC (A; p=0.0167), but not in AC (B; p=0.1593) and LSCC (C; p=0.0585).
Our results showed that SATB1 immunoreactivity was significantly higher in LSCC compared to AC cases. These findings are in accordance with those of Selinger et al. (8). Furthermore, we confirmed this observation in the LSCC cell line, which presented a significantly higher level of SATB1 protein than did the AC and the normal fibroblast cell lines. This could be at least partially explained by the presence in the LSCC cases of expression of p63 protein, a well-known marker of LSCC. The p63 protein was found to be a positive regulator of the SATB1 expression (49). In the present study, all of the analysed LSCC cases were p63-positive (data not shown). We demonstrated that the average SATB1 score increased with the grade of malignancy of the AC tumours. These findings are in line with Huang et al.'s report, which showed that a positive SATB1 expression is correlated with a poor degree of AC differentiation (29). Similar results were also obtained by Selinger et al., but in their research, all NSCLC subtypes were analyzed together, and no distinction was made between AC and LSCC (8). Additionally, Huang et al. demonstrated that SATB1 down-regulation led to inhibition of proliferation, migration and invasion of the A549 AC cell line (29). These findings could suggest that SATB1 contributes to the invasion and metastasis of AC. Interestingly, our results showed that in LSCC the relationship between SATB1 expression and tumour malignancy grade was opposite. In more aggressive LSCC tumours, SATB1 immunoreactivity was significantly decreased in comparison to less aggressive ones. These findings may seem surprising, but they agree favourably with Selinger et al., and support the idea that the loss of SATB1 expression is associated with poor survival of patients with LSCC (8).
Differences in SATB1 expression patterns between the AC and LSCC subtypes of lung cancer may be caused by at least two possible factors: the heterogeneity of NSCLC tumours and regulation by SATB1 of genes in a tissue-specific manner (4, 14). Both AC and LSCC, despite being classified together as a NSCLC, harbour very different features. These NSCLC subtypes differ in their origin, gene expression profile and driver mutations (1, 4, 50). AC tumours are derived mainly from type II pneumocytes, cells lining the lung alveoli and expressing a very low level of SATB1 (8, 29, 30, 50). LSCCs originate from respiratory epithelial cells, which have a physiologically high SATB1 level (4, 8). During the processes of cancer initiation and progression, cells change their morphology, gene expression and metabolic behaviour due to genetic mutations, chromosome instability and epigenetic changes (51-53). It may be hypothesized that during these processes, AC cells gain SATB1 expression, whereas LSCC cells lose it, especially if SATB1 has different functions in pneumocytes and respiratory epithelial cells. It has already been shown that SATB1 regulates specific groups of genes in different cell types. A bioinformatic analysis of SATB1-dependent gene expression in breast cancer cells and mouse primary keratinocytes revealed that gene sets regulated by SATB1 in these cells had only minimal overlap (49). In breast cancer cells, SATB1 influenced the expression of genes promoting metastasis, especially those involved in cell proliferation, the cell cycle, angiogenesis and cell adhesion (49). In primary keratinocytes, it mainly regulated genes responsible for cell differentiation and development, and those coding keratin-associated proteins (49). Unfortunately, there is a lack of literature on gene sets regulated by SATB1 in respiratory epithelial cells, but if they are similar to those in keratinocytes or T-cells, SATB1 may be responsible for epithelial cell maturation and differentiation (54, 55). It has been proved that SATB1 may repress the expression of NANOG, Kruppel-like factor 4 (KLF4) and T-box transcription factor (TBX3) genes, encoding pluripotency factors (17). Thus, a loss of SATB1 in poorly differentiated G3 LSCC tumours may result in an increased pluripotent potential of the cancer cells, and therefore be a favourable factor for tumour progression. In turn, in AC tumours, SATB1 may have functions similar to those in other cancer types that originate from cells with a physiologically low SATB1 level.
Univariate and multivariate survival analysis for the whole study cohort.
Univariate and multivariate survival analysis in patients with adenocarcinoma.
Univariate and multivariate survival analysis in patients with squamous cell lung cancer.
In the present study, we observed higher Ki-67 expression in LSCC than in AC cases. These results are in line with our previous findings regarding Ki-67 expression in NSCLC (40, 56). A decreased Ki-67 index in AC may be partly explained by its possible interactions with TTF1, an AC marker protein, which is known to repress Ki-67 expression (57, 58). All of the AC samples analysed were TTF1-positive (data not shown). Moreover, our results showed positive correlation between the Ki-67 index and the SATB1 score considering the whole study cohort as well as in the LSCC cases. This confirms previous results obtained by Kobierzycki et al. and Jankowska-Konsur et al., who observed positive SATB1/Ki-67 correlations in ductal breast carcinoma and mycosis fungoides (59, 60). Surprisingly, in a recent study, no significant correlation between these factors was found in AC tumours. These observations suggest that SATB1 may take part in the regulation of the proliferation of LSCC cells and could indicate a cell-specific role of SATB1.
Finally, we demonstrated that high SATB1 immunoreactivity was associated with significantly better overall survival of patients with NSCLC. This is in good agreement with previous findings showing loss of SATB1 expression as a marker of poor prognosis in patients with NSCLC who had ever smoked (8). Moreover, it was found that loss of SATB1 expression is a negative prognostic factor in LSCC (8). Our results seem to confirm this, but statistical significance was not achieved. Our analysis did not identify any relationship between SATB1 immunoreactivity and the overall survival of patients with AC. This might be due to the small number of AC cases with high SATB1 level in the studied group. This matches previous findings by Selinger et al., who showed that a low SATB1 expression did not affect survival of patients with AC (8). Lung ACs are very heterogeneous – according to the WHO guidelines, five different growth patterns can be distinguished (4). Different AC subtypes differ not only in morphological structure, but also in their gene-expression profiles, invasiveness and associated patient outcome (35, 61). It may be hypothesised that the impact of SATB1 on AC progression may be diverse depending on the tumour's growth pattern. Generally speaking, further research is needed in order to determine possible relationships between AC growth patterns and SATB1 expression.
In conclusion, we demonstrated, for the first time, that the mRNA and protein expression patterns of SATB1 in NSCLC and NMLT samples are divergent and non-corresponding. This may suggest that in NSCLC and NMLT, SATB1 is post-transcriptionally regulated. We observed an elevated SATB1 expression in NSCLC when compared to NMLT, and in LSCC when compared to AC samples. We also showed that in AC, SATB1 levels increased with the malignancy grade of the tumour, whereas in LSCC they decrease. Moreover, our analyses revealed that in NSCLC and LSCC, the SATB1 level correlated positively with the expression of the Ki-67 proliferative marker. No correlation between these factors was observed in ACs. The findings described may imply that SATB1 functions vary depending on the histological type of the tumour. Finally, we demonstrated that a high SATB1 level in NSCLC may be considered as a positive prognostic factor, independent of the presence of lymph node metastases and the stage of disease.
Acknowledgements
This study was supported by grant of the Medical University in Wroclaw, Poland, No. ST-810.
- Received October 30, 2017.
- Revision received November 17, 2017.
- Accepted November 23, 2017.
- Copyright© 2018, International Institute of Anticancer Research (Dr. George J. Delinasios), All rights reserved


