


Abstract
Background/Aim: The cytolytic activity (CYT) score is a new index of cancer immunity calculated from the mRNA expression levels of GZMA and PRF1. We assessed the clinical significance of the CYT score in HCC. Materials and Methods: The calculated CYT scores of peripheral blood cells (GSE24759), cell lines (CCLE) and HCC tissues (TCGA, GSE14520 and Kyushu cohorts) were assessed. Then, immunohistochemical analysis (IHC) of GZMA and PRF1 was performed. Results: The CYT scores of HCC tissues were lower than those of non-cancerous tissues. The 5-year recurrence-free survival of patients with low CYT scores was significantly shorter than that of patients with high CYT scores. Multivariate analysis indicated that the CYT score was an independent prognostic factor for RFS in TCGA and GSE14520 cohorts. Conclusion: CYT score could be a useful prognostic biomarker in HCC, possibly through reflecting the host immune status.
Hepatocellular carcinoma (HCC) is the major histological subtype of primary liver cancer, accounting for approximately 70-90% of all cases (1). HCC has been recognized as one of the most threatening malignancies because of the limited availability of effective therapeutic options (2, 3). However, over the past 5 years, several immune-checkpoint inhibitors have been approved that have dramatically changed the therapeutic landscape of advanced malignancies (4), including HCC (5).
Interactions between immune and malignant cells have been known for decades to have a clinical relevance. In fact, residual signs of an active anticancer immune response likely indicates a positive prognosis (6). However, there remains a lack of consensus on how to best evaluate the immune status. Quantitating tumor-infiltrating lymphocytes (TILs) and analyzing the presence of distinct mRNA species within the tumor are well recognized approaches (7).
Recently, Rooney et al. described the cytolytic activity (CYT) score, which was obtained by calculating the geometric mean of granzymes A (GZMA) and perforin (PRF1) mRNA expression levels in tissue. The CYT score was associated with cytotoxic T cell (CTL) markers and good outcomes in pan-cancer TCGA datasets (8). CTLs and natural killer (NK) cells release cytotoxic granules such as GZMA and PRF1 and kill tumor cells (9, 10). In patients with melanoma, the CYT score was a positive prognostic feature (11). Currently, the clinical significance of the CYT score in patients with HCC is unclear. Therefore, in this study, we determined the clinical and prognostic significance of CYT score in HCC.
Materials and Methods
Gene expression in human peripheral blood cells. We analyzed the expression of GZMA and PRF1 and the CYT score in human peripheral blood cells from the Gene Expression Omnibus (GEO) database (accession number GSE24759 (12)).
Analysis of the cancer cell line encyclopedia database. Normalized mRNA expression data of human cancer cell lines were obtained in the Cancer Cell Line Encyclopedia (CCLE (13)) (https://portals.broadinstitute.org/ccle). In the CCLE database, 1037 human cancer cell line expression profiles were available.
Analysis of public clinical datasets. We obtained data on RNA sequences and corresponding clinical information on HCC cases from The Cancer Genome Atlas (TCGA), via the Broad Institute's Firehose (http://gdac.broadinstitute.org/runs/stddata__2016_01_28/data/LIHC/20160128/). Of the 367 histologically hepatocellular carcinoma cases with mRNA expression profiles, clinical information was available for 361 cases. Expression profiles of 50 paired non-cancerous liver samples were also acquired. Gene-expression data of 247 HCC and 237 paired non-tumor liver samples were obtained from the GEO database (accession number GSE14520 (14)). Of the 247 cases in GSE14520, 242 survival profiles were available.
Gene Set Enrichment Analysis (GSEA). The associations between CYT scores and previously defined gene sets were analyzed by GSEA using HCC expression profiles from the TCGA and GSE14520 datasets. We analyzed gene sets in Hallmarks obtained from the Molecular Signatures Database v6.2 (http://software.broadinstitute.org/gsea/msigdb/index.jsp).
Patient and sample collection. Fifty-six patients with HCC who underwent hepatic resection at Kyushu University Beppu Hospital and affiliated hospitals between 2000 and 2004 were enrolled in this study. Resected tumor tissues and paired normal liver tissues were immediately stored in RNAlater (Ambion, Palo Alto, CA, USA), frozen in liquid nitrogen, and kept at −80°C until RNA extraction. A 5-year post-surgical follow-up was conducted. The median follow-up for the 56 patients was 52.1 months (range=3-60 months). Patients were staged according to the seventh edition of the International Union against Cancer TNM classification system. Of the 56 HCC patients, paired normal liver tissues were available in every case. All protocols were approved by the Ethics and Indications Committee of Kyushu University. Written informed consent was obtained from all patients.
RNA extraction and reverse transcription-quantitative polymerase chain reaction (RT-qPCR). Total RNA was isolated from the frozen tissue specimens through use of ISOGEN (Nippon Gene, Tokyo, Japan), according to the manufacturer's protocol. Complementary DNA (cDNA) was synthesized from 8 μg of total RNA using M-MLV reverse transcriptase (Invitrogen, Carlsbad, CA, USA) as previously described (15). qPCR was performed using a LightCycler 480 and a SYBR Green I Master kit (Roche Applied Science, Basel, Switzerland) following the manufacturer's protocol as previously described (16). The following primers were used: GZMA: 5’-ATCTGTGCTGGGGCTTTGATT-3’ (sense) and 5’-CTGGTTATTGAGTGAGCCCCA-3’ (antisense); PRF1: 5’-GACGTGACTCCTAAGCCCAC-3’ (sense) and 5’-CCCTCTTGAAGTCAGGGTGC-3’ (antisense); CD8A: 5’-CGGCCCTGAGCAACTCCATC-3’ (sense) and 5’-GGGACAGGGGCTGCGAC-3’ (antisense); GAPDH: 5’-AGCCACATCGCTCAGACAC-3’ (sense) and 5’-GCCCAATACGACCAAATCC-3’ (antisense). The expression levels of GZMA, PRF1 and CD8A mRNAs were normalized to that of GAPDH mRNA. The expression levels were calculated as values relative to the expression level of Human Universal Reference Total RNA (Clontech Laboratories, Palo Alto, CA, USA).
Immunohistochemical analysis. Immunohistochemistry of GZMA, PRF1 and CD8 in HCC cases was performed on formalin-fixed, paraffin-embedded tissues. Tissue sections were deparaffinized and autoclaved at 121°C for 20 min for antigen retrieval in 10 mM citrate buffer (pH 6.0) for PRF1 detection or in Tris-EDTA buffer (pH 9.0) for GZMA and CD8 detection. The following primary antibodies were used: monoclonal rabbit anti-GZMA antibody (ab209205; Abcam, Cambridge, UK) diluted 1:100; monoclonal mouse anti-PRF1 antibody (ab47225; Abcam) diluted 1:100; and, monoclonal mouse anti-CD8 antibody (M7103; Dako, Glostrup, Denmark), diluted 1:100. All tissue sections were immunohistochemically stained with ENVISION reagents (ENVISION1 Dual Link/HRP; Dako) and counterstained with hematoxylin as previously described (17). Tumor histology was independently reviewed by an experienced pathologist.
Calculation of the CYT score
The CYT score was calculated as the geometric mean of GZMA and PRF1 (CYT score=√ GZMA × PRF1) in each dataset.
Statistical analysis. Analysis of public datasets was performed using quantile normalization in which the relative ranks of genes within each sample were replaced by values having the same relative rank in the pooled distribution. All quantile normalized data underwent subsequent log10 transformation. Pearson's correlation coefficient was used to assess the associations of CYT score and CD8A, CD4 or FCGR3A (CD16A) or FCGR3B expression. Associations between the variables were tested by the Mann–Whitney U-test or Fisher's exact test. On the basis of the CYT score or CD8A expression level, cases were divided into two groups using the minimum p-value approach, which is a comprehensive method to identify the optimal risk separation cut-off point in continuous gene-expression measurements for survival analysis in multiple datasets (18). Five-year recurrence-free survival (RFS) values were plotted according to the Kaplan–Meier method and compared using the log-rank test. Univariate and multivariate analyses were performed using the Cox proportional hazards model to identify independent variables predictive of RFS. Statistical analyses were performed using JMP Pro 13 software (SAS Institute, Cary, NC, USA) and R version 3.3.1 (The R Foundation for Statistical Computing, Vienna, Austria). The differences were considered significant when the p-Value was <0.05.
Results
The CYT scores in various cell types. First, to assess the CYT score of NK cells and CD8+ T-cells, the CYT scores of peripheral blood cells were calculated using GSE24759. The heat map of GZMA and PRF1 expression levels and CYT score is illustrated in Figure 1A. The expression level of these ranged from low (blue) to high (pink). The CYT scores of effector CD8+ T cells and mature NK cells were higher than those of other blood cells (Figure 1A). Second, to confirm that the CYT scores of HCC cell lines were lower than those of hematological malignancies, the CYT scores of cancer cell lines were calculated with CCLE. The CYT scores of cell lines from solid tumors, including liver tumors, were significantly lower than the CYT scores of hematological malignancy cells (p<0.001) (Figure 1B).
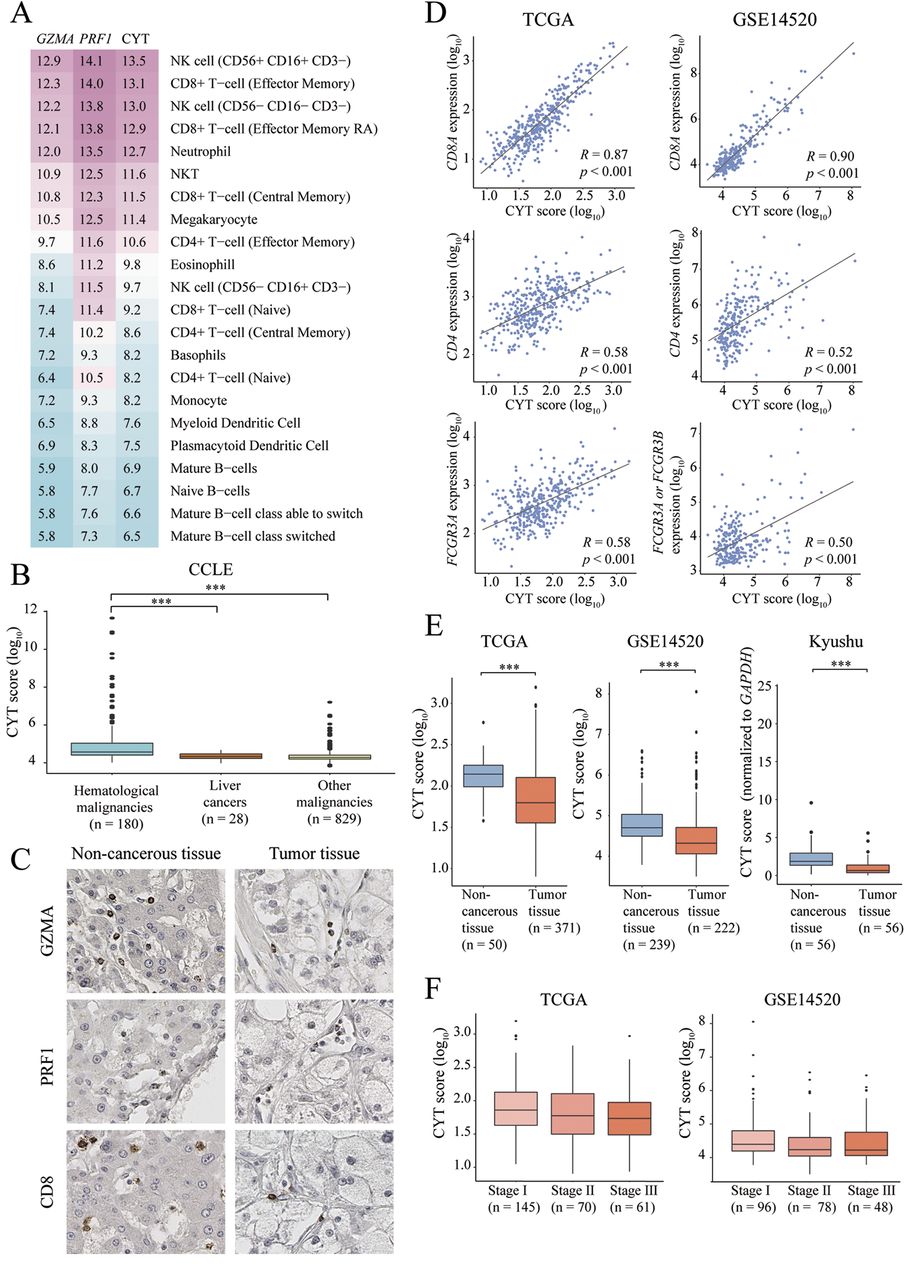
CYT scores of various cells and tissues. (A) Heatmap of GZMA, PRF1 and CYT scores of peripheral blood cells from GSE24759. (B) Boxplot of CYT scores in cell lines in the CCLE dataset. (C) Immunohistochemical staining for GZMA, PRF1 and CD8 in non-cancerous liver tissues (left) and HCC tissues (right). Original magnification; ×200. (D) The CYT score is positively correlated with CD8A, CD4 and FCGR3A or FCGR3B in TCGA and GSE14520 cohorts. (E) The CYT scores of HCC tissues were lower than those of non-cancerous tissues. (F) There was no significant difference in CYT scores among different stages of HCC. ***p<0.001.
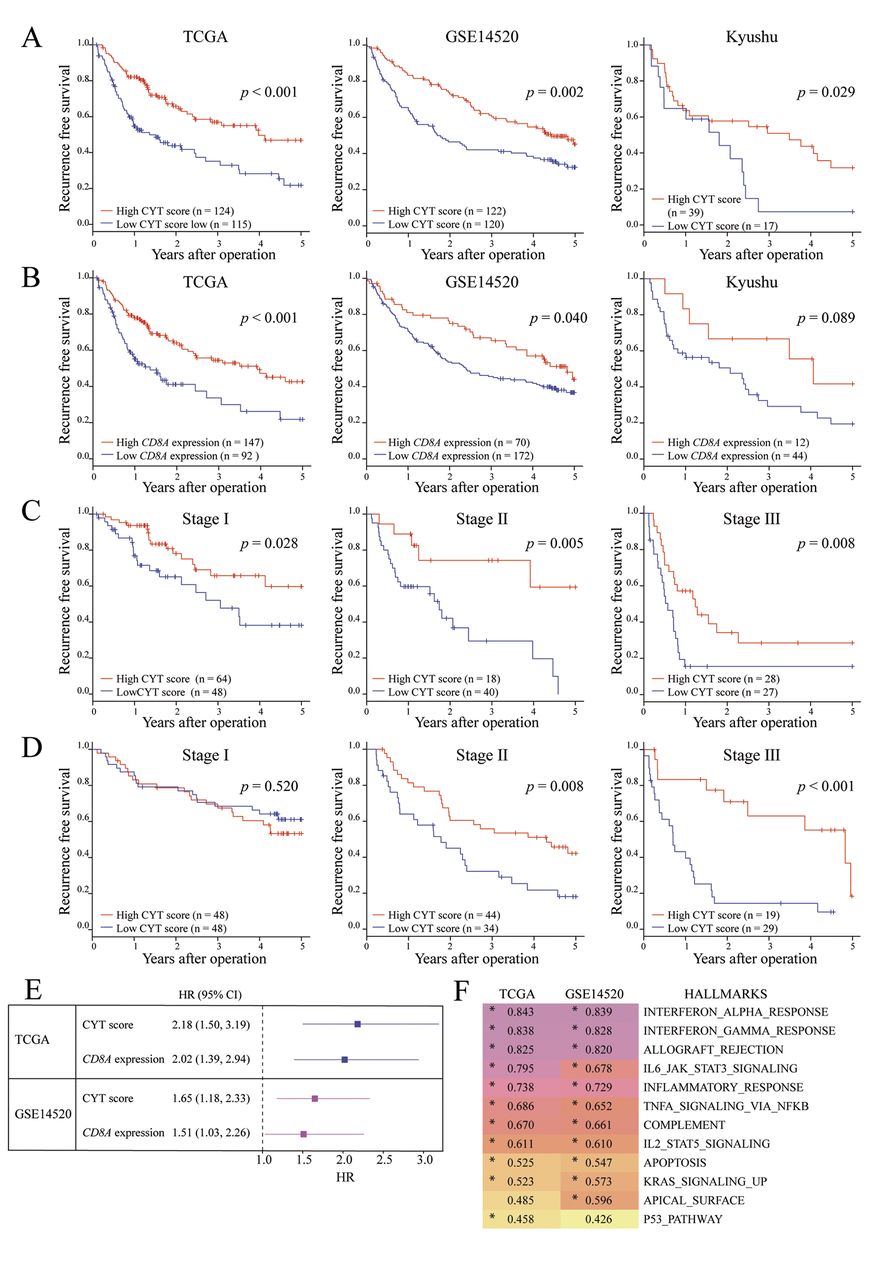
CYT score levels predicted RFS in patients with HCC. (A) Kaplan–Meier RFS curve based on CYT score in 3 independent datasets of HCC. Left, TCGA; middle, GSE14520; right, Kyushu (B) Kaplan–Meier RFS curve based on CD8A expression in 3 independent datasets of HCC. Left, TCGA; middle, GSE14520; right, Kyushu. (C) Kaplan–Meier RFS curve based on CYT scores according to cancer stages in TCGA. (D) Kaplan–Meier RFS curve based on CYT scores according to cancer stages in GSE14520. (E) Forest plot of hazard ratio (HR) and 95% CI for 5-year RFS of CYT score or CD8A expression. (F) Heatmap showing the maximum enrichment score (ES) for the significantly correlated Hallmark gene sets in TCGA and GSE14520. Star indicates gene set is significantly correlated with CYT score (FWER p<0.05).
Univariate and multivariate analyses of prognostic factors for RFS of HCC patients.
The CYT scores in HCC tissues reflected the number of TILs. To confirm the presence and location of GZMA and PRF1 proteins in HCC tissues and non-cancerous tissues, IHC staining was performed. GZMA and PRF1 were stained only in lymphocytes (Figure 1C). Next, to assess the association of CYT scores with the expression levels of surface markers of lymphocytes, Pearson's correlation coefficient of CYT score and CD8A, CD4, and FCGR3A (CD16A) expression levels was performed. There were significantly positive correlations between the CYT score and CD8A expression (TCGA; R=0.87, GSE14520; R=0.90), CD4 expression (TCGA; R=0.58, GSE14520; R=0.52) and FCGR3A (CD16A) expression, which is present on mast cells, macrophages, and NK cells as a transmembrane receptor (TCGA; R=0.58, GSE14520; R=0.50) (Figure 1D). These findings suggest that the CYT score of HCC is associated with the quantity and quality of TILs.
The CYT score in HCC tissues. First, qRT-PCR of GZMA and PRF1 levels was conducted and CYT scores were calculated in tumor tissues and paired non-cancerous liver tissues from 56 HCC patients from our Hospital in Kyushu. Second, to clarify the difference between the CYT scores in tumor tissues and non-cancerous liver tissues, the CYT scores in TCGA, GSE14520 and Kyushu cohorts was calculated. CYT scores in tumor tissues were significantly lower than those of non-cancerous liver tissues in 3 HCC datasets (p<0.001) (Figure 1E). There was no significant difference in the CYT scores between different stages of HCC (Figure 1G). These results suggest that TILs in HCC tissues were fewer in number than those in non-cancerous liver tissues.
Relationship between clinicopathological factors and the CYT score in patients with HCC.
Prognostic significance of CYT score in HCC patients. In HCC, some studies have concluded that the presence of infiltrating CD8+ T-cells was associated with favorable outcomes (19, 20). Thus, we investigated the clinical significance of the CYT score and CD8A expression and clarified which was a more effective biomarker. Towards that end, RFS rates in TCGA, GSE14520 and Kyushu HCC cohorts were assessed using the CYT scores and CD8A expression. The cut-off values for the high and low CYT score groups were 1.78 (log10 expression) in the TCGA dataset, 4.32 (log10 expression) in the GSE14520 dataset and 0.41 (CYT score/GAPDH expression) in the Kyushu HCC set. The cut-off values for high and low CD8A expression groups were 1.56 (log10 expression) in the TCGA dataset, 4.80 (log10 expression) in the GSE14520 dataset, and 4.01 (CD8A expression/GAPDH expression) in the Kyushu HCC set. In the 3 cohorts, the 5-year RFS in the group with the low CYT score was significantly poorer than that in the high CYT score group (Figure 2A). In addition, the 5-year RFS in the group with low CYT scores was significantly poorer than those in the high CYT score group among different stages except for Stage I of GSE14520 (Figure 2C). On the other hand, the 5-year RFS in the group with low CD8A expression was significantly poorer than that in the high CD8A expression group in the TCGA and GSE14520 datasets (Figure 2B). The hazard ratio (HR) for 5-year RFS of CYT scores (low/high) was higher than that of CD8A expression (low/high) (Figure 2E). In addition, multivariate analysis demonstrated that a low CYT score was an independent prognostic factor of poor outcome in the TCGA and GSE14520 cohorts (TCGA; HR=2.14, p<0.001, GSE14520; HR=1.70, p=0.002) (Table I). Serum AFP level was not a prognostic factor in GSE14520.
Clinicopathological characteristics of CYT score in patients with HCC. Clinicopathological analysis of TCGA, GSE14520 and our dataset revealed that low CYT scores were correlated only with non-alcoholic fatty liver disease (NAFLD) (p<0.05) (Table II).
Correlation between CYT score and immune-related gene sets. To validate the association of CYT scores with HALLMARK gene sets, GSEA was applied to the GSE14520 and TCGA datasets. GSEA revealed a positive correlation between the CYT score and many immune-related gene sets (Figure 2F).
Discussion
In this study, CYT scores of HCC tissues were shown to be lower than those of non-cancerous tissues and a low CYT score was associated with poor outcome regardless of its stage. To the best of our knowledge, this is the first study to clarify the clinical significance of the CYT score in HCC.
In peripheral blood cells, the CYT scores of effector CD8+ T cells and mature NK cells were higher than those of other blood cells, and GZMA and PRF1 were expressed only in lymphocytes in non-cancerous tissues and HCC tissues (Figure 1A and C). In addition, the CYT score was positively correlated with the expression of surface markers of lymphocytes (Figure 1D). Moreover, the CYT scores of liver cancers were significantly lower than those of hematological malignancies (Figure 1B). GSEA showed that immune-related gene sets were significantly enriched in HCC cases exhibiting high CYT score (Figure 2F). These results suggest that the CYT score could reflect immune activity in HCC tissues.
In our study, the CYT score of HCC tissues was found to be lower than that of non-cancerous tissues (Figure 1E). However, there was no significant difference in the CYT scores between different stages of HCC (Figure 1F). Moreover, our clinicopathological analysis showed that low CYT scores were associated only with NAFLD, which is a precancerous stage of liver malignancy (Table II). These data suggested that a low CYT score could be a risk factor of HCC.
Our prognostic analysis showed that low CYT scores were associated with a poor outcome in 3 of the HCC datasets (TCGA, GSE14520 and Kyushu) (Figure 2A). Furthermore, a low CYT score was an independent prognostic factor of RFS in TCGA and GSE14520 cohorts, and this prognostic impact persisted even after adjusting for tumor stage, except for stage I in the GSE14520 dataset (Table I, Figure 2C and D). Low CYT score may represent a promising biomarker for predicting the prognosis of HCC, even at the early stages of disease.
Interestingly, we observed that the HR for the 5-year RFS of CYT score (low/high) was higher than that of CD8A expression levels (low/high) in HCC in TCGA and GSE14520 (Figure 2E). Thus, CYT score may be a more meaningful biomarker than CD8A expression in HCC. It is possible that the CYT score was affected by not only CD8+ T-cells but also by other lymphocytes such as NK cells and CD4+ T-cells.
Recently, the Food and Drug Administration approved nivolumab, which is the monoclonal antibody against programmed cell death-1 (PD-1), for HCC patients (5). However, not all patients respond to PD-1 inhibitors and there is no valid biomarker for the response of HCC patients to PD-1 inhibitors. Given these hurdles, there remains an urgent need for further exploration for more reliable treatment selection biomarkers. The CYT score could be a predictive biomarker for checkpoint inhibitors.
In conclusion, our findings suggest that the CYT score is a novel prognostic biomarker in HCC, possibly through reflecting host immune status.
Acknowledgements
The Authors thank K. Oda, M. Kasagi, M. Sakuma, N. Mishima, T. Kawano and J. Takano for their technical assistance. This work was supported in part by the following grants and foundations: Japan Society for the Promotion of Science (JSPS) Grant-in-Aid for Science Research (Grant Numbers JP16K07177, JP16K10543, JP16K19197, JP16K19832, JP17K16454, JP17K16521, JP17K10593, JP17K19608 and JP18K07755); OITA Cancer Research Foundation; Daiwa Securities Health Foundation; Grant-in-Aid for Scientific Research on Innovative Areas (15H0912); Priority Issue on Post-K computer (hp170227) (hp170227, hp160219); JSPS KAKENHI (15H05707); Eli Lilly Japan K.K. Grant; Japanese Foundation for Multidisciplinary Treatment of Cancer.
Footnotes
Conflicts of Interest
None of the Authors has any conflict of interest to disclose.
- Received October 26, 2018.
- Revision received November 5, 2018.
- Accepted November 6, 2018.
- Copyright© 2018, International Institute of Anticancer Research (Dr. George J. Delinasios), All rights reserved


