


Article Figures & Data
Figures
- Figure 1.
Genotoxic (a) and antigenotoxic (b) effects of fermentation supernatants (FS, 2.5 and 5%) of raw and roasted hazelnuts (RC1=140.6°C/25 min, RC2=155.1°C/20 min and RC3=180.4°C/21 min) and controls (blank, Synergy1®) for 1 h in LT97 colon adenoma cells (mean+SD, n=3). Significant differences between FS from raw and roasted hazelnuts as well as Synergy1® and the positive control (PC, 75 μM H2O2, *p≤0.05, **p≤0.01, ***p≤0.001), the negative control (NC, PBS, ap≤0.05) and the blank control (#p≤0.05, ##p≤0.01) were obtained by two-way Anova/Bonferroni post-test.
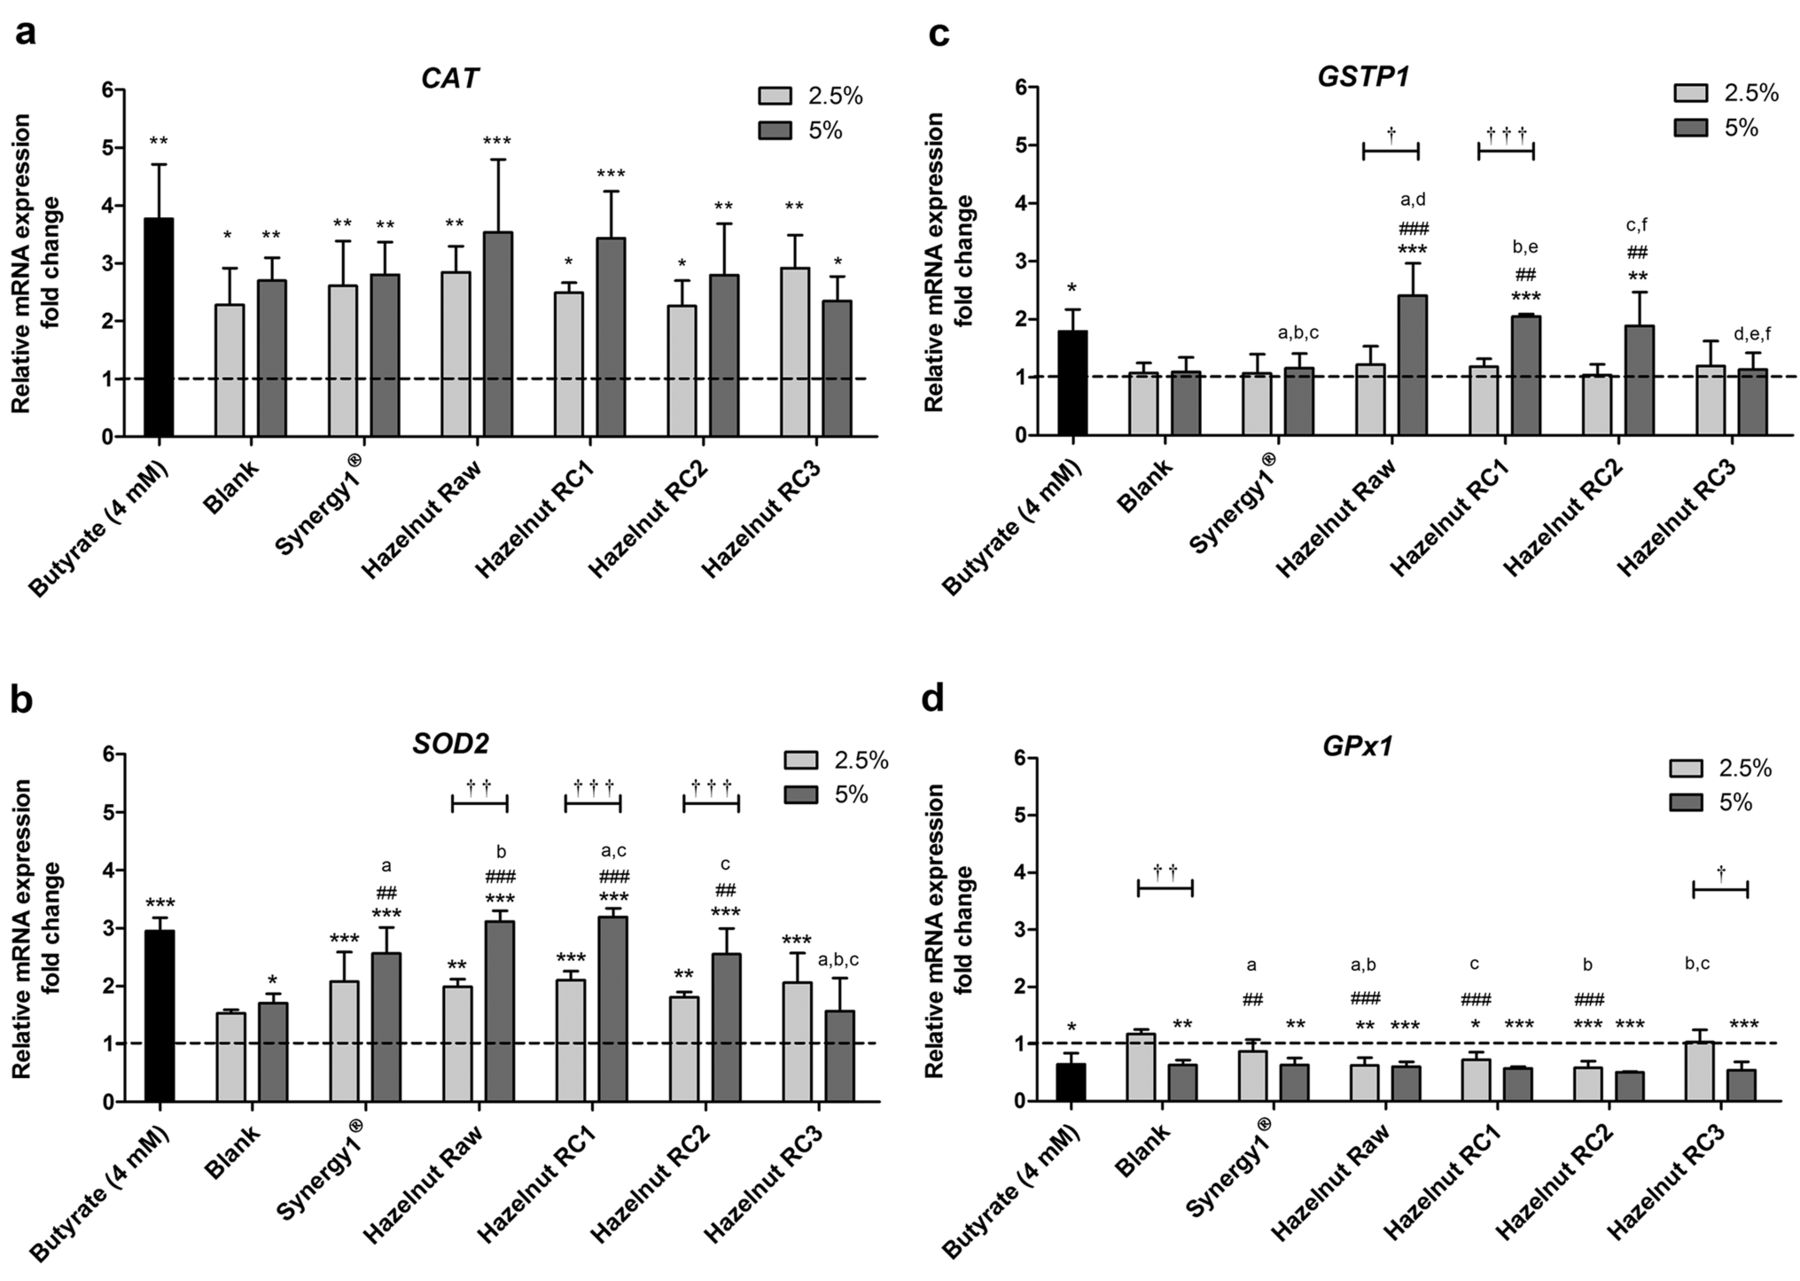
- Figure 2.
Relative mRNA expression of a) CAT (catalase), b) SOD2 (superoxide dismutase 2), c) GSTP1 (glutathione S-transferase P1), and d) GPX1 (glutathione peroxidase 1) in LT97 colon adenoma cells after incubation with fermentation supernatants (FS, 2.5 and 5%) of raw and roasted hazelnuts (RC1=140.6°C/25 min, RC2=155.1°C/20 min and RC3=180.4°C/21 min) and controls (4 mM butyrate, blank, Synergy1®) for 24 h (mean+SD, n=3). Values represent fold changes on the basis of a medium control (set as 1, dashed line). Significant differences compared to the medium control (*p≤0.05, **p≤0.01, ***p≤0.001), to the blank control (##p≤0.01, ###p≤0.001) and between FS (a-fp≤0.05, equal letters represent significant differences) were obtained by two-way Anova/Bonferroni post-test. Significant differences between 2.5 and 5% were obtained by unpaired Student's t-test (†p≤0.05, ††p≤0.01, †††p≤0.001).
- Figure 3.
Growth inhibition of LT97 colon adenoma cells after incubation with fermented samples of raw and roasted hazelnuts (RC1=140.6°C/25 min, RC2=155.1°C/20 min and RC3=180.4°C/21 min) and controls (blank, Synergy1®) in concentrations of 2.5-20% for a) 24 h, b) 48 h, and c) 72 h (mean±SD, n=3). Significant differences between blank and fermentation supernatants (FS) of Synergy1® or hazelnuts (#p≤0.05, ##p≤0.01, ###p≤0.001) were obtained by two-way Anova/Bonferroni post-test. Significant differences between different concentrations (**p≤0.01, ***p≤0.001) were obtained by one-way Anova/Bonferroni post-test. All fermentation samples were significantly different compared to the medium control which was set to 100% (dashed line).
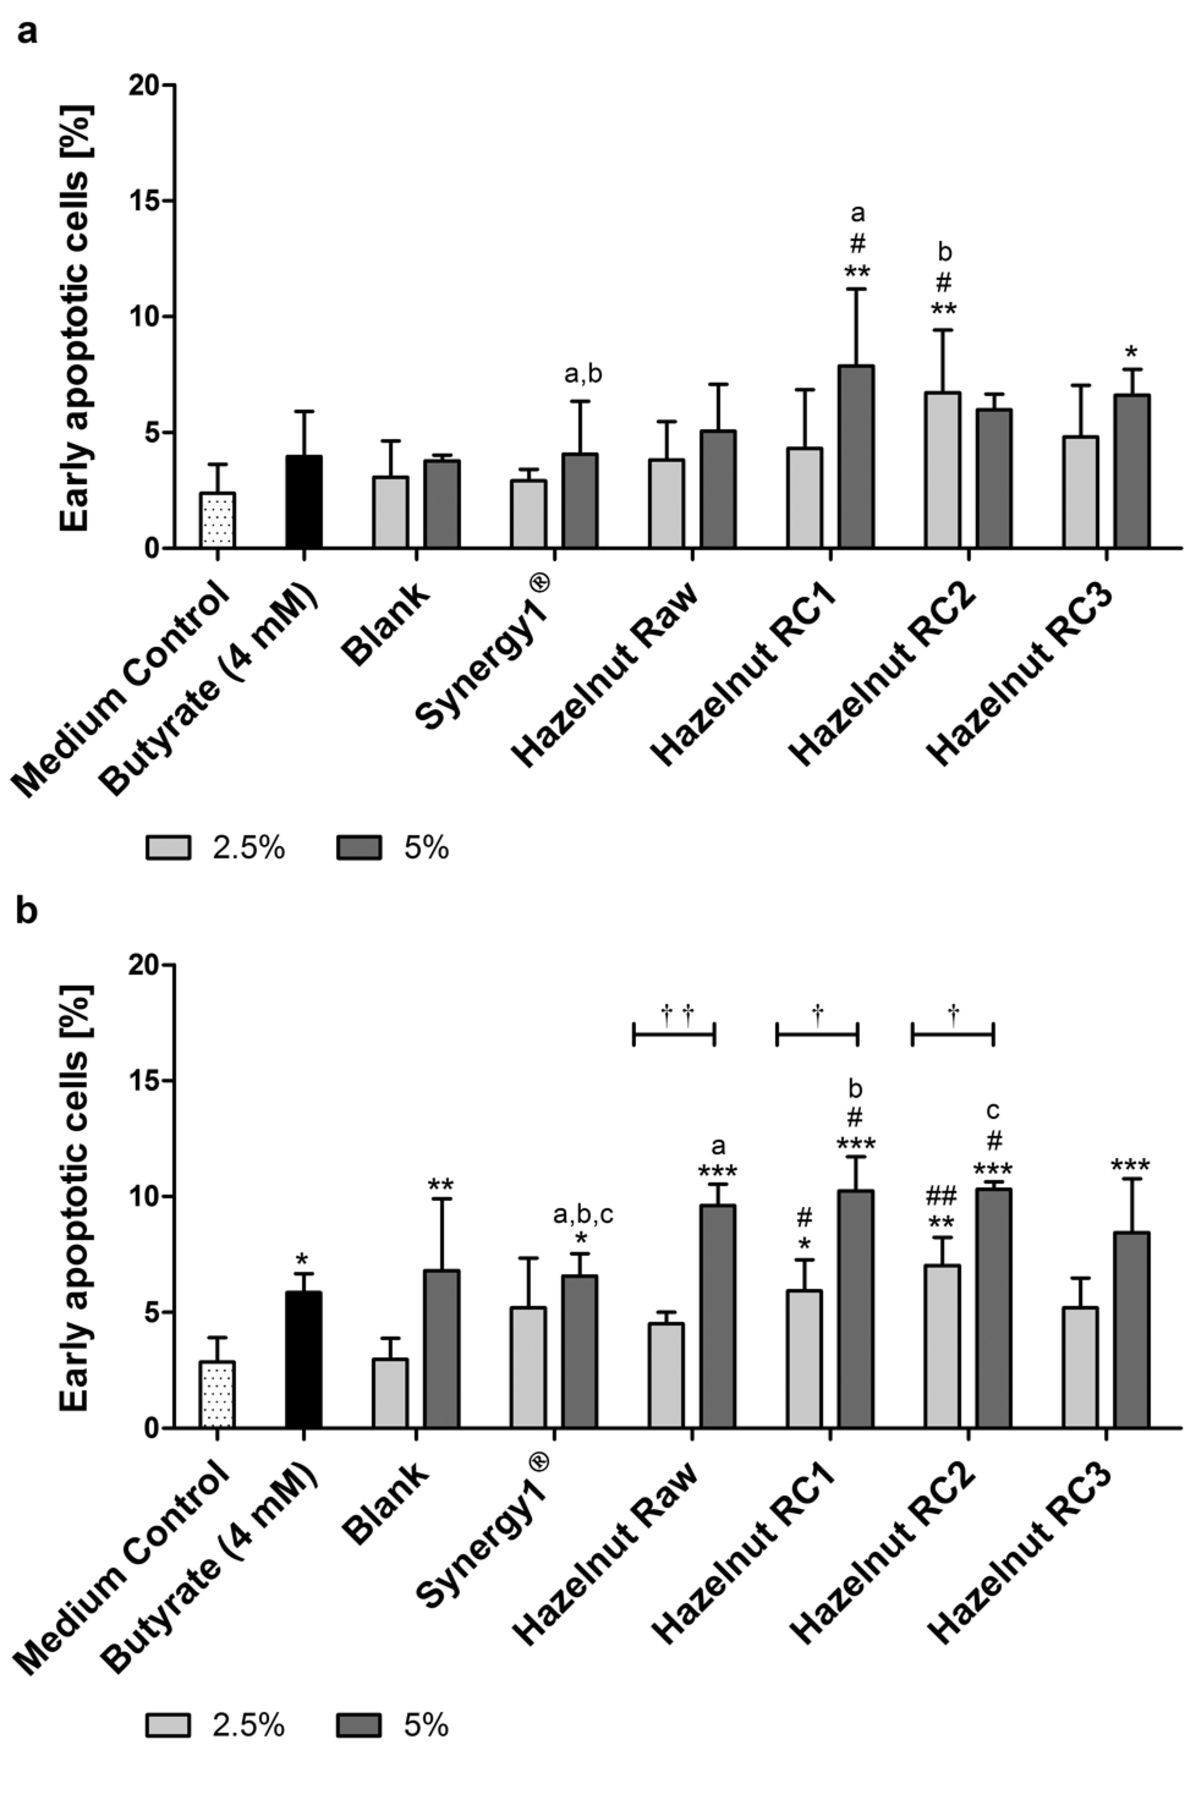
- Figure 4.
Number of early apoptotic LT97 cells in percent after incubation with fermentation supernatants (FS, 2.5 and 5%) of raw and roasted hazelnuts (RC1=140.6°C/25 min, RC2=155.1°C/20 min and RC3=180.4°C/21 min) and controls (4 mM butyrate, Synergy1®, blank) for a) 12 h and b) 24 h (mean+SD, n=3). Significant differences compared to the medium control (*p≤0.05, **p≤0.01, ***p≤0.001), to the blank control (#p≤0.05, ##p≤0.01) and between FS (a-cp≤0.05, equal letters represent significant differences) were obtained by two-way-Anova/Bonferroni post-test. Significant differences between 2.5 and 5% were obtained by unpaired Student's t-test (†p≤0.05, ††p≤0.01).
- Figure 5.
Caspase-activity in LT97 cells after incubation with fermentation supernatants (FS, 2.5 and 5%) of raw and roasted hazelnuts (RC1=140.6°C/25 min, RC2=155.1°C/20 min and RC3=180.4°C/21 min) and controls (4 mM butyrate, Synergy1®, blank) for a) 24 h and b) 48 h (mean+SD, n=3). Values represent fold changes on the basis of a medium control (set as 1, dashed line). Significant differences compared to the medium control (*p≤0.05, **p≤0.01, ***p≤0.001), to the blank control (#p≤0.05, ###p≤0.001) and between FS (a-cp≤0.05, equal letters represent significant differences) were obtained by two-way Anova/Bonferroni post-test. Significant differences between 2.5 and 5% were obtained by unpaired Student's t-test (†p≤ 0.05, ††p≤0.01).


In this issue


Jump to section
Related Articles
Cited By...
- No citing articles found.