


Article Figures & Data
Figures
- Figure 1.
Sphingosine inhibited growth and caused death of RH30 and RH18 cells. A: Sub-confluent RH30 cells were cultured with sphingosine at 0 (○), 1 (●), 2.5 (▿), 5 (▾), 10 (□), and 15 μM (▪) for 1, 3, and 5 days. B: Sub-confluent RH18 cells were cultured with sphingosine at 0 (○), 1 (●), 2.5 (▿), 3.5 (⋄), 5 (▾), and 10 μM (□) for 1, 3, and 5 days. *Means at each time of cells treated with sphingosine at 2.5 to 15 μM differed significantly from the corresponding controls at p<0.001 by two-way ANOVA. C, D: For determination of the half-maximal inhibitory concentration (IC50), RH30 cells (C) and RH18 cells (D) were cultured with sphingosine at different concentrations (1 to 15 μM) for 24 h. *Significantly different at p<0.001 by one-way ANOVA compared to the corresponding control and different sphingosine concentrations. Total nucleic acids were measured as an index of cell number and results are expressed as a percentage of the quantity at zero hour (mean±SEM, n=3, except n=6 for time zero). Where an error bar is not seen, it lies within the dimensions of the symbol.
- Figure 2.
Sphingosine induced cell death in RH30 and RH18 cells. Sub-confluent RH30 and RH18 cells were cultured in the absence (Ctr) or the presence of 5 μM or 3.5 μM sphingosine (SO), respectively, for 12 h and were stained with propidium iodide (PI). Dead cells were identified as the PI-positive cell population using flow cytometric analysis (mean±SEM, n=2).
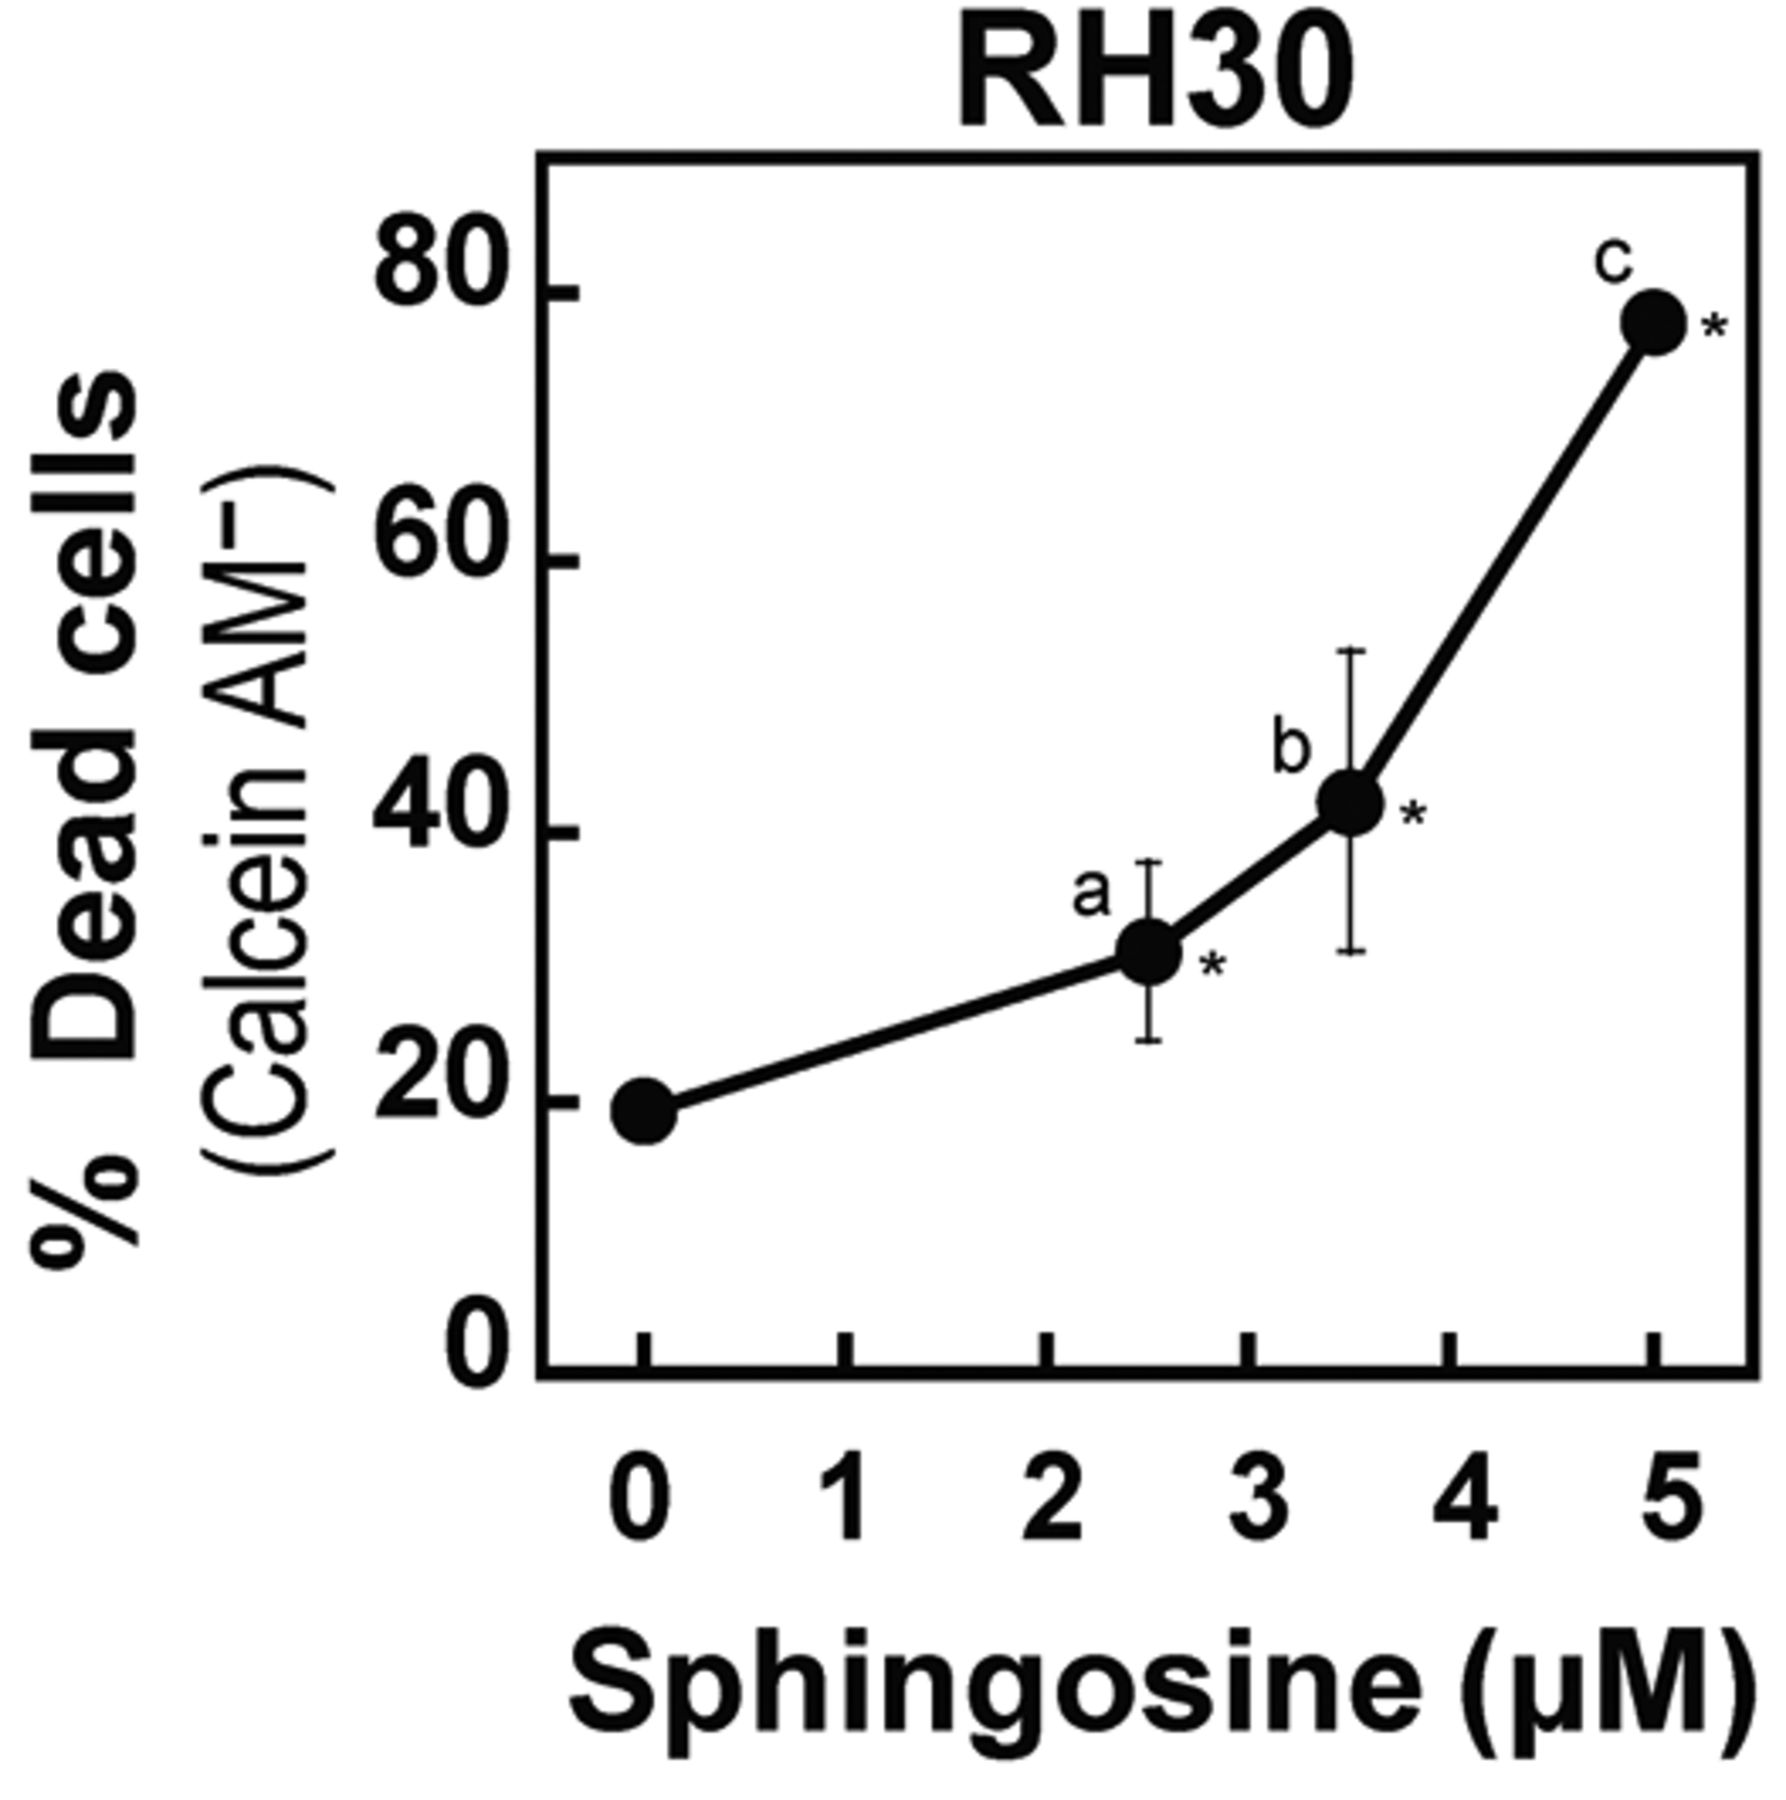
- Figure 3.
Sphingosine induced cell death in RH30 cells. Sub-confluent cells were cultured with sphingosine at different concentrations (2.5, 3.5, and 5 μM) for 12 h and were stained with calcein AM. The percentage of dead cells (calcein AM-negative population) was determined via flow cytometric analysis (mean±SEM, n=3). *Significantly different from the control at p<0.025 by one-way ANOVA. Different superscript letters (a, b, c) indicate significant differences between sphingosine concentrations. Where an error bar is not seen, it lies within the dimensions of the symbol.
- Figure 4.
Sphingosine induced apoptosis of RH30 and RH18 cells. Sub-confluent RH30 and RH18 cells were cultured in the absence (Ctr) or the presence of 5 μM or 3.5 μM sphingosine (SO), respectively, for 12 h and were stained with annexin V (Annx). Apoptotic cells were identified as the annexinV-positive cell populations (Annx+) with flow cytometry (mean±SEM n=2). Where an error bar is not seen, it lies within the dimensions of the symbol.
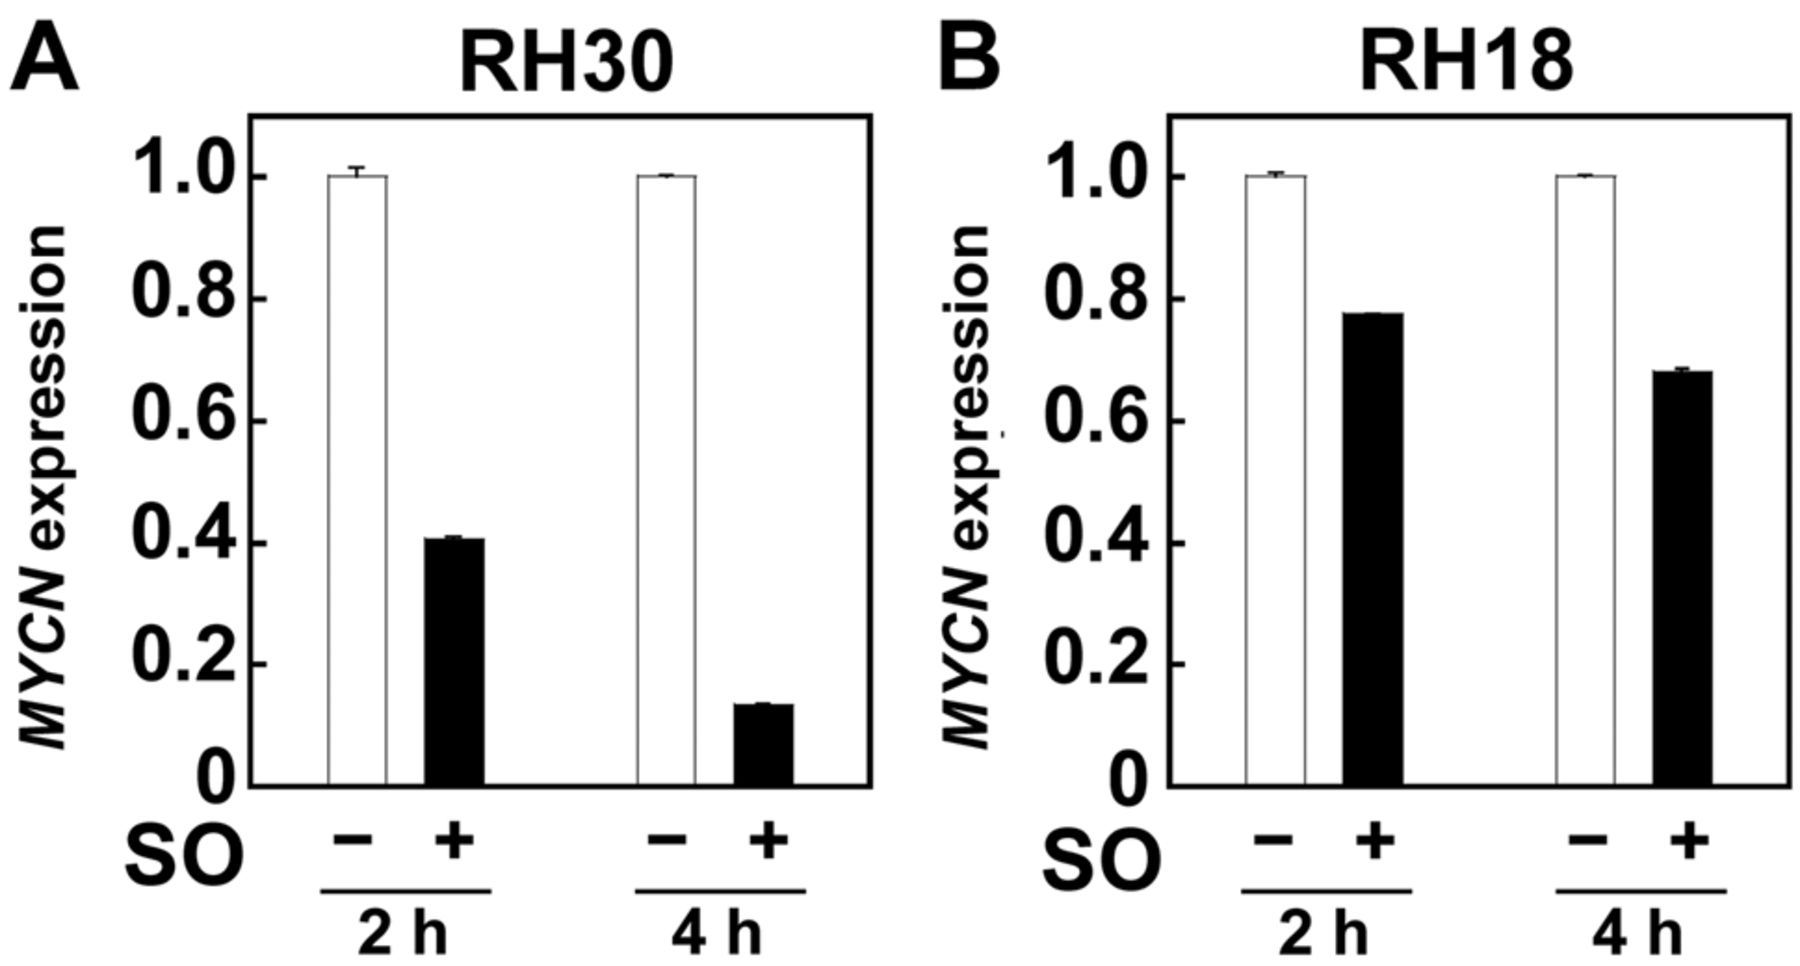
- Figure 5.
Sphingosine down-regulated the expression of MYCN in RH30 and RH18 cells. Sub-confluent RH30 and RH18 cells were cultured with and without sphingosine (SO) at 3.5 μM and 2.5 μM, respectively, for 2 and 4 h. Total mRNA was isolated and the expression of MYCN gene was determined using Taqman real-time quantitative polymerase chain reaction. The relative expression levels of MYCN gene were normalized by 18S rRNA as an endogenous control transcript. Data represent fold changes normalized to the corresponding control at specific times (mean±SD, n=3 for A; n=6 for B). Where an error bar is not seen, it lies within the dimensions of the symbol.


