


Abstract
Aim: This study aimed to clarify the predictive impact of visceral fat on response to bevacizumab in patients with metastatic colorectal cancer (mCRC). Patients and Methods: Pretreatment computed tomography was used to measure visceral fat area (VFA) and patients with mCRC receiving first-line chemotherapy with/without bevacizumab were divided by median VFA value into two groups: high VFA and low VFA. Results: In the bevacizumab-treated group, patients with low VFA had significantly shorter overall survival (OS) than patients with high VFA in univariate (median=21.1 vs. 38.9 months; hazard ratio=1.70, 95% confidence interval=1.06-2.70, p=0.03) and multivariate analysis (hazard ratio=1.85, 95% confidence interval=1.15-3.03, p=0.01). No significant differences were seen in OS between groups treated with chemotherapy alone. The VFA had a marginally significant modifying effect on the relationship between bevacizumab and OS (p for interaction=0.07). Conclusion: Our findings provide the first evidence that a low VFA might be a negative predictive marker for response to bevacizumab in patients with mCRC.
The monoclonal antibody bevacizumab, an anti-vascular endothelial growth factor (VEGF) targeted drug, has become standard therapy for patients with metastatic colorectal cancer (mCRC) (1, 2). The addition of bevacizumab to cytotoxic drugs has significantly improved survival, however, the benefits of this drug in an unselected patient population are relatively modest (3). This has encouraged us to identify predictive biomarkers for response to bevacizumab in patients with mCRC (4-7).
Several studies have demonstrated that visceral obesity might be a negative predictive factor in patients with various cancer types receiving bevacizumab-based treatment (8-10). Excess visceral adipose tissue promotes cancer development and progression through increased secretion of pro-inflammatory and angiogenic cytokines (11-13). More recent development in computed tomography (CT) provides accurate measurement of visceral fat area (VFA) (14). On the other hand, Steffens et al. reported that renal cell carcinoma patients with low VFA had significantly worse survival outcomes compared to those with high VFA (15). A low visceral fat content possibly represents cachexia status but may also contribute to tumor angiogenesis through systemic inflammation (16).
Accordingly, we performed the current study to investigate the association between visceral fat status and response to bevacizumab in patients with mCRC by a retrospective analysis of five prospective phase II trials. The aim of this study was to evaluate whether visceral fat status can be a predictive marker of response to bevacizumab-based therapy for patients with mCRC.
Patients and Methods
Data source. This analysis was conducted on a database of patients with mCRC prospectively enrolled in five phase II clinical trials [KSCC0501 (17), KSCC0701 (18), KSCC0801 (19), KSCC0802 (20), and KSCC0902 (21)]. We evaluated data from patients with mCRC who received first-line treatment with standard chemotherapy or standard chemotherapy plus bevacizumab. Eligibility criteria of all clinical trials included histologically confirmed CRC and measurable metastatic disease according to Response Evaluation Criteria in Solid Tumours (RECIST) (22); no previous exposure to systemic chemotherapy for metastatic disease; age 20 to 75 years; Eastern Cooperative Oncology Group Performance Status (EOCG-PS) 0 to 2; and adequate organ functions. In the KSCC0802 study, patients with liver-limited mCRC (including patients with five or more metastases or with maximum tumor diameter greater than 5 cm) were enrolled to evaluate liver resectability after first-line treatment. All patients who did not undergo evaluable computed tomographic (CT) scans of the abdomen and pelvis before treatment were necessarily excluded from the analysis. Patients with bowel obstruction or ascites were also excluded because visceral fat could not be evaluated accurately in these patients.
Treatment plan. In KSCC0501, patients received the FOLFOX4 regimen of oxaliplatin (85 mg/m2) on day 1, bolus 5-fluorouracil (5-FU; 400 mg/m2), and leucovorin (200 mg/m2), 22-hour infusion of 5-FU (600 mg/m2) on days 1 and 2 of every 2-week cycle. In KSCC0802, patients received mFOLFOX6 plus bevacizumab regimen of oxaliplatin (85 mg/m2), bolus 5-FU (400 mg/m2), and leucovorin (200 mg/m2) and bevacizumab (5 mg/kg) on day 1, followed by 46-h infusion of 5-FU (2,400 mg/m2) on day 1 of every 2-week cycle. In KSCC0701, patients received an alternating regimen with four cycles of mFOLFOX6 followed by four cycles of FOLFIRI (150 mg/m2 irinotecan was substituted for oxaliplatin on day 1). In KSCC0801, patients received a regimen of FIREFOX plus bevacizumab consisting of four cycles of mFOLFOX6 plus bevacizumab (5 mg/kg) followed by four cycles of FOLFIRI plus bevacizumab (5 mg/kg). In KSCC0901, patients received a XELOX plus bevacizumab regimen of oxaliplatin (130 mg/m2) and bevacizumab (7.5 mg/kg) on day 1 and capecitabine (2,000 mg/m2) on days 1-14 of every 3 weeks with leucovorin (400 mg/m2) and continuous infusion of 5-FU (600 mg/m2) on days 1 and 2 of every 2-week cycle. Treatment with each chemotherapy regimen was continued until disease progression or prohibitive toxicity, with the exception of KSCC0802, in which patients who were amenable to curative resection after six cycles of mFOLFOX6 plus bevacizumab underwent liver resection. All patients provided written informed consent prior to enrolment.
Quantification of VFA, subcutaneous fat area (SFA), and waist circumference (WST). The VFA, SFA, and WST were measured retrospectively on CT scans performed before treatment at the level of the umbilicus with the patient in the supine position (Figure 1a). Briefly, we used the Volume Analyzer SYNAPSE VINCENT 3D image analysis system (FUJIFILM Medical, Tokyo, Japan) to measure pixels using a window width of −190 to −30 HU to delineate the subcutaneous and visceral compartments and to compute the cross-sectional area of each in cm2. All measurements and calculations were performed twice by a trained examiner (Y.M.) who was blinded to the treatment outcomes at the time of quantification. Comparisons of fat area for intra-observer agreement yielded a Lin's concordance correlation coefficient of 0.962 [95% confidence interval (CI)=0.951-0.971].
Response and survival analysis. The objective response rate (ORR) was assessed by RECIST. Overall survival (OS) was defined as the time from the first day of chemotherapy to death (all causes). Survivors were censored at last follow-up. Progression-free survival (PFS) was defined as the time from the first day of chemotherapy to the first recorded evidence of progression or death (all causes). Survivors without evidence of disease progression or those who underwent curative resection of metastatic sites were censored at last follow-up.
Analysis of study populations. The present analysis evaluated the association between treatment outcome (ORR, PFS, OS) and obesity-related factors [VFA, SFA, WST, and Body Mass Index (BMI)]. Patients were divided into two groups according to their percentiles of each obesity-related factor. This study was conducted adhering to the REporting recommendations for tumor MARKer prognostic studies (REMARK). Study protocols were approved by the institutional review boards of Kumamoto University (No. 653) and conducted in accordance with the Declaration of Helsinki and Ethical Guidelines for Clinical Studies.
Statistical analysis. Baseline patient and disease characteristics were summarized using descriptive statistics or contingency tables. The continuous values of the obesity-related factors were divided according to the median into two groups for each variable: VFA (high: ≥79.2 cm2, low: <79.2 cm2), SFA (high: ≥97.7 cm2, low: <97.7 cm2), and WST (high: ≥80.1 cm, low: <80.1 cm). Student's t-test and chi-square test or Fisher's exact test were used to compare means or proportions between groups, respectively. OS and PFS were compared between groups with a log-rank test; hazard ratio (HR) (with 95% CI) were calculated with the Cox model. Survival curves were estimated using the Kaplan–Meier method. We constructed the multivariate Cox proportional hazards model to estimate the HR for the obesity-related factors (VFA, SFA, WST and BMI) adjusting for the potential baseline confounders; sex (male vs. female), age at treatment (<63 vs. ≥63 years, median), EOCG-PS (grade 0 vs. 1/2), tumor location (colon vs. rectum), and primary tumor (resected vs. unresected). We also carried out the multivariate logistic regression analysis to estimate the odds ratio for the ORR (responder/non-responder) adjusting for the confounders described above. Test of interaction was conducted by including the cross product of the bevacizumab variable and another variable of interest in a univariate proportional hazard model. For all analyses, statistical significance was defined as a two-sided p<0.05. Statistical analyses were performed using R software ver.2.13.1 (http://cran.r-project.org/).
Results
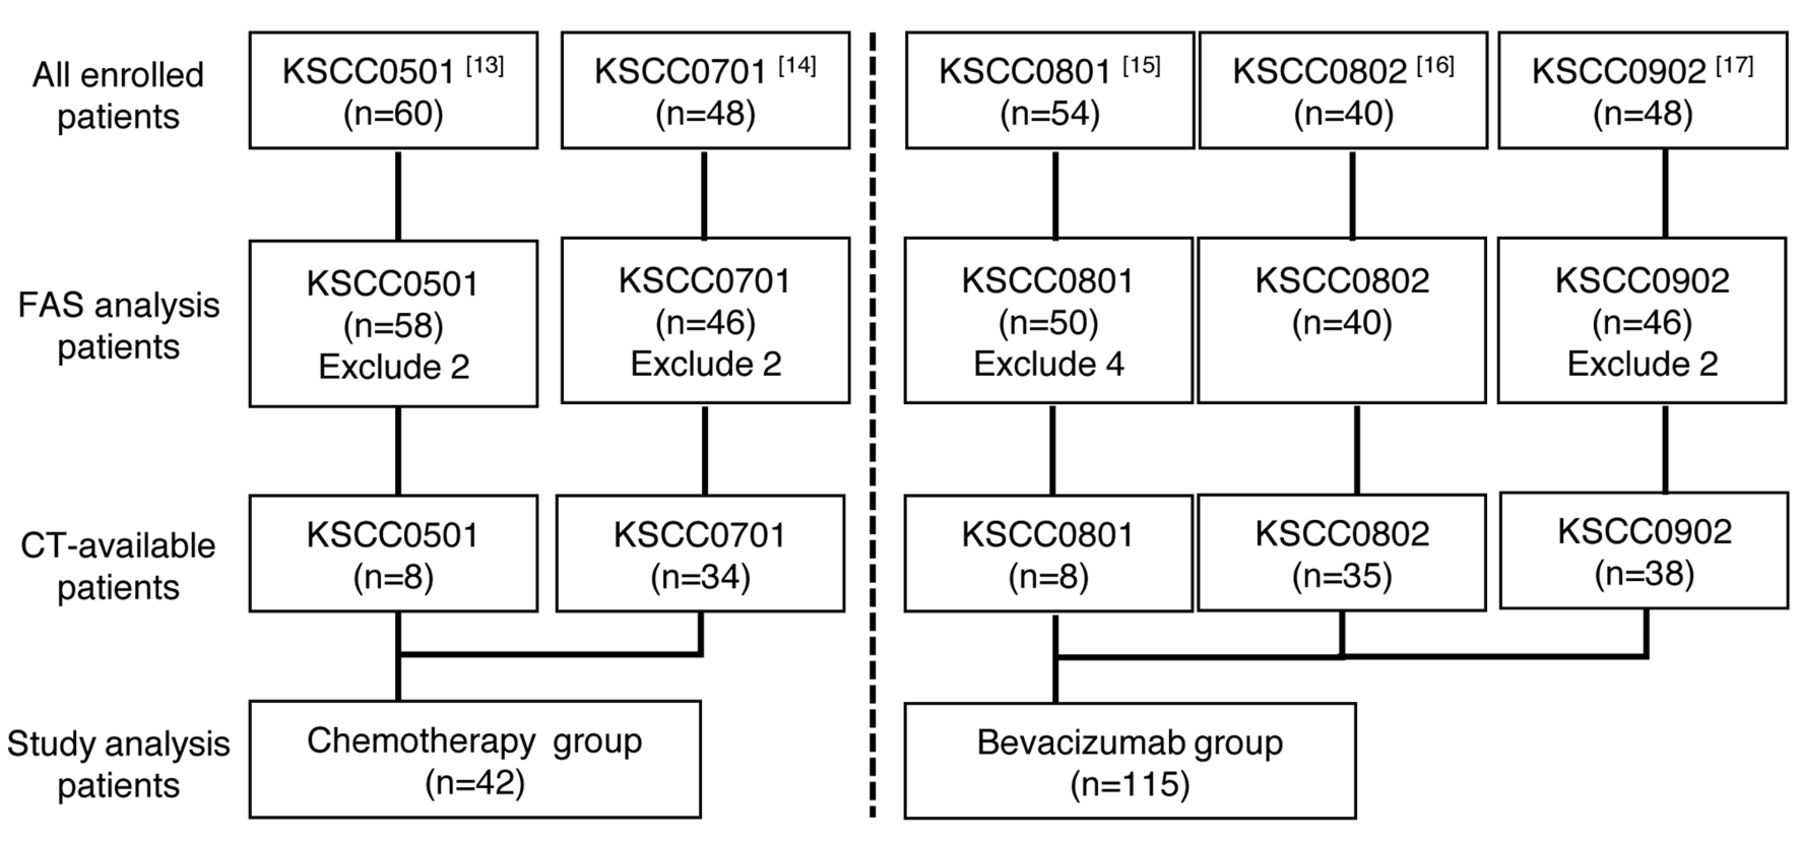
The first-line KSCC trials used in the retrospective analysis of visceral fat are described in Figure 2. In total, 157 patients from five trials with available VFA, SFA, WST, BMI, PFS, and OS data were included in the analyses. The median OS was 33.0 months (95% CI=25.5-36.6 months), and the median PFS was 10.9 months (95% CI=9.6-12.9 months). Median length of follow-up among surviving patients was 29.6 months.

Measurement and distribution of obesity-related factors in colorectal cancer patients. a) Axial computed tomogram slice of the umbilicus level shows highlighted areas of visceral (red) fat and subcutaneous (blue) fat and waist circumference. b-e: Distribution of visceral fat area (VFA), subcutaneous fat area (SFA), waist circumference (WST) and body mass index (BMI) among 157 patients with metastatic colorectal cancer.
The baseline characteristics are shown in Table I. There was no statistically significant difference between the bevacizumab-treated group and the group treated with chemotherapy alone for the main characteristics except for chemotherapy regimens. In addition, there were no significant differences in the mean VFA, SFA, WST, and BMI between the two groups. The VFA in the 157 patients was distributed as follows (Figure 1b-e): mean= 88.0; median=88.3; standard deviation (SD)=52.0; range=5.32-219.7 in male patients; and mean=77.1; median=68.3; SD=48.2; range=14.35-227.7 in female patients.
In the group treated with chemotherapy alone, the ORR was 52.6% in the low VFA group and 63.2% in the high VFA group (p=0.47). According to the log-rank test, there was no significant difference in PFS and OS between the low and high VFA groups (median PF=10.1 vs. 9.4 months, p=0.32; median OS=25.1 vs. 33.6 months, p=0.51) (Figure 3).
In the bevacizumab group, the ORR was 44.6% in the low VFA group and 54.2% in the high VFA group (p=0.30). According to log-rank test, the median PFS for patients in low and high VFA groups was 9.8 and 13.1 months, respectively. There was no significant difference in PFS between the two groups (p=0.59). In contrast, patients in the low VFA group experienced significantly shorter OS (median OS=21.1 vs. 38.9 months; HR=1.70, 95% CI=1.06-2.70, p=0.03) than those in the high VFA group (Figure 3).
Cox multivariate modelling was performed to estimate whether VFA was independently associated with OS. Univariate analysis initially identified an association between low VFA and OS. Subsequent multivariate Cox analysis including age, gender, EOCG-PS, location of primary tumor, primary tumor resection, and VFA identified low VFA as an independent risk factor for OS (HR=1.86; 95% CI=1.15-3.00, p=0.01) (Table II). We further examined whether the association of OS and bevacizumab use was modified by clinical variables, and found a marginally significant modifying effect of VFA on the relationship between bevacizumab and OS (p for interaction=0.07) (Figure 4).

Study design. FAS: Full analysis set in each original study, CT: computed tomography.
Finally, we evaluated the proportion of patients who received second- to fourth-line therapy among VFA groups (Table III). Second-line therapy was administered to 49 (88%) out of 56 patients in the low VFA group and 53 (90%) out of 59 patients in the high VFA group (p>0.99), with a similar proportion of patients in each group treated with chemotherapy only [22/23 (96%) vs. 18/19 (95%), respectively, p>0.99]. The proportion of patients treated with second-line bevacizumab was also similar [27/56 (48%) in the low VFA group and 27/59 (46%) in the high VFA group, p=0.86. Similar results were also observed for third- and fourth-line treatment.
Discussion
In this study, we demonstrated that a low quantity of visceral fat plays a role as a negative predictive marker of OS of bevacizumab-based therapy in patients with mCRC. In the bevacizumab-treated group, OS was shorter in patients with low VFA than in patients with high VFA. In addition, VFA had a marginally significant modifying effect on the relationship between bevacizumab and OS. However, VFA was not significantly associated with OS in the group treated with chemotherapy alone. A summary of previous reports (Table IV) shows that patient adiposity as assessed by BMI or VFA was lower in our study population than that in other study populations. In addition, the prevalence of obesity (BMI ≥30 kg/m2) in Japan is very much lower compared to that in Western countries (23). Therefore, we consider that the low VFA in this study indicates a very lean body type that includes cachexia status. To the best of our knowledge, this is the first study to report that very low visceral fat similar to cachexia status might inhibit the treatment efficacy of bevacizumab for mCRC.
Over the past decades, clinical research has focused on the study of molecular or clinical markers that can predict the activity of bevacizumab for individualized treatment of patients with mCRC. The expression level of VEGF and other angiogenic determinants (24), germline single-nucleotide polymorphisms of VEGF (25), bevacizumab-related arterial hypertension (26), and VEGF splice isoforms (27) have been investigated as potential biomarkers for anti-angiogenic treatment.
Renfro et al. showed that a low BMI to be associated with an increased risk of progression and death among patients enrolled in mCRC trials (28). They concluded that the negative effects were related to cancer cachexia in patients with a low BMI. In this study, worse OS for patients with low VFA compared with those with high VFA was observed only for patients in the bevacizumab-treated group. This suggests that some molecular signaling pathways associated with the cancer cachexia status may inhibit the effects of bevacizumab treatment. Possible explanations include increased expression of VEGF by tumor tissue in cachexia status (29-31); a high level of VEGF might induce inhibition of bevacizumab. In addition, activin, which is a member of the tumor growth factor superfamily, plays an important role in cancer cachexia as a multifactorial cytokine and may regulate angiogenic status in human cancer cells (32). Although VEGF expression is associated with advanced tumor progression and a poor prognosis in patients with colon cancer (33), no factors that predict the response to bevacizumab or conventional chemotherapy have been validated to date. Further studies in this field are therefore required.
Baseline characteristics of patients.
Many investigators have reported that CT-based measurements of body composition, such as an increased amount of visceral fat, might be predictors of survival in patients with colon cancer (34, 35). However, the amount of visceral fat as a predictive marker for treatment effect has rarely been reported. Obtaining a pre-treatment image is important for assessing the effectiveness of chemotherapy, and the amount of visceral fat measured by pre-treatment CT, which is used as the main diagnostic tool, can be a useful predictive marker.
Some limitations should be addressed. Firstly, this was a retrospective study and, secondly, this study included a small number of patients, especially in the group treated with chemotherapy alone as control. In addition, this study showed no difference in PFS between high and low VFA groups. Nonetheless, our findings provide essential information about the correlation between bevacizumab and visceral fat using prospective clinical trial data.

Kaplan–Meier analyses of progression-free survival (a, c) and overall survival (b, d) according to visceral fat area (VFA) in the group treated with chemotherapy plus bevacizumab (a, b) and that treated with chemotherapy only (a, c).
In conclusion, we demonstrated that a low amount of visceral fat might play a role as a negative predictive marker of bevacizumab-based therapy for patients with mCRC. Further studies are necessary to demonstrate clinical effectiveness and impact on the survival of patients with mCRC.
Multivariate analyses of survival outcome and objective response rate according to obesity-related factors and treatment.
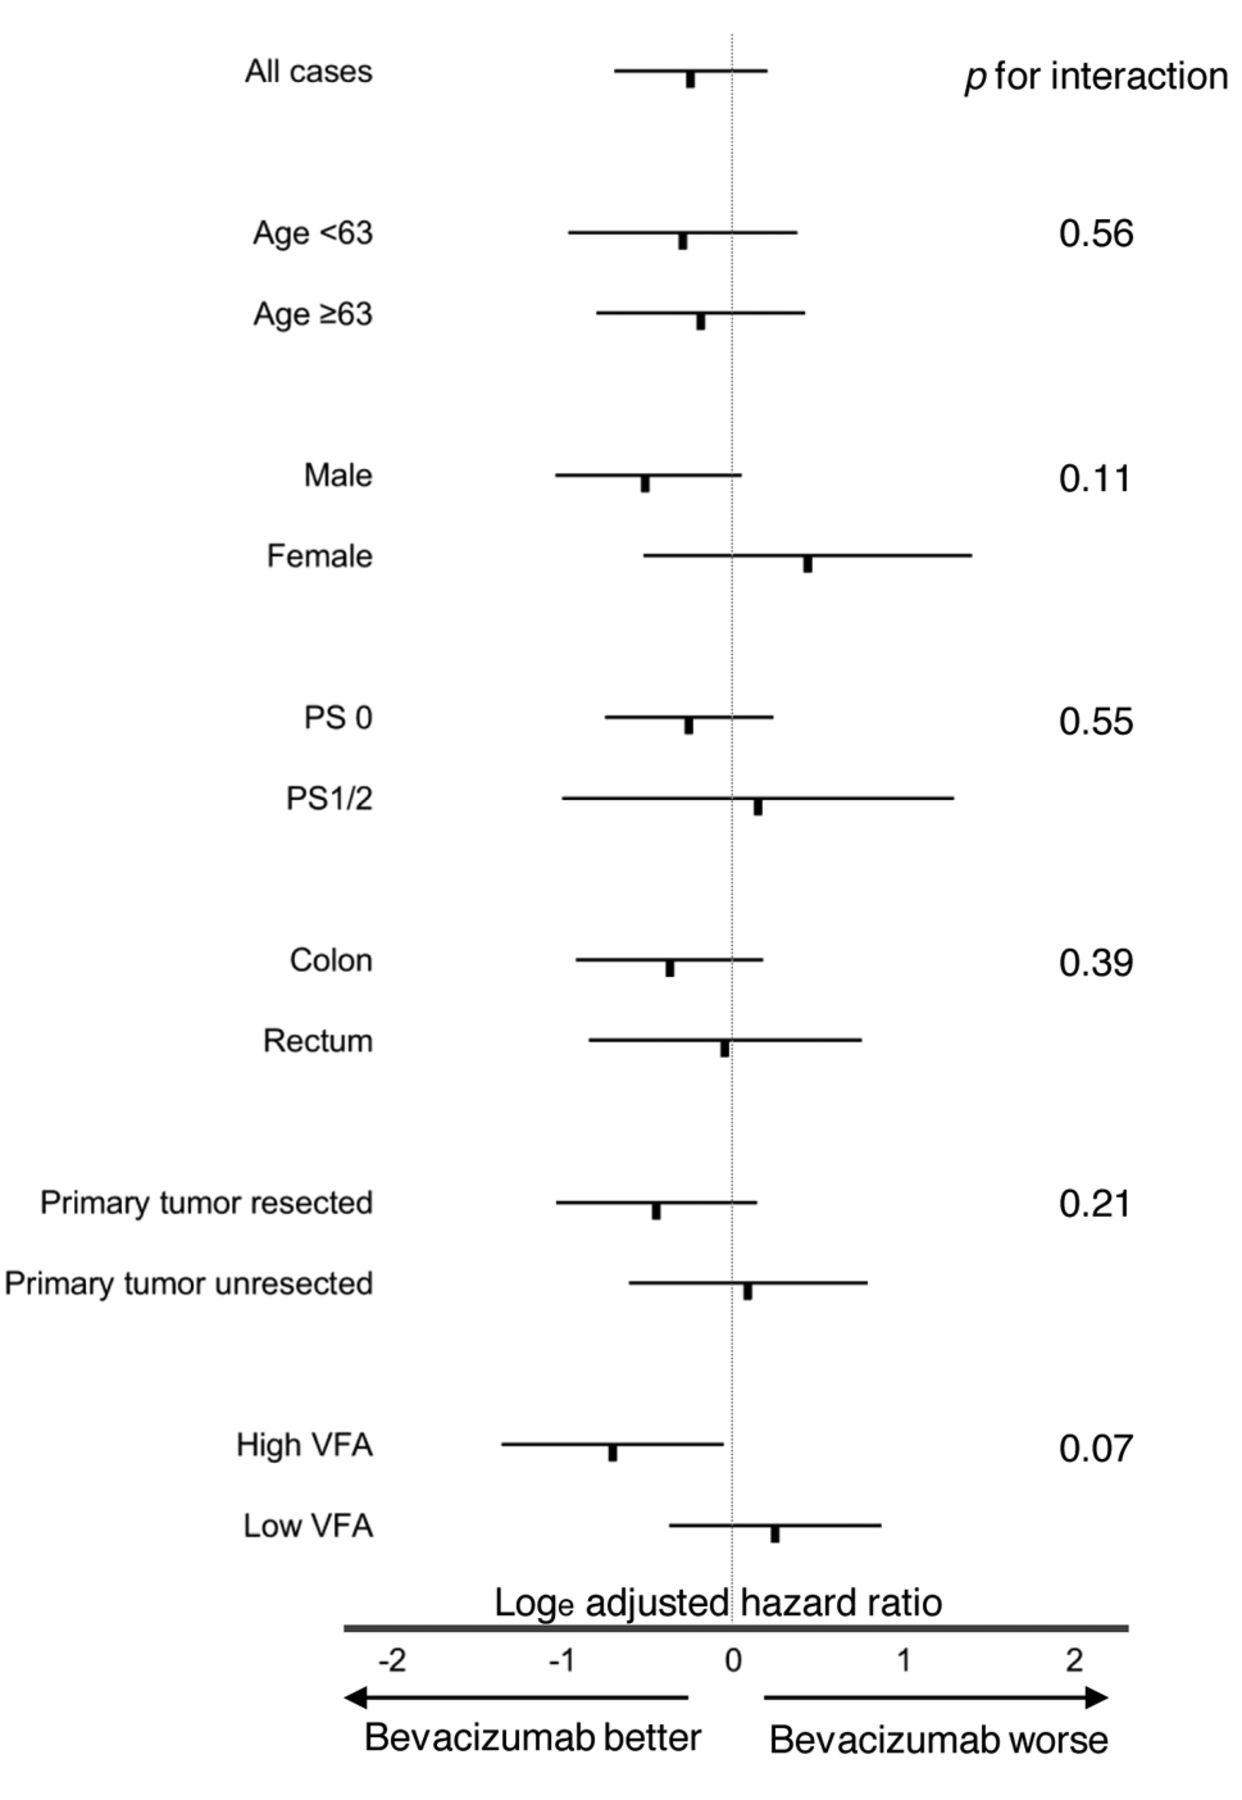
Subgroup analyses of overall survival according to bevacizumab treatment. The relation of bevacizumab on overall survival in various strata is shown by natural logarithms of adjusted hazard ratios with 95% confidence interval. PS: Performance status, VFA: visceral fat area.
Frequency of second- to fourth-line treatment with chemotherapy with and without bevacizumab.
Summary of previous reports evaluated the association between bevacizumab efficacy and visceral fat /body mass index.
Acknowledgements
The Authors thank the participating patients and their families very much. We are indebted to the physicians, all other co-medical staff (especially Ms. Yoshida at Kumamoto University) who contributed to this study. We also thank Ms. Sakamoto, Mr. Shimose and the other staff at the Clinical Research Support Center Kyushu (CReS Kyushu) for their excellent collection and management of data, secretarial assistance, and any other supports.
Footnotes
Conflicts of Interest
EO, YE, YA, YMa and HB received honorarium from Chugai Pharmaceutical Co. Ltd. EO, YA and HB received honorarium from Taiho Yakuhin Co. Ltd. EO and YMa received honorarium from Yakult Honsha Co. Ltd. EO and HB received honorarium from Merk Japan. EO and HB received honorarium from Bayer. EO and YA received honorarium from Takeda Pharmaceutical Co. Ltd. YO, HS, YMa and HB received research funding from Chugai Pharmaceutical Co. Ltd. YMa and HB received research funding from Yakult Honsha Co. Ltd. YMa and Hb received research funding from Taiho Yakuhin Co. Ltd. YMa received research funding from Merk. HB received research funding from Takeda Pharmaceutical Co. Ltd. YMi, ST, MS, YS and TT have no conflict of interest directly relevant to the content of this article.
- Received October 14, 2017.
- Revision received October 29, 2017.
- Accepted November 1, 2017.
- Copyright© 2018, International Institute of Anticancer Research (Dr. George J. Delinasios), All rights reserved


