


Abstract
Background/Aim: Expression profiling was performed to delineate and characterize the impact of malignancy by comparing tissues from three sites of head and neck cancer of each patient, also determining interindividual variability. Materials and Methods: Genome-wide analysis was carried out covering the expression of 25,832 genes with quantification for each site of seven patients with tonsillar or oropharyngeal squamous cell carcinoma. Immunohistochemical analysis was performed for adhesion/growth-regulatory galectins, three pro-inflammatory chemo- and cytokines and keratins. Results: Up- and down-regulation was found for 281 (tumor vs. normal) and 276 genes (transition zone vs. normal), respectively. The profile of the transition zone had its own features, with similarity to the tumor. Galectins were affected in a network manner, with differential regulation and interindividual variability between patients, also true for keratins and the chemo- and cytokines. Conclusion: These results underline special features at each site of specimen origin as well as the importance of analyzing galectins as a network and of defining the expression status of the individual patient prior to reaching clinically relevant conclusions.
Squamous cell carcinoma (SCC) of the head and neck continues to be a major clinical challenge (1). This tumor type is characterized by locally aggressive growth, lymph node metastasis and limited spread beyond lymph nodes (2). Radical surgery represents the main therapeutic modality but can have unfavorable consequences and reduce quality of life. Clinically, reliable independent prognostic factors can guide decisions on the strategy of therapy for the individual patient. While classical parameters such as site of tumor localization, radicality of resection and human papillomavirus status have reached a high degree of validity, current research aims to identify molecular markers reflecting potential for tumor invasiveness and spread (3, 4). Delineating and studying functionally-relevant epitopes based on a clear concept thus offers the prospect of defining functional markers whose strategic blocking or regulation is innovative and may be of therapeutic benefit. The complexity of cellular glycosylation of lipids and proteins, amenable to analysis in molecular detail by sophisticated techniques and known to be like a fingerprint for cells (5, 6), and its capacity to store information at high coding capacity (7-10) provide an incentive towards this end.
In fact, the functional pairing of glycan determinants with endogenous receptors (lectins) is being revealed to be of broad (patho)physiological significance (11-13). Figuring prominently as contact sites, the termini of glycan chains are special due to their intimately regulated profiles of expression, e.g. by a tumor suppressor which eventually causes lectin-triggered anoikis (14,15). Such signals are evidently read and interpreted by members of the family of adhesion/growth-regulatory galectins (16-18), and these bioeffectors are present in SCC. Their study was initiated in cells and immunohistochemically for galectins 1 and 3 (19-24), then extended to other family members such as galectins 7, 8 and 9, indicating the presence of a galectin network (25-31). At the level of cellular activity, the demonstration that a lectin such as galectin-1 is associated to pro-inflammatory/invasive activities such as those of chemo- and cytokines, or the pro-degradative matrix metalloproteinases, points to a molecular bridge from lectins to tumor progression (32-34). These results explain the interest in monitor immune mediators such as the chemokine (C-X-C motif) ligand 1 (CXCL1) and interleukin 6 and 8 (IL6/IL8), flanked by markers of differentiation, that are keratins (35,36), concomitantly with studying the galectin network in this tumor class. The work here feared on the level of such factors in individual patients in genome-wide expression analysis, and for specimens from three different regions of each patient.
In this study, we address two issues. In the first step, we performed a genome-wide expression analysis of the tumor (SCC), the margin of surgical resection (MSR) and normal tissue (NOE) to comparatively map the influence of the site on mRNA representation. Next, mRNA quantity for seven members of the galectin family was determined, together with that for seven keratins and the three immune factors for each patient in order to characterize interindividual variability. Finally, this network analysis was taken to the level of immunohistochemistry for selected probes to visualize distribution profiles of the gene products. The observed differences between signal intensities at the mRNA level of and immunopositivity substantiate interpretation of each set of data in its own context without unwarranted extrapolations.
Materials and Methods
Characteristics of patients and tissue processing. Samples were collected from patients suffering from SCC after acquiring their informed consent and study design approval by the Local Ethical Committee of the University Hospital in Motol, Prague, Czech Republic No. MZ VES 2015, in agreement with the Declaration of Helsinki. The characteristics of patients are summarized in Table I. For each case, specimens of each of the three tissue regions, i.e. SCC, MSR and NOE from the contralateral cheek of each donor, were processed. Tissue specimens were routinely incubated in RNAlater® (Ambion, Foster City, CA, USA) to preclude degradation by activity of endogenous RNases, frozen in liquid nitrogen and stored at −80°C. Frozen sections (7 μm thickness) were prepared using CryoCut-E (Reichert-Jung, Vienna, Austria) and used for extraction of RNA and for immunohistochemistry.
RNA Extraction and library preparation for sequencing. Total RNA from 30 microdissected cryosections of each sample stored in RNAlater was isolated using the reagents of the RNeasy Micro Kit (Qiagen, Hilden, Germany) according to manufacturer's instructions, including DNase I treatment. The concentration of RNA was measured with a Qubit 3.0 fluorimeter (Life Technologies, Carlsbad, CA, USA), and its quality was routinely determined by 2100 Bioanalyzer and RNA 6000 Nano kit reagents (Agilent, Santa Clara, CA, USA). A sequencing library including indices was prepared in two pools using a TruSeq Stranded mRNA LT Sample Prep Kit (Illumina, San Diego, USA). The cDNA concentration of the libraries was measured using the KAPA Library Quantification Kit (Kapa Biosystems, Wilmington, MA, USA), the size distribution was estimated by Agilent High Sensitivity DNA Kit reagents and 2100 Bioanalyzer equipment (Agilent). Clusters were generated with TruSeq Rapid Cluster Kit/cBot (Illumina) on two separate rapid flow lines using 10 pM diluted libraries, with 1% PhiX control added. Sequencing on an Illumina Hiseq 2500 instrument was performed to generate 2×50-bp paired-end exome reads using TruSeq Rapid SBS Kit chemistry.
Characteristics of studied patients.
Overview of primary analysis. Material from the 21 different samples from seven patients (SCC, MSR and NOE for each) was sequenced. A total of 109 cycles yielded 35.21 Gbp of raw data with 96.65% clusters passing filter for read 1 and 97.71% for read 2. The overall percentage of bases matching or being above the Q30 Illumina Sequencing Quality Score was 96.5%, and cluster density reached optimal range for both reads with 1012 and 836 K/mm2, respectively. Aligned reads for spiked PhiX control reached 0.92% of total.
Data pre-processing and RNA-seq alignment. The raw data (BCL files) were demultiplexed using Illumina's tool bcl2fastq (version 2.17; Illumina) with default parameters. The quality of raw FASTQ files was checked using the program MultiQC (37). All reads passed the quality control (Phred Qual Score >30). Reads of the length of 50 bases were aligned to human genome hg19 reference (https://support.illumina.com/sequencing/sequencing_software/igenome.html) applying the splice junction mapper for RNA-seq reads TopHat (38). The default parameters for TopHat were used. The output was as a BAM file (39).
List of antibodies used for immunohistochemistry.
RNA-seq data quantification and gene expression. Analysis was performed by Tuxedo pipeline-based processing (40). The resultant BAM files were used in Cufflinks algorithm v 2.2.1 (39). Differential expression analysis was performed by Cuffdiff v. 2.2.1 (40) based on transcript abundances. The raw output cufflinks transcripts were log2 transformed at fragments per kilobase of exon per million mapped reads (FPKM). To avoid taking log2 of zero, we routinely added a constant (0.01) to the FPKM.
Statistical analysis. Genome-wide comparisons were made to pinpoint significant differences and interindividual comparison of selected genes mentioned above (galectins, keratins and pro-tumoral chemo- and cytokines). Genes differentially expressed at a log2 fold-change value greater than 2 (based on FPKM ratio) and false discovery rates (FDR) values of less than 5% were listed. Gene ontology (GO) and pathway analysis of up- and down-regulated genes were performed using Enrichr and PANTHER (41) databases. Statistical analysis was carried out using the CummeRbund Bioconductor package within the R environment (R Development Core Team 2007).
Immunohistochemistry. Tissue sections were routinely washed in phosphate-buffered saline (PBS; pH 7.2), fixed in 5% paraformaldehyde in PBS for 5 min and extensively washed with PBS. The primary antibodies listed in Table II were diluted as recommended by the supplier or tested at 1:50 when made in-house, and the signal of immunohistochemical processing was visualized by fluorescein isothocyanate (FITC)- or tetramethylrhodamine isothiocyanate (TRITC)-labeled second-step antibodies, also diluted as recommended by the supplier (Table II). As a control for specificity, that is, to exclude antigen-independent reactions, the first-step antibody was either omitted from the protocol or replaced by an irrelevant antibody (same isotype for the monoclonals). The polyclonal antibodies to galectin were made in-house, their specificity being rigorously checked for absence of any cross-reactivity among human galectins by enzyme-linked immunosorbent assay (ELISA)//western blotting and rounds of chromatographic affinity depletion of the respective IgG fraction using resin-immobilized lectin (42-45). Nuclei were counterstained by 4’,6-diamidine-2-phenylindol (DAPI) (Sigma-Aldrich, Prague, Czech Republic), and the specimens were mounted in Vectashield (Vector Laboratories, Burlingame, CA, USA). The specimens were inspected, evaluated and files stored using a Nikon-Eclipse 90i microscope equipped with the computer-assisted image analysis system LUCIA 5.1 (Laboratory Imaging, Prague, Czech Republic) and a Vosskühler VDS CCD-1300 camera (VDS Vosskühler GmbH, Osnabrück, Germany).
Results
Differential gene-expression profiling. A total of 25,832 genes was covered by this profiling. When compared in detail, the expression profile of SCC significantly differed from that of NOE in 281 genes, and MSR from NOE in 276 genes. The most highly dysregulated gene products in SCC are listed in Table III (SCC vs. NOE; upregulated) and Table IV (SCC vs. NOE; down-regulated). For comparison, Table V and Table VI list the respective information on the MSR vs. NOE comparison, and Table VII and Table VIII complete the pairwise comparisons by presenting the results of setting MSR and SCC data in relation. The extended version of each listing is accessible at http://www.physiolchem.vetmed.uni-muenchen.de/summary/anticancer_research/index.html
Various families of proteins appear in these lists (and the further identified cases), among them so-called glycogenes coding for lectins such as collectin-11, CD22 (siglec-2) and galectins or glycosyltransferases such as genes for β-1,4-N-acetyl-galactosaminyltransferase 4 (preparing the LacdiNAc epitope) or α2,6-sialyltransferase 1, the main activity of α2,6-sialylation. As graphically illustrated in the heat map with the dendrogram based on Jensen-Shannon distances, the profiles of gene expression have distinctive features (Figure 1). Of interest, the profile of MSR was revealed to be different from that for NOE, as demonstrated by principal component analysis (PCA) for dimensionality reduction and by multi-dimensional scaling for dimensionality reduction (Figure 2). Using the gene ontology (GO) and pathway analysis, respective assignment of the most dysregulated cases of gene expression in SCC in relation to NOE was performed, with indications for extracellular sites of action (Table IX).
The genes most up-regulated in squamous cell carcinoma compared to normal epithelium.
The genes most down-regulated in squamous cell carcinoma compared to normal epithelium.
Based on the reasoning given in the introduction, data on galectins, keratins and cytokines are presented on a patient-to-patient basis. Levels of gene expression of galectins-1, - 2, -4, -8 and -9 show increases in tumors relative to NOE, with the highest difference seen in the case of galectin-4 (Figure 3A). However, individual cases showed exceptional data, i.e. a decrease. The same trends were seen for MSR data when compared to those for NOE (Figure 3B). The level of galectin-7-coding mRNA was, in contrast, reduced in most cases (Figure 3). Data sets of comparisons for MSR and SCC are available online: http://www.physiolchem.vetmed.uni-muenchen.de/summary/anticancer_research/index.html. The obvious deviations underscore the patient- and site-dependent nature of the characteristics.
The genes most up-regulated in margin of surgical resection compared to normal epithelium.
The genes most down-regulated in margination of surgical resection compared to normal epithelium.
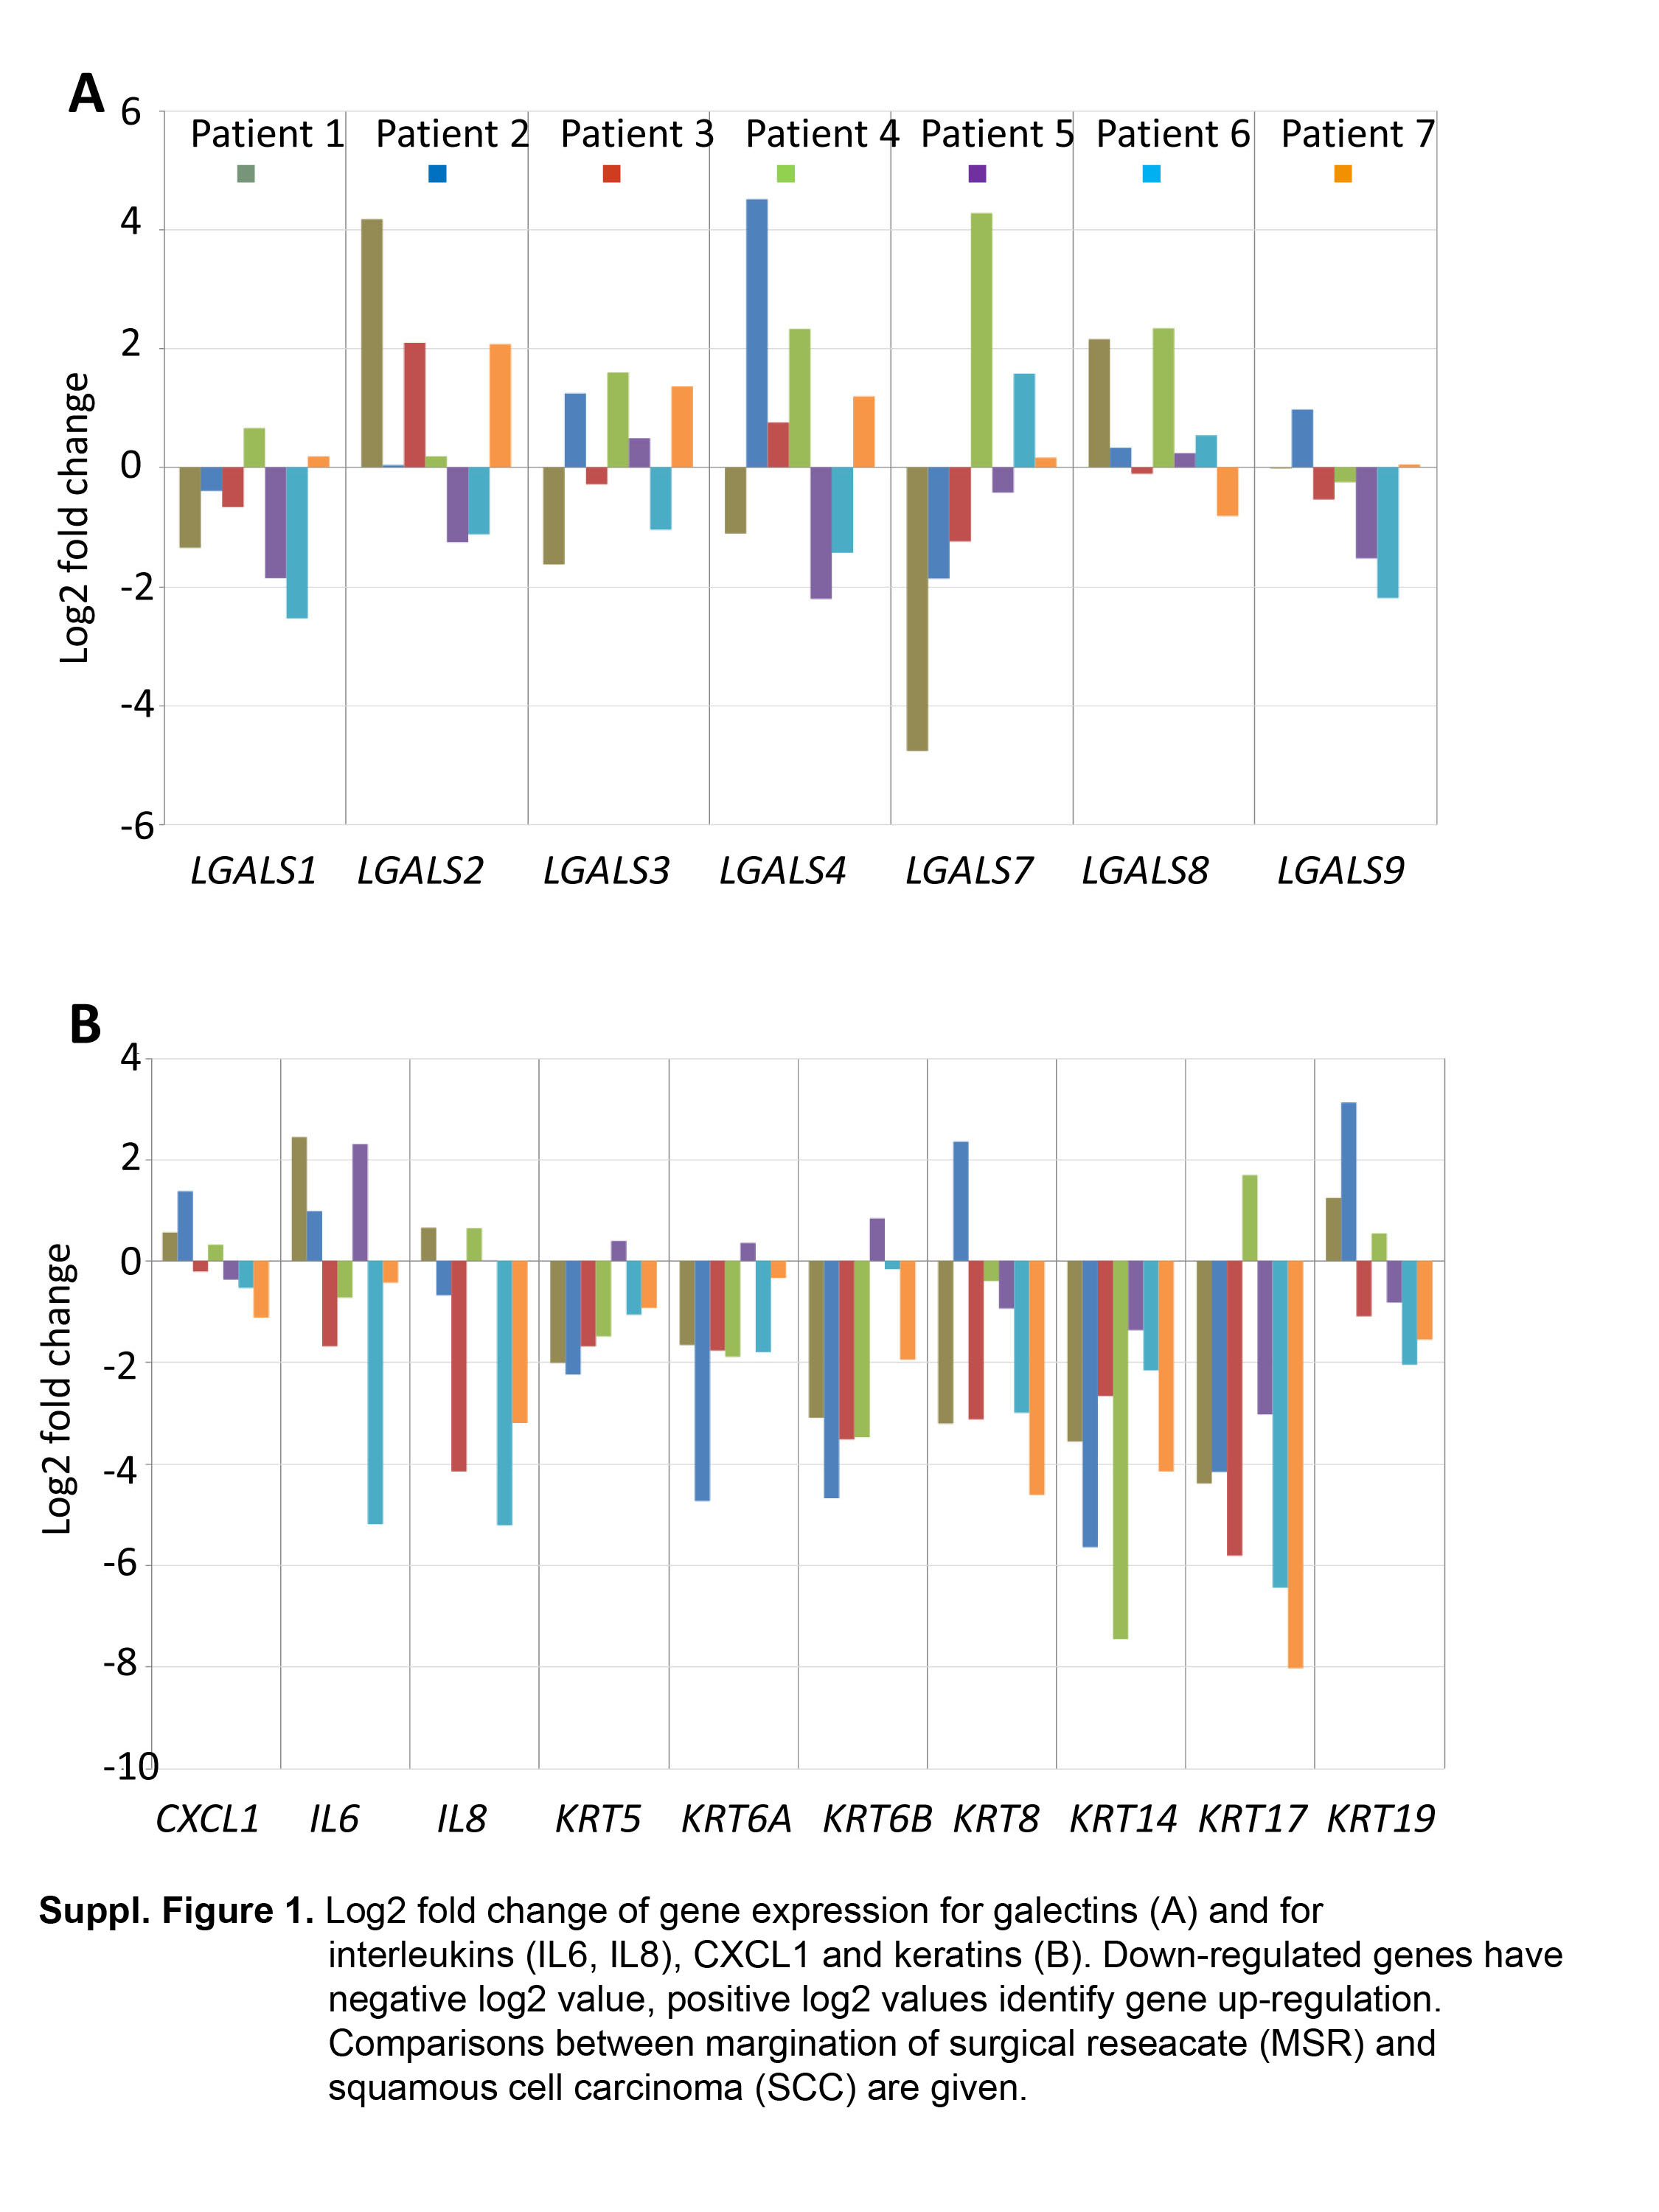
Expression of CXCL1, IL6 and IL8 genes was found to be up-regulated in SCC and MSR in comparison to NOE [Figure 4, with MSR having lower levels than SCC (http://www.physiolchem.vetmed.uni-muenchen.de/bilder/zivicova-et-al-suppl-fig-1.jpg)]. Concerning keratins, marked interindividual variability was noted for keratin 5 and 6, their expression levels generally being lower in MSR than in NOE samples (Figure 4). Expression of keratins 8, 14, 17 and 19 was up-regulated in SCC relative to NOE, 8 and 19 were also up-regulated in MSR in comparison to NOE (Figure 4). Keratin 14 and 17 genes were expressed to a lower extent in MSR than in NOE, with exceptions (Figure 4). Transcript levels for all studied keratins except for keratin 19 were lower in MSR than in SCC (http://www.physiolchem.vetmed.uni-muenchen.de/bilder/zivicova-et-al-suppl-fig-1.jpg).
The genes imost up-regulated in margin of surgical resection compared to squamous cell carcinoma.
The genes most down-regulated in margin of surgical resection compared to squamous cell carcinoma.

Heat map showing genes differentially expressed between squamous cell carcinoma (SCC), normal epithelium (NOE) and margin of surgical resection (MSR) at a statistically significant level. Mutual relations between the three types of tested specimen are presented in the dendrogram (based on Jensen-Shannon distances) at 5% false discovery rates (FDR) and fragments per kilobase of exon per million fragments mapped (FPKM).
Immunohistochemical analysis. A common feature of all cases for immunopositivity was their interindividual variability. Table X gives a detailed account of this parameter for each patient, Figure 5 presents exemplary illustrations for each galectin. Galectin-1 was neither detected in SCC/NOE nor in the epithelium of the MSR, but was found in the extracellular matrix of cancer stroma (Figure 5, top panel). Galectin-3 was present in tumor stroma, namely in inflammatory leukocytes, and in malignant epithelium, in MSR samples in the epithelium, whereas staining of NOE was negative or revealing a very weak signal in the epithelium (Figure 5). No positivity for galectin-4 was observed in normal or SCC samples, a limited number of cells expressing galectin-7 were found in two cases (Figure 5). Five samples of NOE exhibited immunopositivity for galectin-7 and two samples were negative (Figure 5). Whereas galectin-8 was not detected, signals for galectin-9 were seen in the basal layer of two samples of NOE. In SCC and MSR samples, it was detected in infiltrating leukocytes, ascertained by signal overlap with positivity for CD45 (Figure 5, bottom panel).
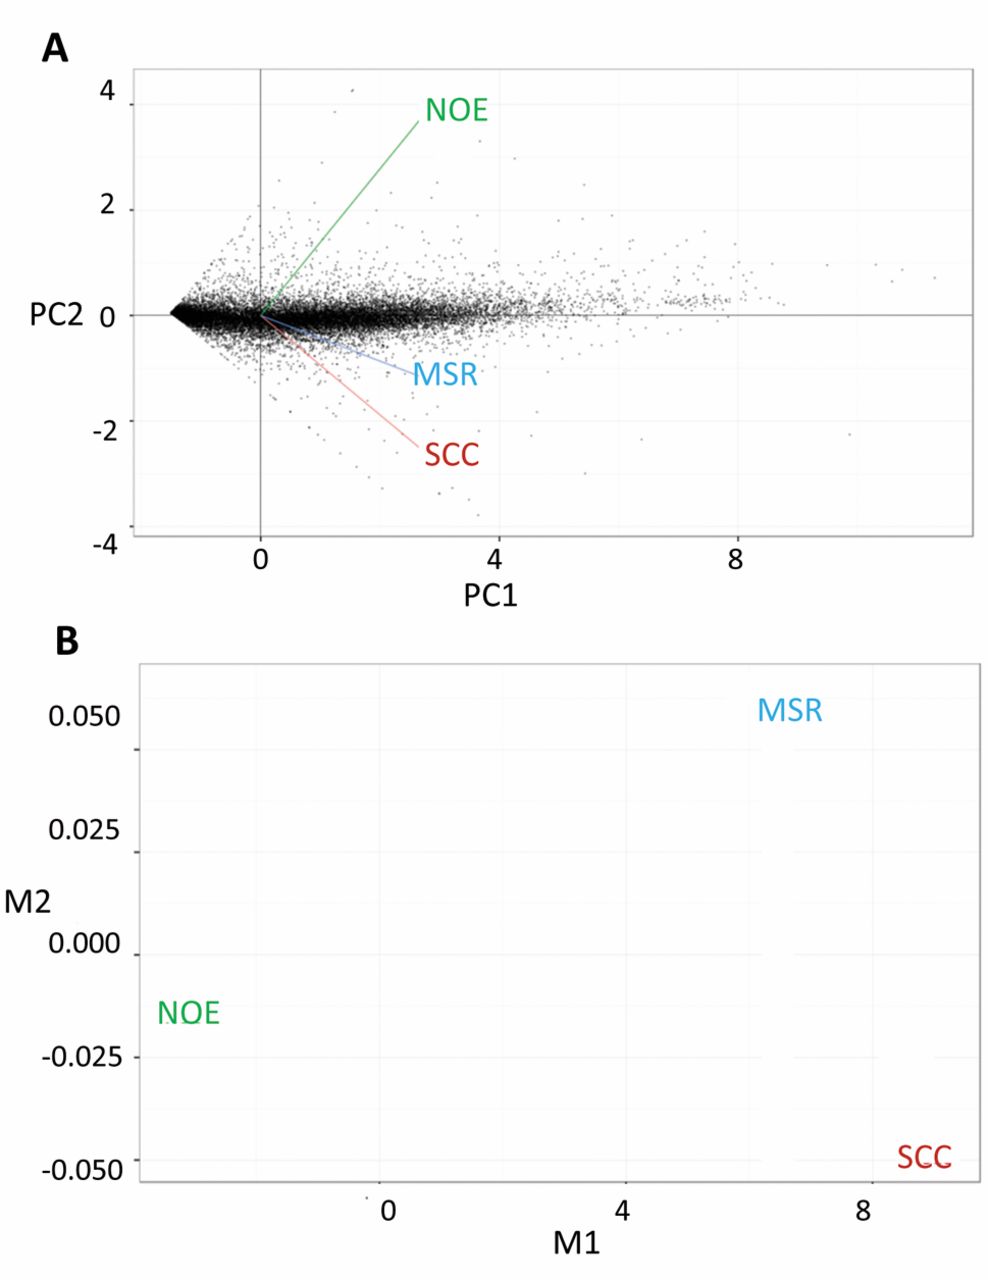
Principial component analysis (PCA) for dimensionality reduction showing a strong relation between gene expression in squamous cell carcinoma (SCC) and margin of surgical resection (MSR) in comparison with normal epithelium (NOE) (A). A similar scenario is obtained by multi-dimensional scaling for dimensionality reduction (B).
Keratins 8, 14, 17 and 19, at a level of interindividual variability similar to galectins, were positively stained in SCC cases (Table XI, Figure 5). No signal for keratin 8 was detected in NOE, keratins 14, 17 and 19 were observed in the majority of tumors, expression of 14 and 19 was present in the basal layer of normal epithelium and also in MSR.
Discussion
Genome-wide expression profiling was applied on specimens from seven patients, for each patient from three sites. Obviously, when using normal tissue (unaffected, from the other cheek) as a reference, it was possible to compare material from the tumor and the margin. Thus, a full-scale set of pairwise comparisons between normal, margin and tumor specimens is presented. Beyond pinpointing disparities, we focused on a class of emerging bioeffectors to investigate their significance of this factor, i.e. site of specimen, at the level of the individual patient. Of note, special attention is given to the question of whether, in this group, the interindividual variability could even reach divergent patterns of up- and down-regulation instead of quantitative differences.

Log2 fold-change as a measure of up- or down-regulation of gene expression for galectins (LGAL). Down-regulated genes have negative log2 value, positive log2 values identify gene up-regulation. Comparisons between squamous cell carcinoma (SCC) and normal epithelium (NOE) (A), and margin of surgical resection (MSR) and normal epithelium (NOE) (B) are given.
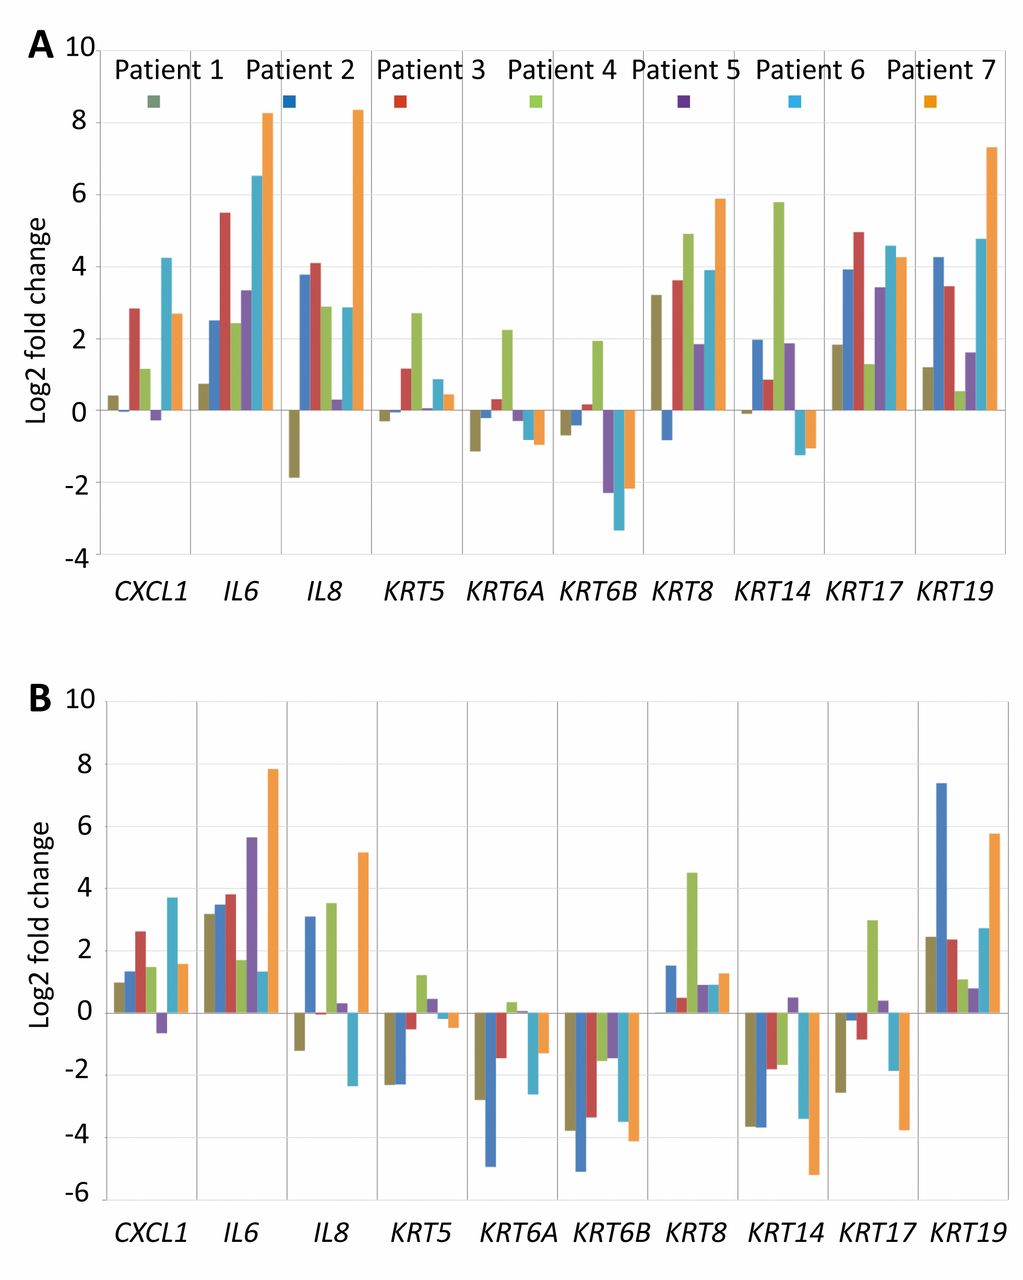
Log2 fold-change for expression of genes for interleukins (IL6, IL8), for chemokine (C-X-C motif) ligand 1 (CXCL1) (A) and for keratins (KRT) (B). Down-regulated genes have negative log2 value, positive log2 values identify gene up-regulation. Comparisons between squamous cell carcinoma (SCC) and normal epithelium (NOE) (A), and margin of surgical resection (MSR) and normal epithelium (NOE) (B) are given.

Immunodetection of galectins (G, green signal): Gal-1, Gal-3, Gal-4, Gal-7, Gal-8 and Gal-9. Keratins (KRT) such as 8, 19, 17 and 14 and the leukocyte marker CD45 (red signal) were also detected in representative samples of squamous cell cancer (SCC), margin of surgical resection (MSR) and normal oral epithelium (NOE). The number of the patient is given in each panel. The fluorescence profiles of galectin-9 and CD45 provide information on co-localization (the measured cell is marked by a yellow line). Nuclei were counterstained by 4’,6-diamidine-2-phenylindole.
Gene Ontology (GO) biological process classification for the genes most up-regulated between squamous cell carcinoma and normal epithelium (log2 fold-change >2, p<0.05).
Immunopositivity for galectins.
Galectins form a family of tissue lectins, which share reactivity to β-galactosides and the capacity to trigger post-binding effects. Intriguingly, these can be additive or antagonistic, as the examples of galectins-1 and -3 in osteoarthritis progression or in anoikis induction in pancreatic carcinoma cells attest (46-49). Moreover, an inducer of differentiation (butyrate) revealed differences in responsiveness between family members (50), and galectins can alter the proteomic profile of tumor cells, demonstrating an impact of galectin presence on expression (51). As consequence, it appears to make sense to proceed from recording the expression profile of a single or few proteins to a network analysis. On the histopathological side, this study was deliberately designed to include normal tissue from each patient. In addition to a comparison between tumor and normal tissue from the same patient, we also included a specimen of the surgical margin in order to address the issue as to whether and to what extent expression characteristics in this region deviate from that of tumor/normal tissue. Given the possibility that the studied gene products may have potential for therapeutic innovation, the application of the same protocol to specimens from several patients enables estimation of the extent of interindividual variations. In this sense, we obtained a fingerprint for galectin expression from three different sites for clinical specimens.
Our data revealed differential regulation among the galectin family with up- and down-regulation and interindividual variability. The resection margin can still show features of the SCC region that may signal the presence of tumor cells. The MSR zone appeared macro- and microscopically normal, whereas its gene-expression profile presented similarities to the cancer specimen. Because individual patients in this group presented exceptional behavior, a verification of expression at the protein (effector) level seems to be necessary before any decision on tumor management may be considered. Thus, salient lessons arising from the present results on galectins are that gene regulation is different for different galectin family numbers in SCC and among patients. Having tested antibody preparations applied in previous studies on head and neck SCCs (22-26), the possibility for false-negativity in staining is excluded, as confirmed by flanking immunohistochemical keratin localization. Given the possibility for applying human galectins as tools in tumor pathology (52, 53), such work can extend the given scope of analysis.
As a consequence of the reported expression of several galectins, it is advised that histopathological studies on galectins be carried out as a network analysis, as illustrated by this report and previously by respective mapping during development in a phylogenetic model (53-56). The possibility of functional antagonism and cooperation among galectin family members should be followed-up by experimental studies. Clinically, the noted interindividual variability calls for thorough analysis of each case prior to reaching clinically relevant conclusions.
Immunopositivity for selected keratins.
Acknowledgements
The Authors are grateful for funding by the Ministry of Health of the Czech Republic, project No. 15-28933A, the Charles University, projects PROGRES Q28/1LF, UNCE 204013 and Specific University Research, as well as by the Ministry of Education, Youth and Sports of the Czech Republic within the National Sustainability Program II (project BIOCEV-FAR reg. no. LQ1604) and project BIOCEV (CZ.1.05/1.1.00/02.0109). This publication is a result of the project implementation, covering expenses for equipment for bioanalyses (No CZ.1.05/2.1.00/19.0400), supported by the Research and Development for Innovations Operational Program (RDIOP) co-financed by European Regional Development Fund and the state budget of the Czech Republic. The Authors thank to Radana Kavková, M.Sc. and Marie Jindráková for excellent technical assistance.
Footnotes
↵* These Authors contributed equally to this study.
- Received March 25, 2017.
- Revision received April 11, 2017.
- Accepted April 19, 2017.
- Copyright© 2017, International Institute of Anticancer Research (Dr. George J. Delinasios), All rights reserved
References
In this issue


Jump to section
Related Articles
Cited By...
- Galectin-8 Favors VEGF-Induced Angiogenesis: In Vitro Study in Human Umbilical Vein Endothelial Cells and In Vivo Study in Chick Chorioallantoic Membrane
- Adhesion/growth-regulatory galectins tested in combination: evidence for formation of hybrids as heterodimers
- Detection of Distinct Changes in Gene-expression Profiles in Specimens of Tumors and Transition Zones of Tenascin-positive/-negative Head and Neck Squamous Cell Carcinoma