


Abstract
Background: Anticancer activity of extracellular nucleotides has been investigated in many types of cancer. Herein, the effects of extracellular nucleotides and the receptor profile for these nucleotides on prostate cancer (PCa) were elaborated. Materials and Methods: PCa cell lines representing different stages of PCa were used. The effects of ATP and adenosine on PCa growth and migration on different extracellular matrix proteins were examined by MTT and wound-healing assays. Purinergic receptor profiling was carried out by reverse transcription-polymerase chain reaction (RT-PCR). Results: A growth-inhibitory effect of ATP and adenosine was observed on all PCa cell lines tested. Several ATP-recognized P2 receptors and adenosine receptors were commonly expressed in PCa cell lines. Neither ATP nor adenosine had any significant effect on PCa migration. Conclusion: ATP and adenosine had an antiproliferative effect on PCa cells without affecting their motility, indicating their potential as a novel therapy for PCa.
Extracellular nucleotides were first proposed as signaling molecules in 1972 (1). Signaling through purinergic receptors is ubiquitous due to the diversity of purine and pyrimidine ligands, the number of receptors and extracellular nucleotidases. Purinergic signaling has been shown to play a role in many pathways including neurotransmission (2), cell differentiation, hormone secretion, vasodilation, cell proliferation, wound healing and apoptosis (3). There are two distinct families of purinergic receptors: P1 receptors for adenosine and P2 receptors for ATP/ADP and UTP/UDP ligands. P2 receptors are further divided into ligand-gated ion channel receptors, P2X, and G protein-coupled receptor, P2Y, subfamilies. To date, four P1 receptors (A1,2a,2b,3), seven P2X receptors (P2X1-7) and eight P2Y receptors (P2Y1,2,4,6,11-14) have been identified in mammalian cells (4). The adenosine receptor subtypes A1 and A3 down-regulate the production of cAMP, while A2a and A2b subtypes up-regulate the production of cAMP. Activation of P2X receptors leads to an influx of cations from the extracellular space, while activation of P2Y receptors leads to either an elevation of intracellular Ca2+ from endoplasmic reticulum stores or down-regulation of cAMP production depending on the specific subtype of P2Y receptor activated.
Growth suppression by the P2 agonist, ATP, was demonstrated first by Rapaport in 1983 (5). Exogenous ATP was shown to suppress the growth of pancreatic and colon cancer by causing cell-cycle arrest in S-phase. To date, the anticancer activity of extracellular nucleotides has been investigated in many types of cancer, including leukemia, melanoma and non-melanoma skin cancer, colorectal cancer, lung cancer, cervical cancer, prostate cancer (PCa) and squamous cell skin cancer (6). These led to clinical trials in patients with colorectal and non-small cell lung cancer that showed promising results with limited side-effects (7-9).
PCa is the most frequently diagnosed cancer in North American men and the second leading cause of cancer-related death in American men. It was estimated that there would be approximately 180,890 new cases of PCa and 26,5120 related deaths in the United States alone in 2016 (10). Current standard treatments for advanced PCa include various hormonal therapies whose goal is the ablation of androgens and their action (11). Even though 70% to 80% of patients respond well to first-line treatment, most patients eventually develop castrate-resistant disease (CRPCa) (12). Novel therapy therefore is needed to eliminate both early and CRPCa. Accordingly, growth suppression through purinergic signaling might be one such therapy. The effect of ATP and adenosine on PCa was first described in 1992 when Fang et al. (13) found that ATP, as well as some P2 receptor agonists, inhibited the growth of DU145, PC-3 and PC-3M androgen-independent PCa cells. These P2 agonists also induced Ca2+ responses and inositol signaling in these cell lines. In addition, the growth suppression activity of ATP and benzo-ATP was demonstrated in the androgen-sensitive PCa cell line, LNCaP (14). The latter group also showed an increased level of AMP and DNA fragmentation in P2 agonist-treated cells. These data suggested that it was possible to induce apoptosis in PCa cells by ATP. However, the comparative effects of ATP on different stages of PCa cells have not been investigated to our knowledge.
The antineoplastic activity of purinergic signaling has been shown not only from P2 agonists, but also from P1 agonists. An A3 agonist was shown to have dose-dependent antiproliferative effects on androgen-sensitive (LNCaP-FGC10) and androgen-independent (DU145 and PC-3) PCa cells (15). Similar effects were shown in these three cell lines when they were treated by adenosine (16). Both groups of agonists were shown to induce apoptosis and promoted G0/G1 cell-cycle arrest through p53, cyclin-dependent kinase 4 (CDK4)/cyclin D1-mediated pathways (15, 16). An evaluation of purinergic action in lineage-related cells ranging from androgen-sensitive to castrate-resistant as far as we are aware has not been performed. In this study, cells of the LNCaP human PCa progression model (17-20) were used to examine the expression profile of purinergic receptors as well as growth and cell migratory responses to ATP and adenosine. In addition, the impact on purinergic agonists on migration on different extracellular matrix substrates was examined.
Materials and Methods
Cell culture. The isogenic LNCaP human PCa progression model consists of a series of cell lines derived through successive passage in vivo in castrated hosts that progress from LNCaP (18) (non-metastatic androgen-sensitive), C4-2 (metastatic castrate-resistant) to C4-2B (bone adapted castrate-resistant) (16-19). The LNCaP progression models were obtained from Dr.Chung at isolation (21). Other androgen-independent PCa cell lines, including PC3 (22) and DU145 (23), were purchased from American Type Culture Collection (Manassas, VA, USA) and also utilized in some experiments. All PCa cells were cultured in T-medium (Gibco, Grand Island, NY, USA) supplemented with 5% fetal bovine serum (FBS) (Atlas Biologicals, Fort Collins, CO, USA).
MTT cell viability assay. PCa cells were plated at 5,000 cells/well in 24-well tissue culture plates (Greiner Bio-One, Monroe, NC, USA). The cells were treated with escalating concentrations of ATP, adenosine or phosphate-buffered saline (PBS) control (3.126 μM to 3.126 mM). The treatments were refreshed by half changes of the media with fresh agonists daily. After 7 days of treatment, cell viability was measure by using MTT (Life Technologies, Grand Island, NY, USA) assay. The absorbance at 560 nm was read on a BMG PolarStar Optima plate reader (BMG LABTECH Inc, Cary, NC, USA).
Reverse transcription–polymerase chain reaction (RT-PCR). Total RNA was extracted using TRIzol reagent (Life Technologies) according to the manufacturer's protocol. The total RNA was then treated with RNase-free DNase I (Roche, Indianapolis, IN, USA) according to the manufacturer's protocol. Then, 5 μg of total RNA was reverse transcribed using Maloney murine leukemia virus (M-MLV) reverse transcriptase (Life Technologies) according to the manufacturer's protocol. cDNA corresponding to 50 ng of the total RNA was used in PCR. PCR was carried out using GoTaq® hot start polymerase (Promega, Madison, WI, USA) for 32 cycles. A 100bp DNA ladder (Promega) was used to compare product size. Primer sequences used are shown in Table I.
Migration assay (wound-healing assay). PCa cells (3.5×10⁶) were plated on 60 mm plastic dishes coated with 0.5 μg/ml laminin (BD Biosciences, San Jose, CA, USA), or 0.5 μg/ml collagen I (BD Biosciences), or non-coated dishes. After 48 h after plating, the hyperconfluent cells were treated with either ATP or adenosine at their half-maximal effective concentration (EC50) as determined by growth-inhibition data (Table II) for 5 days; the control groups were treated with PBS as vehicle control. A scratch/wound was introduced to each culture at the beginning at the experiment by using 1000 μl silicone-coated pipette tips. Treatments were refreshed daily by half changes of the media with freshly prepared treatments. Images of the wounds were taken daily at the same locations along the scratch using a stage micrometer to measure cell migration. The experiment was followed for 5 days. All pictures were analyzed using Photoshop (Adobe Systems Incorporated, San Jose, CA, USA) to measure the migratory distance.
Statistical analysis. An ANOVA with Tukey's test was utilized for statistical analysis and p-values of less than 0.05 were considered statistically significant. Data are represented as mean±standard error of mean (SEM) unless indicated otherwise.
Results
ATP and adenosine inhibit PCa cell growth in a dose-dependent manner. LNCaP, C4-2, C4-2B, DU145 and PC3 prostate cancer cells were used to determine the effect of ATP and adenosine on PCa cell growth. The cells were treated with a range of concentrations from 3.126 μM to 3.126 mM in half-log increments for 7 days, after which the cell viability for each group was determined by the MTT assay normalized to PBS (vehicle control)-treated cells.
Both ATP and adenosine had dose-dependent growth-inhibitory effects on all PCa cell lines tested (Figure 1 and Table III). As shown in Figure 1A, each PCa cell line responded to ATP similarly, but with a different magnitude of response. The 7-day EC50 of ATP for non-metastatic LNCaP and bone-adapted C4-2B cell lines was 41.2 μM. However, the EC50 of ATP was higher for all metastatic PCa cell lines at 67.6 μM, 46.77 μM and 56.89 μM for C4-2, DU145 and PC3 respectively (Table II). In addition, LNCaP exhibited the greatest sensitivity to inhibition of cell growth at 79.56% relative to that of the control group, while C4-2 was the least responsive, with a maximum inhibition of 73.17% relative to that of the control group at 316.23 μM. Furthermore, all cell lines tested displayed a biphasic effect in which cell inhibition was not as dramatic when doses higher than 1 mM were used.
Primer sequences for genes for purinergic receptors and ectonucleotidases.
Similarly to ATP, all growth curves for treatment with adenosine showed a corresponding dose–response relationship; however, all the curves were right-shifted, with EC50 values above 100 μM. Indeed, as shown in Figure 1B and Table II, the EC50 of adenosine for most PCa cells was 167.8 μM; by contrast, only the bone-adapted C4-2B cell line had a lower EC50 of 120.23 μM.
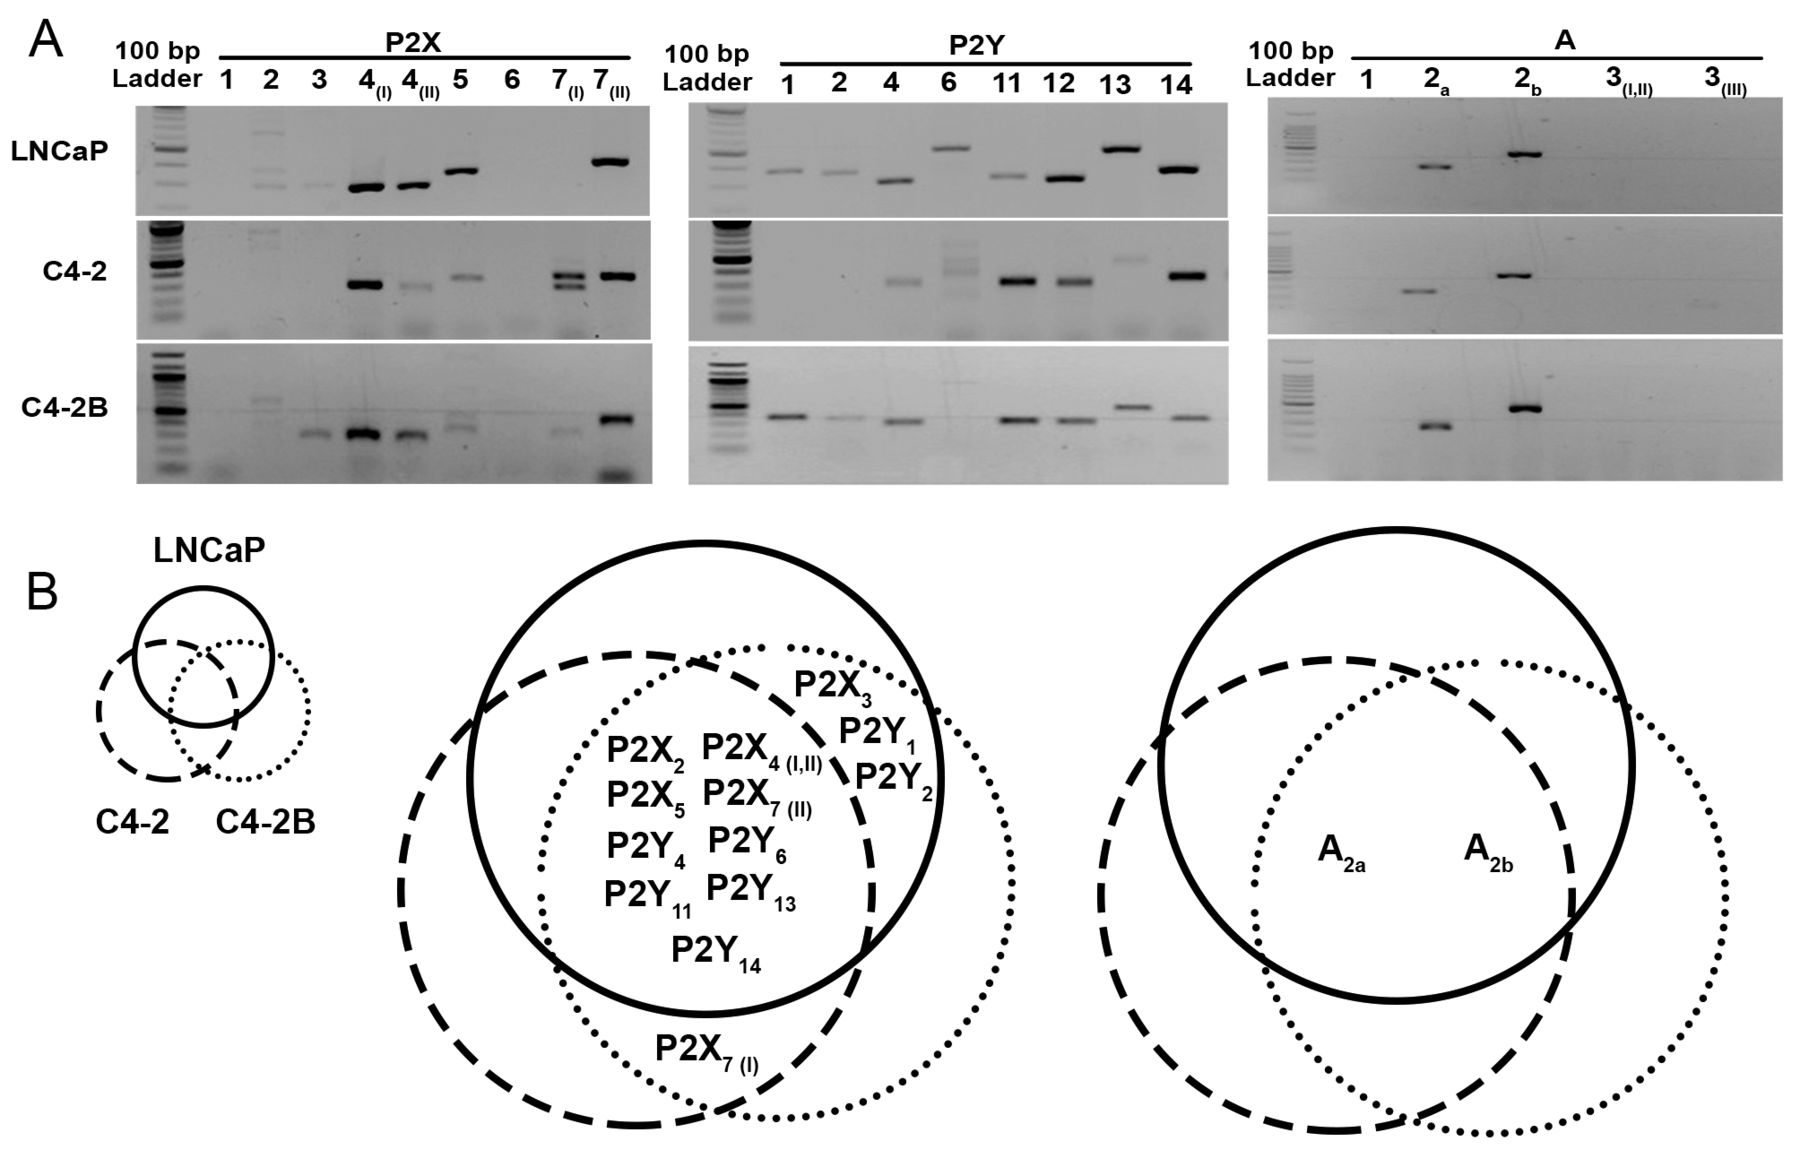
PCa cell lines exhibited differential expression of purinergic receptors. RT-PCR was performed to investigate the expression profile of purinergic receptors in cells of the LNCaP progression model (Figure 2). The results showed common expression of several ATP-activatable P2 receptors including P2X2, P2X4 (I,II), P2X5, P2X7 (II), P2Y11 and P2Y13. Interestingly, P2X7 (I) expression was found only in castrate-resistant C4-2 and C4-2B, but not in the androgen-sensitive, LNCaP cell line. On the other hand, P2X3, P2Y1 and P2Y2 were found in LNCaP and the bone-adapted, castrate-resistant variant C4-2B, but not in the highly metastatic C4-2 cell line. The expression of P2Y4 (UTP ligand) and P2Y6 (UDP ligand) was found in all PCa cell lines tested.
Half-maximal effective concentration (EC50) of ATP and adenosine were calculated from 7-day growth assays of prostate cancer cells. The data correspond to those shown in Figure 1.
The expression of adenosine receptors in cells of the LNCaP progression model also was investigated. From all four groups of adenosine receptors, only A2a and A2b were expressed and were found in all cell lines of the LNCaP progression model. A1 and A3 (I, II, III) were not expressed in any PCa cell lines tested.

ATP and adenosine had growth-inhibitory effects on prostate cancer (PCa) cell lines. The graphs were plotted as log [agonist] (M) vs. response. The half-maximal effective concentration (EC50) of ATP for all cell lines tested was below 100 μM. The EC50 of adenosine for all cell lines tested was above 100 μM. Statistical analysis is shown in Table III. **p-Value <0.001 compared to the vehicle control.
Statistic analysis of growth-inhibition assay was performed as described in the Materials and Methods.
ATP and adenosine had no significant effect on PCa migration. Laminin is a major protein in basement membrane (24) that has been associated with increased tumorigenicity in mice (25) and its loss in basement membranes is associated with increased PCa metastasis (26, 27). Collagen I is a major component of bone ECM (28), where metastatic PCa cells eventually find themselves, and has been associated with enhanced 3D and tumorigenic growth of PCa cells (29, 30). These matrices were used as a comparison to PCa cells grown on tissue culture plastic dishes.
Differences in PCa migration were seen in culture on different ECM proteins. LNCaP cells exhibited significantly higher migratory ability on laminin compared to collagen I and plastic (p<0.05). C4-2 cells exhibited increased migration on both laminin and collagen I (p<0.01) as compared to the plastic. Lastly, the bone-adapted C4-2B cells displayed remarkably higher motility on collagen I (p<0.001) than on both laminin and plastic (Figure 3).
The effects of ATP and adenosine on PCa migration were studied. The migration assays were also carried out on different ECMs to determine the impact of ECM on PCa migratory response to ATP and adenosine. Even though stimulation with adenosine appeared to increase LNCaP migration on plastic and collagen I, the results were not statistically significant. In addition, the results from LNCaP cells on laminin, as well as C4-2 and C4-2B on both laminin and collagen I, showed no significant effect of ATP or adenosine on PCa migration (Figure 4).

Reverse transcription–polymerase chain reaction (RT-PCR) results showed differential expression of purinergic receptors in cells of the human LNCaP progression model. A: Agarose gels of RT-PCR products for P2Xs, P2Ys and adenosine receptors in LNCaP, C4-2 and C4-2B prostate cancer cell lines. B: Venn diagrams illustrating the expression pattern of purinergic receptors in cells of the LNCaP human prostate progression model.
Discussion
Previous studies showed a growth-inhibitory effect of both ATP and adenosine on PCa cells (13, 15, 16, 31-33). Corresponding to those findings, a growth-inhibitory effect of ATP and adenosine was observed on various PCa cell lines used in this study, including LNCaP, C4-2, C4-2B, DU145 and PC3, in a dose-dependent manner (Figure 1). All PCa cell lines shared similar trends in growth inhibition. While the bone-adaptive C4-2B cell line had the lowest EC50 in terms of its initial response to ATP and adenosine, DU145 and LNCaP responded with the greatest magnitude of inhibition, albeit at a much higher concentration. Since ATP is tolerated well in patients, up to 1 mM in serum (34), these doses are easily achievable in vivo. In general, a lower EC50 for ATP as compared to adenosine was observed in all PCa cells tested (Table II). This indicates a greater sensitivity and efficacy of ATP in inhibiting PCa growth as compared to adenosine. In addition, a biphasic effect of ATP was observed only at the high doses of ATP but not adenosine treatment, suggesting the possibility of two separate mechanisms for ATP and adenosine action. To date, the growth-inhibitory mechanism(s) of ATP and adenosine effects on PCa growth have not been elucidated. Therefore, the expression of purinergic receptors in the LNCaP progression model of PCa is essential in elucidating the mechanism(s).
Corresponding to previous studies on DU145 and PC3 lines (14), ATP-liganded/activated P2 receptors including P2X4, P2X5, P2X7, P2Y2 and P2Y11 were expressed in LNCaP, C4-2 and C4-2B (Figure 2). Therefore, ATP might mediate the growth-inhibitory signal through one or more of these receptors. Similarly, adenosine receptors commonly expressed in all cells of the LNCaP progression model were A2a, and A2b subtypes (Figure 2). Interestingly, the expression of A3, which has been proposed to regulate adenosine-induced cell-cycle arrest in PCa (15, 16), was not observed in this study. This indicates another possible mechanism for adenosine-induced PCa death that could occur through A2. Differential expression of purinergic receptors was observed in this study, and the divergent expression of some P2 and adenosine receptors might be an underlying cause for the different responses to ATP and adenosine between the androgen-sensitive and the castrate_resistant PCa cells. However, more study is still needed to verify the mechanisms behind this growth-inhibitory effect.

Differential migratory ability of cells in the LNCaP progression model on laminin and collagen I compared to tissue-culture plastic. A: LNCaP was shown to migrate significantly greater on laminin (p<0.05). B: C4-2 showed higher motility on laminin and collagen I (p<0.01). C: C4-2B showed significantly higher migration on collagen I (p<0.001). Significantly different at #p<0.05, *p<0.01, **p<0.001 from that on plastic on day 5 (set at 100%).
As shown in Figure 3, the non-metastatic LNCaP cells exhibited higher migratory ability on laminin (35-37), which is a major component of the prostate microenvironment (38). The highly metastatic C4-2 cell line exhibited a greater mobility on both collagen I and laminin than on plastic, corresponding to the metastatic behavior of the C4-2 cells in the progression model (20). Similarly, the bone-adaptive C4-2B cell line was shown to migrate dramatically faster on collagen I, which is a major ECM component found in the bone microenvironment (28) and is associated with PCa metastasis (39). These preferential migrations of PCa cell lines on each ECM protein corresponded to the progression of this model from non-metastatic PCa (LNCaP) to metastatic PCa (C4-2) and eventually, bone-adaptive PCa (C4-2B). ATP and adenosine did not significantly affect PCa migration on any of the extracellular matrices (Figure 4). Accordingly, ATP and adenosine could have high potential as novel PCa treatments that could effectively inhibit growth of androgen-sensitive, androgen-independent and also the bone-adaptive stages of PCa.
ATP has, overall, shown beneficial effects in patients with cancer. ATP led to a favorable outcome in patients with lung cancer in clinical trials (7-9, 40-46) when infused at a rate of 50-75 μg/kg/min for 12-20 h, mostly without side-effects and can be safely administered at home (40). No symptoms of cardiac ischemia were observed in any of the patients (40). Remarkably, previous research showed that intravenous ATP infusion improved patients' quality of life by preventing weight loss and increasing muscle strength, and had a favorable effect on triceps skin fold thickness and survival, especially in patients with lung cancer (8, 41, 45). Furthermore, ATP prolonged survival in weight-losing patients with stage IIIB lung cancer (43) and also improved the treatment response and resectability in those with initially unresectable colorectal liver metastases (7). Therefore, ATP has been shown to be an effective cancer therapy that can be safely administered to patients with other types of cancer. Taken together, extracellular nucleotide treatment, with ATP and adenosine, has potential as a novel treatment or adjuvant treatment to suppress prostate cancer cell growth.

ATP and adenosine had no significant effect on prostate cancer cell migration compared to the vehicle control (phosphate-buffered saline, PBS). The effects of adenosine and ATP on cell migration were studied using tissue culture plastic (A-C) compared to different extracellular matrix proteins: laminin (D-F) and collagen I (G-I).
Acknowledgements
Funding at the University of Delaware was provided by the University of Delaware Center for Translational Cancer Research, with additional support from the Faculty of Science, Mahidol University.
Footnotes
This article is freely accessible online.
- Received November 30, 2016.
- Revision received January 21, 2017.
- Accepted January 25, 2017.
- Copyright© 2017, International Institute of Anticancer Research (Dr. George J. Delinasios), All rights reserved
References
In this issue


Jump to section
Related Articles
Cited By...
- 8-Chloroadenosine Induces ER Stress and Apoptotic Cell Death in Cholangiocarcinoma Cells
- Augmentation of extracellular ATP synergizes with chemotherapy in triple negative breast cancer
- Adenosine Induces Autophagy in Cholangiocarcinoma Cells
- Inhibitory Effects of ATP and Adenosine on Cholangiocarcinoma Cell Proliferation and Motility