


Abstract
Background/Aim: MicroRNAs (miRNAs) transported in melanoma-derived exosomes function as intercellular messengers supporting tumor survival and progression. Hypoxia increases melanoma phenotypic plasticity, drug resistance, and metastasis. Materials and Methods: We determined the miRNA profiles in exosomes derived from melanoma cells grown under hypoxic and normoxic conditions by microarray analyses and reverse transcription-polymerase chain reaction (RT-PCR) in order to analyze the potential influence of vesicle-transported miRNAs on cancer-related pathways and transcriptional programs. Results: Despite phenotypical differences of the four cell lines used, their exosomes shared the majority of miRNAs. The levels of three miRNAs were higher in normoxic exosomes, whereas 15 miRNAs were significantly more abundant under hypoxic conditions. Pathway analysis pointed at several cellular processes contributing to proliferation, drug resistance, and modification of the tumor microenvironment, including immunosuppression. Conclusion: The miRNA-expression profiles of exosomes from patient-derived melanoma cells are modified by oxygen concentration and reflect the phenotypic changes of melanoma cells under different growth conditions.
Exosomes are 30-150 nm-sized vesicles of endocytic origin that are released from most cell types, including epithelial cells, B- and T-cells, dendritic cells and tumor cells (1, 2). They can be found in bodily fluids such as blood, breast milk, saliva and urine (3). Exosomes are able to transfer different molecules from donor to recipient cells, most interestingly including active enzymes and functional RNA molecules (4, 5). The transport of microRNAs (miRNAs) is especially interesting because of the potential of these molecules to modulate gene expression in target cells. miRNAs are small non-coding RNA molecules that regulate messenger RNA (mRNA) translation. Usually, they act as negative regulators of protein synthesis by binding to complementary sequences in their target transcripts. miRNA–mRNA complexes cannot be translated, and often such RNA duplexes are degraded. miRNAs have been found to control the expression of more than 30% of human genes (6, 7). miRNAs are ubiquitously expressed in all eukaryotes, and since they control almost every cellular event, alterations in their expression can lead to pathological conditions, including cancer. Many dis-regulated miRNAs have been identified in melanoma cells in comparison to normal melanocytes, and their contribution to melanoma malignancy has been demonstrated (8-11).
Melanoma cells release greater amounts of exosomes than normal melanocytes, and substantial differences in exosomal miRNA profiles have been observed (5, 12). Specific profiles of exosome-derived miRNAs in the plasma of patients with melanoma also reflect the tumor stage (13). Therefore, exosomal miRNAs are considered promising molecular biomarkers for diagnosis and prognosis.
Through the transfer of miRNAs, exosomes function in the regulation of local and systemic processes. Melanoma-derived exosomes contribute to cancer progression. They promote migration of endothelial cells and affect angiogenesis, for instance by transferring miR-9 to recipient cells, which activates the Janus kinase/signal transducers and activators of transcription (JAK/STAT) pathway (14). They increase the metastatic potential of primary tumors by transferring MET proto-oncogene receptor tyrosine kinase (MET) into bone marrow progenitor cells to drive them towards a pro-metastatic phenotype (15), and prepare sentinel lymph nodes to become niches for melanoma spread and growth (16). They also influence the tumor environment by remodeling the stroma and promoting tumor immunosuppression (17). Hypoxic conditions promote the release of exosomes with specific capacities. Hypoxic cancer-derived exosomes promote immune evasion by inhibiting natural killer (NK) cell function (18), and angiogenesis by targeting factor inhibiting hypoxia inducible factor 1 (HIF1) with exosomal miR-135b (19).
In the present study, we aimed to identify all miRNAs exported in exosomes from different patient-derived DMBC melanoma populations grown under normal oxygen concentrations or under severe hypoxia. For the most abundant miRNAs and the most differentially expressed under both conditions, a functional analysis was performed using different bioinformatic approaches.
Materials and Methods
Cell culture and isolation of exosomes. Patient-derived melanoma cell lines, DMBC9, -10, -11, and -12 were grown in non-adherent flasks in serum-free stem cell medium (SCM) under normoxic (21% O2) or hypoxic (1% O2) conditions as previously described (20). Exosomes were isolated by differential centrifugation (21). The identity of exosomes was confirmed through detection of characteristic surface markers. Exosomes were adsorbed to latex beads, stained with antibodies to human CD63 conjugated to phycoerythrin (anti-CD63-PE) or to human CD9 conjugated to fluorescein (anti-CD9-FITC) and analyzed by flow cytometry (21). Appropriate isotype control antibodies served as negative control.
Total RNA isolation from exosomes. Total RNA was extracted using miRCURY RNA Isolation Kit-Biofluids (Exiqon, Vedbaek, Denmark) according to the manufacturer's protocol. The quality of the isolated RNA was evaluated with NanoQuant Infinite M200 Pro (Tecan Austria GmbH., Grodig, Austria) and Bioanalyzer 2100 with Total RNA Nano Kit (Agilent Technologies, Santa Clara, CA, USA). Samples with A260/A280 ratio between 1.80 and 2.20 were used for subsequent microarray experiments.
Microarray analysis of miRNA expression. The microarray miRNA analysis was carried out at the Department of Physiological Sciences, Warsaw University of Life Sciences, Poland. Total RNA (100 ng) was end-labeled with cyanine 3-pCp following the manufacturer's recommendations using Agilent's miRNA Complete Labeling and Hybridization kit (Agilent Technologies). Labeled miRNA was hybridized to Agilent Technologies' Human 8×60k miRNA microarrays, custom designed with eArray platform (AMADID 049284) based on Sanger miRBase v.19 (22). One array covers 2164 human miRNA probes in 30 copies, including Spike-In controls. After the hybridization, microarray images were captured using an Agilent DNA Microarray Scanner with default settings for miRNA microarrays. Scanned TIFF images were processed using Agilent Feature Extraction Software version 10.10.1.1. Raw fluorescent intensity signals were used to find the most abundant miRNAs in exosomes released from DMBC cells from both normoxic and hypoxic cultures.
Quantitative real-time two step reverse transcription-polymerase chain reaction (RT-PCR). The levels of several miRNAs selected by their different expression levels under normoxia versus hypoxia were determined by real-time quantitative RT-PCR using TaqMan® MicroRNA Assays (Applied Biosystems, Carlsbad, CA, USA) with pre-formulated primer and probe sets designed to detect and quantify mature miRNAs. The forward primer sequence for the validated miR-494 was 5’- TGAAACATACACGGGAAACCT-3’. RT reactions and PCR amplifications were carried out in accordance with the conditions specified in the instructions. The products were verified by the thermal dissociation method.
Bioinformatic analysis. Raw fluorescent intensity signals were subjected to bioinformatic analysis with AgiMicroRNA package of R 3.3.1 statistical environment (23). miRNA expression data were robust multiarray average (RMA)-normalized and only miRNAs present in three out of four populations were included in further analysis (miRNAs were filtered with boolean flag as detected/non-detected). Statistical significance of differentially expressed miRNAs (hypoxia vs. normoxia) was determined using an unpaired t-test followed by Benjamini-Hochberg false-discovery rate (FDR) correction (24). miRNAs with log2 fold-change (FC) ≥1.58, and FDR ≤0.05 were considered as being differentially expressed. Kyoto Encyclopedia of Genes and Genomes (KEGG) pathway enrichment for differentially expressed miRNAs was prepared with DNA Intelligent Analysis (DIANA) – miRpath web tool (25). During the analysis, microT (a parameter predicting RNA:miRNA binding quality based on Watson-Crick base pairing) value of 0.8 and corrected p-value of 0.05 or less were used as cut-off threshold.
The target transcripts of miRNAs expressed in exosomes from DMBC cells grown under normoxic and hypoxic conditions were identified with Chipster platform (26) using three implemented tools: TargetScan, miRDB and DIANA-microT. The gene list obtained as a result of intersection of all three tools, was subjected to DAVID (27) for PANTHER pathways analysis. To identify statistically significant pathways one-tailed Fisher's exact test with additional Benjamini-Hochberg correction was used.
Heatmaps of exosomal miRNA expression in normoxia and hypoxia were prepared using Cluster 3.0 and Java Treeview Software (Stanford University, Stanford, CA, USA) with un-centered correlation similarity metrics and complete linkage hierarchical clustering. Boxplots representing differential expression of miRNAs in hypoxic and normoxic exosomes, and scatterplots representing correlation among exosomal miRNA expression in different DMBC populations under hypoxic and normoxic conditions, and hierarchical clustering dendrograms were prepared in the free open source R 3.3.1 statistical environment (R Foundation, University of Economics and Business, Vienna, Austria).
Results
Identification of exosomes and exosomal miRNAs. Exosomes were isolated from four patient-derived melanoma populations (DMBC9, DMBC10, DMBC11 and DMBC12). DMBC populations were grown concurrently under normoxic (21% O2) and hypoxic (1% O2) conditions. Both culture types were used to collect exosomes. Melanoma cell-derived exosomes produced in serum-free medium were collected by ultracentrifugation and characterized by antibody staining of CD9 and CD63 measured by flow cytometry (Figure 1A). Subsequently, total RNA including small RNA was isolated using standard procedures. The quality and quantity of isolated RNA was estimated using a Bioanalyzer 2100. The small peak at 25-30 s represents the fraction enriched in miRNAs (Figure 1B). The lack of 18S and 28S ribosomal RNA in Bioanalyzer distribution profiles confirmed that the isolated exosomal RNA was devoid of contamination by cellular RNA.

Exosomes isolated from DMBC populations grown under normoxic and hypoxic conditions. A: Exosomes isolated from the cell culture supernatant of DMBC11 melanoma cells were stained with fluorescently labeled antibodies to CD9 and CD63 and analyzed by flow cytometry (lower plot). Staining with appropriate isotype control antibodies (upper plot) served as negative control. B: Representative Bioanalyzer 2100 analysis for normoxic and hypoxic exosomes. Exosomal RNA lacks 18 S and 28 S rRNA bands compared to total cellular RNA. The region enriched in miRNAs (25-30 s) is marked with a circle.
Comparison of miRNA profiles between normoxic and hypoxic exosomes. The miRNAs detected in at least three out of four different DMBC populations, under both hypoxia and normoxia, were included in further analyses. In normoxic exosomes, 360±17 miRNAs (mean±SD of the four cell lines) were found, whereas hypoxic exosomes contained a significantly higher number of miRNAs (443±4, p=0.005) (Figure 2A). The dendrograms of hierarchical clustered miRNA expression data allowed two miRNA expression clusters to be defined, dependent on oxygen concentration (Figure 2B).
A total of 298 miRNAs were commonly found in both hypoxic and normoxic DMBC exosomes, while 50 and 130 miRNAs were uniquely identified in normoxic and hypoxic exosomes, respectively (Figure 2C). The expression profiles of the 298 common miRNAs for both normoxic and hypoxic exosomes were highly correlated, with a Pearson coefficient of 0.926 (p=2.2×10⁻¹⁶) (Figure 2D). In addition, the high overall correlation between all miRNAs present in hypoxic and normoxic exosomes (Table I) indicates that the miRNA pattern in exosomes reflects the cell type and growth conditions (in this case the oxygen level) rather than the phenotypic differences of the investigated DMBC populations.
Correlation between all miRNAs present in hypoxic and normoxic exosomes of the investigated DMBC populations.
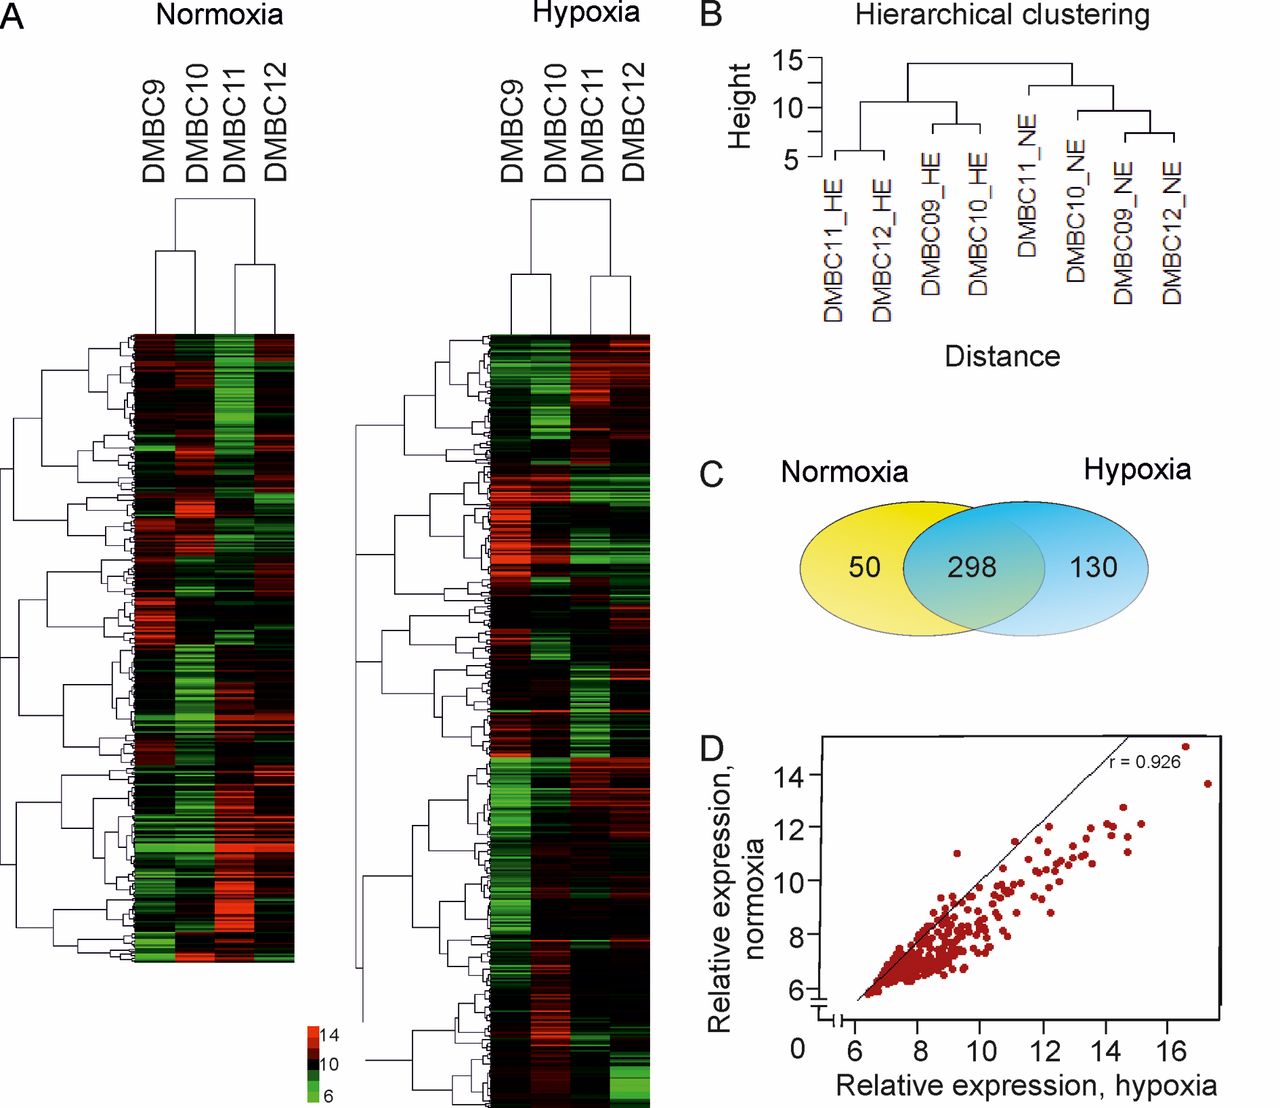
Differential miRNA expression in normoxic and hypoxic exosomes from DMBC populations. A: Heatmap depicting the microarray expression analysis of all miRNAs detected in exosomes from normoxic and hypoxic DMBC melanoma populations. Green and red represents miRNAs with lower and higher expression, respectively, after robust multiarray average normalization. B: Unsupervised hierarchical clustering of normalized miRNA expression data reveals two distinct clusters of normoxic and hypoxic DMBC populations. C: Venn diagram representing differential expression profiles of miRNA in normoxic and hypoxic exosomes from DMBC populations. D: Pearson correlation analysis of the uniformly expressed miRNAs in exosomes from both normoxic and hypoxic conditions.
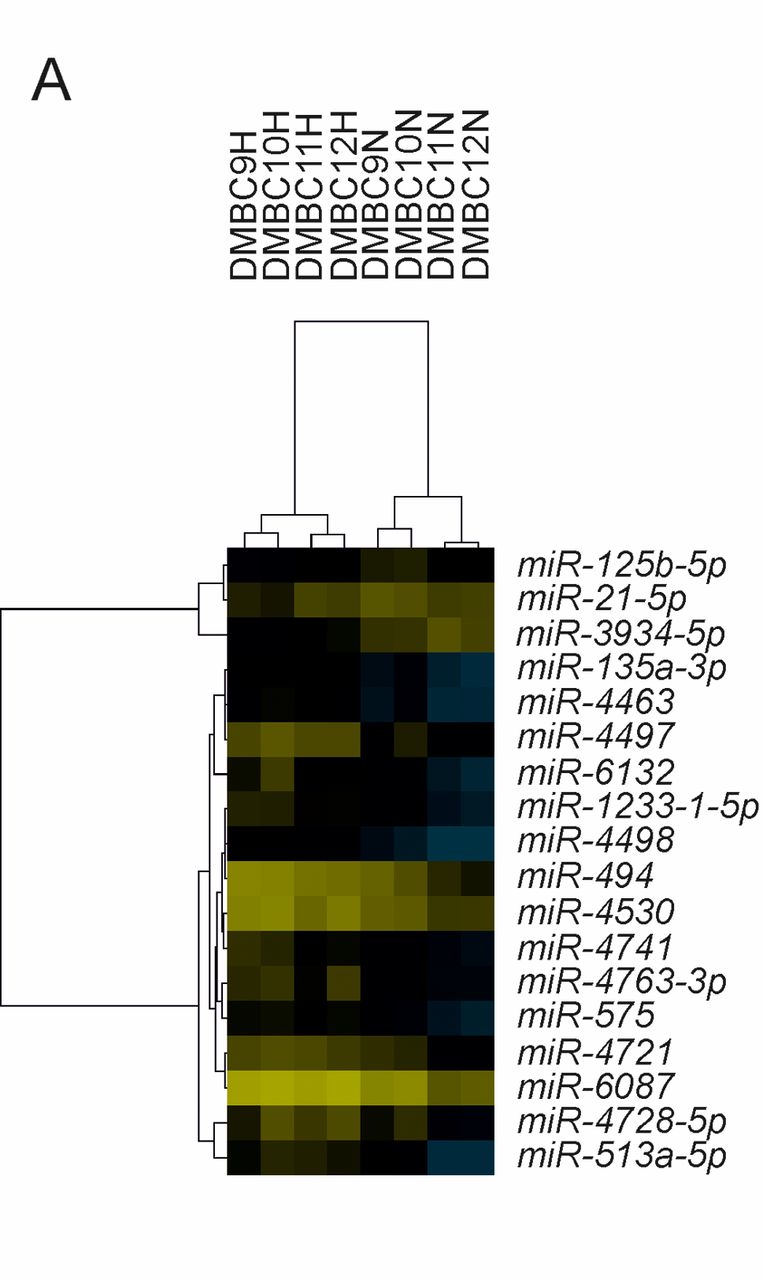
Differentially expressed miRNAs in hypoxic and normoxic exosomes belong to distinct functional categories. In concordance with other published research (28), hypoxic exosomes were found to contain a significantly greater number of miRNAs (p=0.005). In order to find miRNAs differentially expressed between normoxic and hypoxic DMBC exosomes, we used the AgiMicroRNA Bioconductor package for R (23). With thresholds set to FC >3 (log2FC >1.58) and FDR<0.05, we found 18 differentially expressed miRNAs (Table II). The levels of three miRNAs were higher in normoxic exosomes, whereas those of 15 miRNAs were higher in hypoxic exosomes (Figure 3A). The three miRNAs present at higher levels in normoxic exosomes were miR-125b-5p, miR-21-5p and miR 3934-5p. The miRNAs most strongly up-regulated in hypoxic exosomes (FC >4) were miR-494-5p, miR-4497 and miR-513a-5p. The boxplots in Figure 3B show the expression levels of all differentially expressed miRNAs in exosomes released from all DMBC populations. For validation of the normalized microarray results, we chose miR-494-3p, and its expression for all four DMBC populations under normoxic and hypoxic exosomes was evaluated with quantitative PCR (Figure 3C). Furthermore, another three miRNAs isolated from normoxic/hypoxic DMBC 11 cells were assessed by quantitative PCR (data not shown). The reduction of miR-125b-5p (by 20%) and miR-3934-5p (by 80%) under hypoxic conditions was confirmed, while analysis of miR-135a-3p did not show any significant differences.
In order to better understand the role of differentially expressed miRNAs present in exosomes from normoxic and hypoxic DMBC populations, we used the DIANA-miRpath tool to identify KEGG pathways associated with miRNAs up-regulated under normoxic or hypoxic exosomes (Table III). Only three pathways (p<0.05) were enriched in three miRNAs up-regulated in normoxic exosomes: ‘Glycosphingolipid biosynthesis – lacto and neolacto series’ (hsa00601), ‘Mitogen-activated protein kinase (MAPK) signaling pathway’ (hsa04010), and ‘Hippo signaling pathway’ (hsa04390). For the 15 miRNAs up-regulated under hypoxia, 12 pathways were identified, with ‘Cell adhesion molecules’ (hsa04514), ‘Glycosphingolipid biosynthesis – lacto and neolacto series’, ‘proteoglycans in cancer’ (hsa05205), and ‘avian erythroblastosis oncogene B (ErbB) signaling pathway’ (hsa04012) listed as the most statistically significant ones.
Functional analysis of the most abundant exosomal miRNAs. Next, we identified subsets of miRNAs with the highest expression under both conditions (Figure 4A). Under normoxia, miR-4454 was the most abundant, followed by miR-6087 and miR-1268a, whereas under hypoxia, miR-6087 was the most abundant, followed by miR-4454 and miR-4299. The top 10 abundant miRNAs constituted 52.1% and 62.3% of total miRNA expression under normoxia and hypoxia, respectively. miR-6087 was the miRNA with the highest increase in percentage abundance in hypoxic exosomes when compared to normoxic ones (from 8.7% to 21.5%). The percentage abundance for miR-494 under hypoxia was markedly increased, comprising 4.1% of all miRNAs present under hypoxia.
For the top 20 most abundant miRNAs in exosomes released from DMBC melanoma populations, putative targets were identified using three miRNA target recognition tools: TargetScan, miRDB and DIANA-microT. Four miRNAs, miR-6087, miR-6088, miR-6089 and miR-6125, were not included in the analysis since they were absent from the DIANA-microT database. As a result of the intersection of all three tools, we obtained a list of 1,139 miRNA targets from normoxic, and 1,087 from hypoxic exosomes (Figure 4B).
miRNAs differentially expressed in exosomes from hypoxic and normoxic DMBC populations
Both gene lists were submitted to the DAVID functional annotation tool to find the biological relevance of the identified genes. Using the PANTHER database, 18.9% of genes from normoxic and 18.1% of those from hypoxic exosomes were matched to signaling pathways (Figure 4C). These include ‘Angiogenesis’, ‘VEGF signaling pathway’ and ‘Ras pathway’ for normoxic exosomes, and ‘Integrin signaling pathway’, ‘Signaling pathways regulating pluripotency of stem cells’, and ‘T-cell activation’ for hypoxic exosomes, among others.
Discussion
Tumor hypoxia drastically changes the mRNA and miRNA expression program in melanoma (10). Under hypoxic conditions, increased cellular heterogeneity, phenotypic plasticity, drug resistance, and enhanced migration and metastasis were observed (29, 30). We were interested in how hypoxia changes the miRNA content of exosomes and how these changes might contribute to tumor survival and progression. Melanoma-derived exosomes can be taken up by neighboring melanoma cells, constituting a cross communication of cancer cells, or by other cells in the microenvironment such as fibroblasts, endothelial cells, and immune cells. After their transport through the circulatory or the lymphatic systems, exosomes are also taken up by cells at distant sites e.g. to prepare metastatic niches (16). Theoretically, exosomes can also be used to clear the cellular interior of miRNAs that are not profitable for the actual status of the cell. For our miRNA analysis, four different populations of patient-derived melanoma cells (DMBC9-12) were grown under normoxic and hypoxic conditions and their exosomal miRNA composition was determined by microarray analysis. Despite the fact that the four populations differ substantially in background and phenotypic traits (31, 32), they were found to share the vast majority of miRNAs released by both, hypoxia- and normoxia-derived exosomes (85.6% and 69.6%, respectively). Among the most abundant miRNAs in DMBC-released exosomes were miR-4454, miR-6087, miR-1268a and miR-1246 for normoxic exosomes, and miR-6087, miR-4454, miR-4299 and miR-494 for hypoxic exosomes. miR-4454 is a nuclear factor kappa B (NFĸB)-inducible miRNA in tumor necrosis factor alpha (TNFα)-stimulated HeLa cells (33). miR-4454 is elevated in the urinary exosomes from patients with bladder cancer and serves as a potential biomarker for this tumor (34). This miRNA targets three transcripts from the Hippo signaling pathway: adenomatous polyposis coli (APC), tyrosine 3-monooxygenase/tryptophan 5-monooxygenase activation protein beta (YWHAB) and casein kinase 1 epsilon (CSNK1E). Inactivated Hippo signaling promotes proliferation and the expression of anti-apoptotic genes (35). miR-1246 was associated with metastatic melanoma with high specificity and sensitivity. Due to its high concentration in plasma of patients with melanoma it was suggested as a diagnostic marker of metastatic disease (36).
Comparing the total expression profiles of miRNAs present in normoxic and hypoxic exosomes, the majority of miRNAs, 298 in total, were uniformly present at very similar relative expression levels. In concordance with previous research (28), hypoxic conditions increased the overall quantity and the number of individual miRNAs exported in exosomes. The application of stringent threshold settings resulted in 15 up-regulated miRNAs, and three down-regulated miRNAs in hypoxic exosomes compared to normoxic exosomes. Analysis of the functions of miRNAs up-regulated in hypoxic exosomes revealed that they were involved in the control of proliferation and drug resistance (MAPK, ErbB and RAS signaling), cell-to-cell interactions and modification of tumor microenvironment (‘Proteoglycans in cancer’, ‘Cell adhesion molecules’), protein misfolding (‘Glycosphingolipid biosynthesis’) and specific tumor-initiating cell properties (‘Signaling pathways regulating pluripotency of stem cells’).
For the four miRNAs that were most dramatically enriched in hypoxic exosomes (miR-494, miR-6087, miR-513a-5p, and miR-4497), functions have been described in other cancer types. Especially interesting is the marked increase in miR-494 abundance at low oxygen levels. miR-494 is induced by extracellular signal–regulated kinase 1/2 (ERK 1/2) in non-small-cell lung cancer. It promotes resistance to tumor necrosis factor-related apoptosis-inducing ligand (TRAIL) by diminution of BCL2-interacting mediator of cell death (BIM) expression in these cells (37). miR-494 regulates the expression of the well-established tumor suppressor phosphatase and tensin homolog (PTEN) (38). Moreover, it is involved in immune evasion of cancer cells by inhibiting macrophage polarization and switching them towards the immunosuppressive M2 type (39). In murine tumor models, it was shown that miR-494 regulates the activity of myeloid-derived suppressor cells, a major type of immunosuppressive cell (40). In their experimental system, miR-494 was induced by tumor-derived transforming growth factor beta (TGF-β). Our results suggest that exosomal transfer can contribute to an increased level of miR-494 in myeloid cells to strengthen immunosuppression under hypoxic conditions. Furthermore, it was demonstrated that tumor-derived miR-494 induces angiogenesis (41). Delivery of miR-494 to endothelial cells via a vesicle-mediated route activated the phosphoinositide 3-kinase/v-Akt murine thymoma viral oncogene (PI3K/AKT) pathway by down-regulation of PTEN, resulting in an increase of the endothelial nitric oxide synthase pathway and increased angiogenesis.


Differential analysis of normoxic and hypoxic exosomal miRNAs. A: Heatmap representing normalized statistically significant (false-discovery rate ≤0.05) differentially expressed (fold change >3) miRNAs from both normoxic (N) and hypoxic (H) DMBC-derived exosomes. Overexpressed miRNAs are displayed in yellow whereas down-regulated microRNAs are displayed in blue. B: Boxplots representing the normalized expression values (NEV) of exosomal miRNAs derived from DMBC melanoma populations grown under hypoxia and normoxia. Significantly different at *p≤0.05, and **p≤0.01. C: The levels of miR-494 were determined by real-time quantitative reverse transcription-polymerase chain reaction using TaqMan® MicroRNA Assays in RNA isolated from exosomes from all normoxic and hypoxic DMBC populations. On the y-axis the inverse of the cycle number (Cn) at the crossing point is shown.
Kyoto Encyclopedia of Genes and Genomes (KEGG) pathways for differentially expressed exosomal miRNAs.

Analysis of the most abundant miRNAs present in exosomes from normoxic and hypoxic DMBC populations. A: Pie chart depicting the most abundant miRNAs detected in exosomes released from normoxic and hypoxic DMBC melanoma populations. Percentages are based on the raw expression values relative to the total raw expression values for all detected miRNAs. B: Venn diagram depicting target transcripts of the most abundant miRNAs detected in exosomes released from normoxic and hypoxic DMBC melanoma populations. Three target prediction tools were used: TargetScan, miRDB and DIANA-microT. Four miRNAs: miR-6087, miR-6088, miR-6089 and miR-6125 were not included in the analysis since they were absent from the DIANA-microT database. The intersection of all three databases resulted in the identification of 1,139 and 1,087 target transcripts of miRNAs from normoxic and hypoxic exosomes, respectively. C: A total of 1,139 and 1,087 target transcripts of miRNAs from normoxic and hypoxic exosomes, respectively, were introduced to the PANTHER annotation tool and 18.9% and 18.1% of genes, respectively, were successfully annotated to PANTHER pathways. The bars represent the negative natural logarithm of p-values calculated for the annotated pathways using the DAVID annotation tool.
miR-513a-5p and miR-6087 are highly up-regulated in colorectal cancer and in prostate cancer, respectively (42, 43). miR-513a-5p targets receptor tyrosine kinase-like orphan receptor 1 (ROR1), a tyrosine kinase receptor involved in non-canonical Wingless-type MMTV integration site family member (WNT) signaling, which is inversely expressed compared with the ROR2 gene. Increased expression of ROR2 switches melanoma to a more invasive phenotype (44). Together with miR-6086 and miR-6088, miR-6087 is found at high levels in undifferentiated embryonic stem cells, and their expression is lowered during endothelial differentiation (45). Other miRNAs relevant for melanoma pathogenesis include miR-4498, which was isolated at higher levels from hypoxic exosomes and might influence immune responses by targeting CD83, an immunostimulatory molecule critical for the activation of T-cells (46). miR-21, which we found in both normoxic and hypoxic exosomes, was described as promoting a pro-metastatic phenotype when delivered to normoxic oral squamous cell carcinoma cells by increasing snail family transcriptional repressor 1 (SNAI1) and vimentin expression (47). miR-21 is embedded in a regulatory circuit with miR-4728, one of the miRNAs with increased exosomal levels under hypoxia. miR-4728 is encoded in an intron of the human epidermal growth factor receptor 2 (HER2) gene, a well-known oncogene in breast cancer (48). miR-4728 was identified as tumor suppressor in breast cancer antagonizing MAPK signaling. The regulatory circuit engaging miR-4728 and miR-21 also includes the HER2 protein (49). HER2 signaling promotes the transcription of miR-21, while miR-4728 stabilizes miR-21. Interestingly, miR-21 is one of the miRNAs which we found to be reduced in hypoxic exosomes. Moreover, miR-4728 was the only miRNA that was up-regulated in melanoma cells when grown under hypoxic conditions, as revealed in our previous study (50). The subset of cellular miRNAs differentially expressed under hypoxic and normoxic conditions barely corresponds to the miRNAs differentially expressed in exosomes. This observation corroborates the notion that miRNAs are specifically released in exosomes in a tightly regulated process.
Analysis of the potential miRNA target transcripts revealed that they were enriched in pathways related to angiogenesis (‘Angiogenesis’, ‘VEGF signaling’), proliferative receptor signaling [‘Platelet–derived growth factor (PDGF) receptor signaling’, ‘Epidermal growth factor (EGF) receptor signaling’ or ‘Fibroblast growth factor (FGF) receptor signaling’) and re-modelling of extracellular matrix (‘Integrin signaling pathways’). The targets of miRNAs isolated from hypoxic exosomes were additionally linked to immune evasion (‘T-Cell activation’).
Under hypoxic conditions, melanoma cells exhibit a phenotypic switch promoting invasiveness (29). In addition to the potential target genes already mentioned, two genes critical for melanoma genesis and progression can be targeted by exosomal miRNAs. Microphthalmia-associated transcription factor (MITF) is a target of miR-1246, and miR-6088 potentially targets E-cadherin. MITF depletion promotes a metastatic phenotype and an increase in the mesenchymal markers SNAI1 and fibronectin (51). Thus, by targeting neighboring melanoma cells, vesicle-transferred miRNAs may facilitate invasion and metastases.
In conclusion, the results of the current study show clearly that patient-derived melanoma populations secrete exosomes that differ in their miRNA profiles as a function of oxygen concentration. Since a hypoxic environment promotes a phenotype switch that results in a more highly invasive potential of cancer cells, the quantitative and qualitative analysis of miRNA profiles might supplement prognosis of melanoma in the clinical environment.
Acknowledgements
The Authors wish to thank Dr. Malgorzata Sztiller-Sikorska for technical support, and Professor Malgorzata Czyz for generous patronage and helpful discussions. This research was supported by grants no. 2012/05/B/NZ2/00574 and no. 2016/21/B/NZ7/02747 from the National Science Centre (NCN), Poland, as well as by statutory funds of the Centre of Molecular and Macromolecular Studies, Polish Academy of Sciences.
- Received August 25, 2017.
- Revision received September 27, 2017.
- Accepted October 3, 2017.
- Copyright© 2017, International Institute of Anticancer Research (Dr. George J. Delinasios), All rights reserved
References
In this issue


Jump to section
Related Articles
Cited By...
- No citing articles found.