


Article Figures & Data
Figures
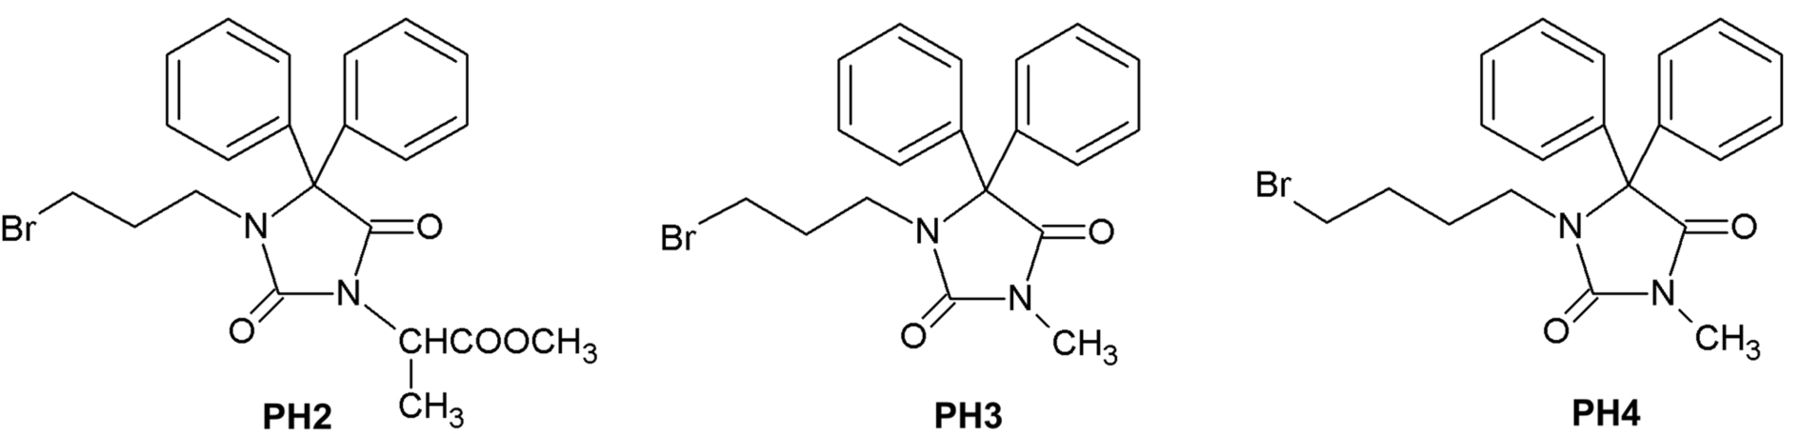
- Figure 1.
Chemical structures of three bromoalkyl phenytoin derivatives, PH2, PH3, and PH4.
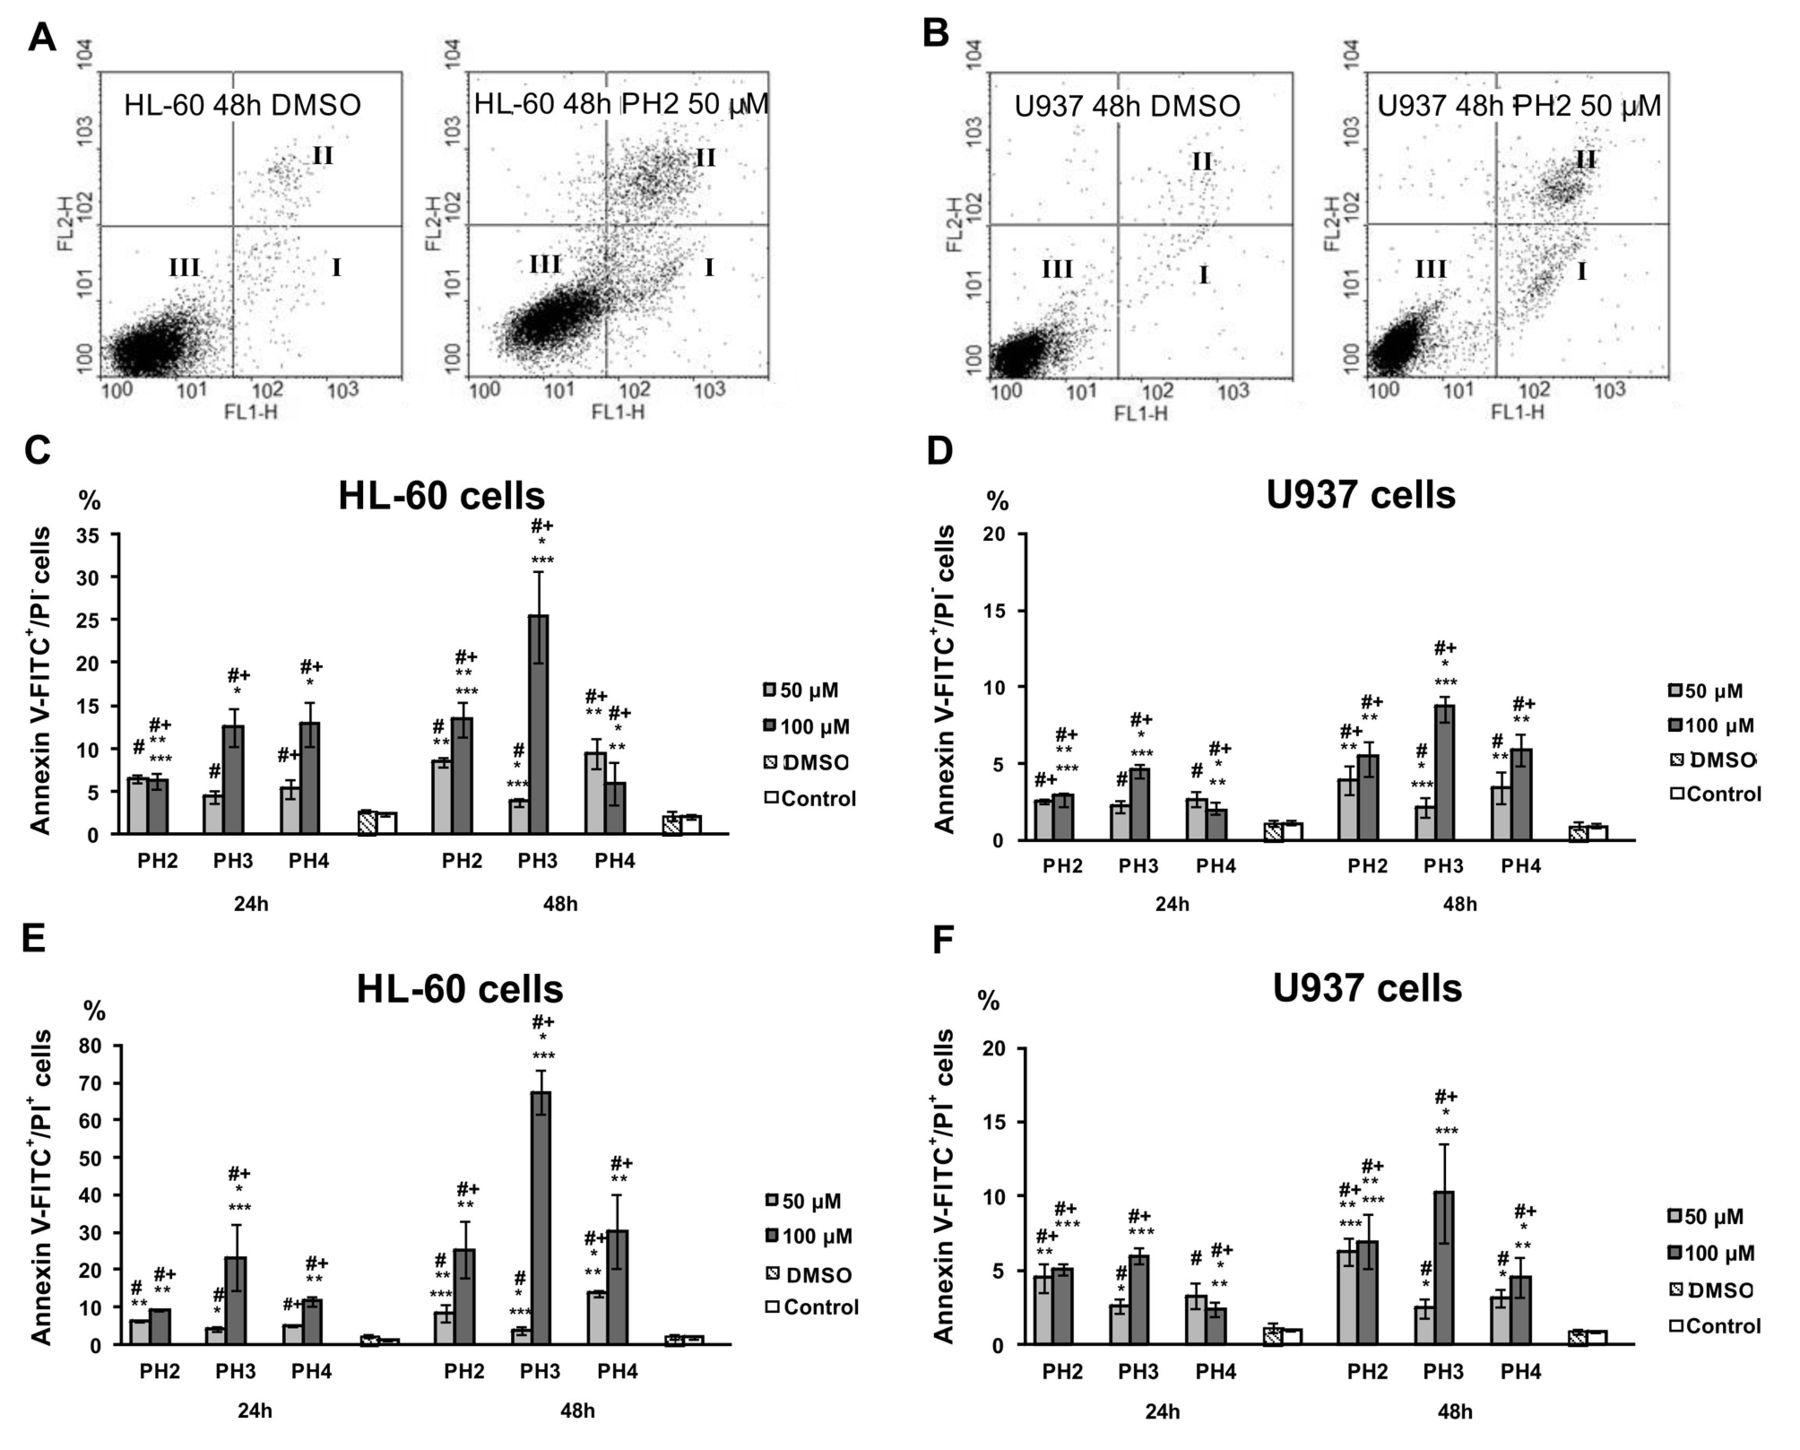
- Figure 2.
Effects of the bromoalkyl phenytoin derivatives, PH2, PH3, and PH4, on phosphatidylserine externalization and plasma membrane impairment in HL-60 and U937 cells. Representative dot plots for HL-60 (A) and U937 (B) cells obtained 48 h after application of DMSO only, and PH2; FL1-H - green fluorescence of FITC; FL2-H - red fluorescence of PI. I - early apoptotic cells with phosphatidylserine externalization (annexin V-FITC+/PI−); II - late apoptotic and necrotic cells with phosphatidylserine externalization and plasma membrane impairment (annexin V-FITC+/PI+); III – live cells (annexin V-FITC−/PI−). The frequency of annexin V-FITC+/PI− (C, D), annexin V-FITC+/PI+ (E, F) HL-60 (C, E) and U937 (D, F) cells observed 24 h and 48 h after their exposure to the action of the tested phenytoin analogs. Values significantly different at p<0.05 according to the Tukey's multiple range test: *, **, *** between the groups of leukemia cells treated with the phenytoin derivatives, # compared to controls; + between the time points.
- Figure 3.
Effects of the bromoalkyl phenytoin derivatives, PH2, PH3, and PH4, on activation of caspase-8, -9 and -3/7 in HL-60 and U937 cells. Representative histograms of HL-60 cells (A, B, C), obtained 24 h after application of DMSO only, and PH3; X axis: (A) fluorescence of Red-IETD-FMK, a caspase-8 inhibitor IETD-FMK conjugated to sulfo-rhodamine; (B) - fluorescence of Red-LEHD-FMK, a caspase-9 inhibitor LEHD-FMK conjugated to sulfo-rhodamine, (C) – fluorescence of CellEvent™ Caspase-3/7 Green Detection Reagent, a fluorogenic substrate for activated caspases-3/7. M1 – HL-60 cells without active caspase-8 (A), -9 (B) and -3/7 (C); M2 - cells with active caspase-8 (A), -9 (B) and -3/7 (C); The frequency of HL-60 (D, E, F) and U937 (G, H, I) cells with active caspase-8, -9 and -3/7 observed 24 h after after their exposure to the action of the tested phenytoin analogs. Values significantly different at p<0.05 according to the Tukey's multiple range test: *, **, *** between the groups of leukemia cells treated with PH2, PH3, and PH4, # compared to controls.
- Figure 4.
Effects of the bromoalkyl phenytoin derivatives, PH2, PH3, and PH4, on mitochondrial membrane potential of HL-60 and U937 cells. Representative dot plots of U937 cells (A) obtained 48 h after their exposure to DMSO only, and PH2; R1 - cells with the high mitochondrial membrane potential; R2 - cells with low mitochondrial membrane potential; FL2-H - fluorescence of TMRE, a cell-permeable, positively-charged, red-orange dye which readily accumulates in active mitochondria, and its retention is dependent on mitochondrial membrane potential. The frequency of HL-60 (B) and U937 (C) cells with low mitochondrial membrane potential determined 24 h and 48 h after application of PH2, PH3, and PH4. Values significantly different at p<0.05 according to the Tukey's multiple range test: *, **, *** between the groups of leukemia cells exposed to the action of the tested phenytoin analogs; # compared to controls; + between the time points.
- Figure 5.
Effects of three bromoalkyl phenytoin derivatives, PH2, PH3, and PH4, on induction of DNA breakage in HL-60 and U937 cells. The 3’OH termini in the strand breaks was analyzed by attaching FITC-labelled Br-dUTP, in a reaction catalyzed by exogenous TdT, and the incorporation of Br-dUTP into DNA strand breaks, detected by FITC-conjugated anti-BrdU antibody. The frequency of TUNEL-positive HL-60 (A) and U937 (B) cells observed 24 h after application of the three tested agents. Values significantly different at p<0.05 according to the Tukey's multiple range test: *, **, *** between the groups of leukemia cells treated with the phenytoin analogs, # compared to controls.
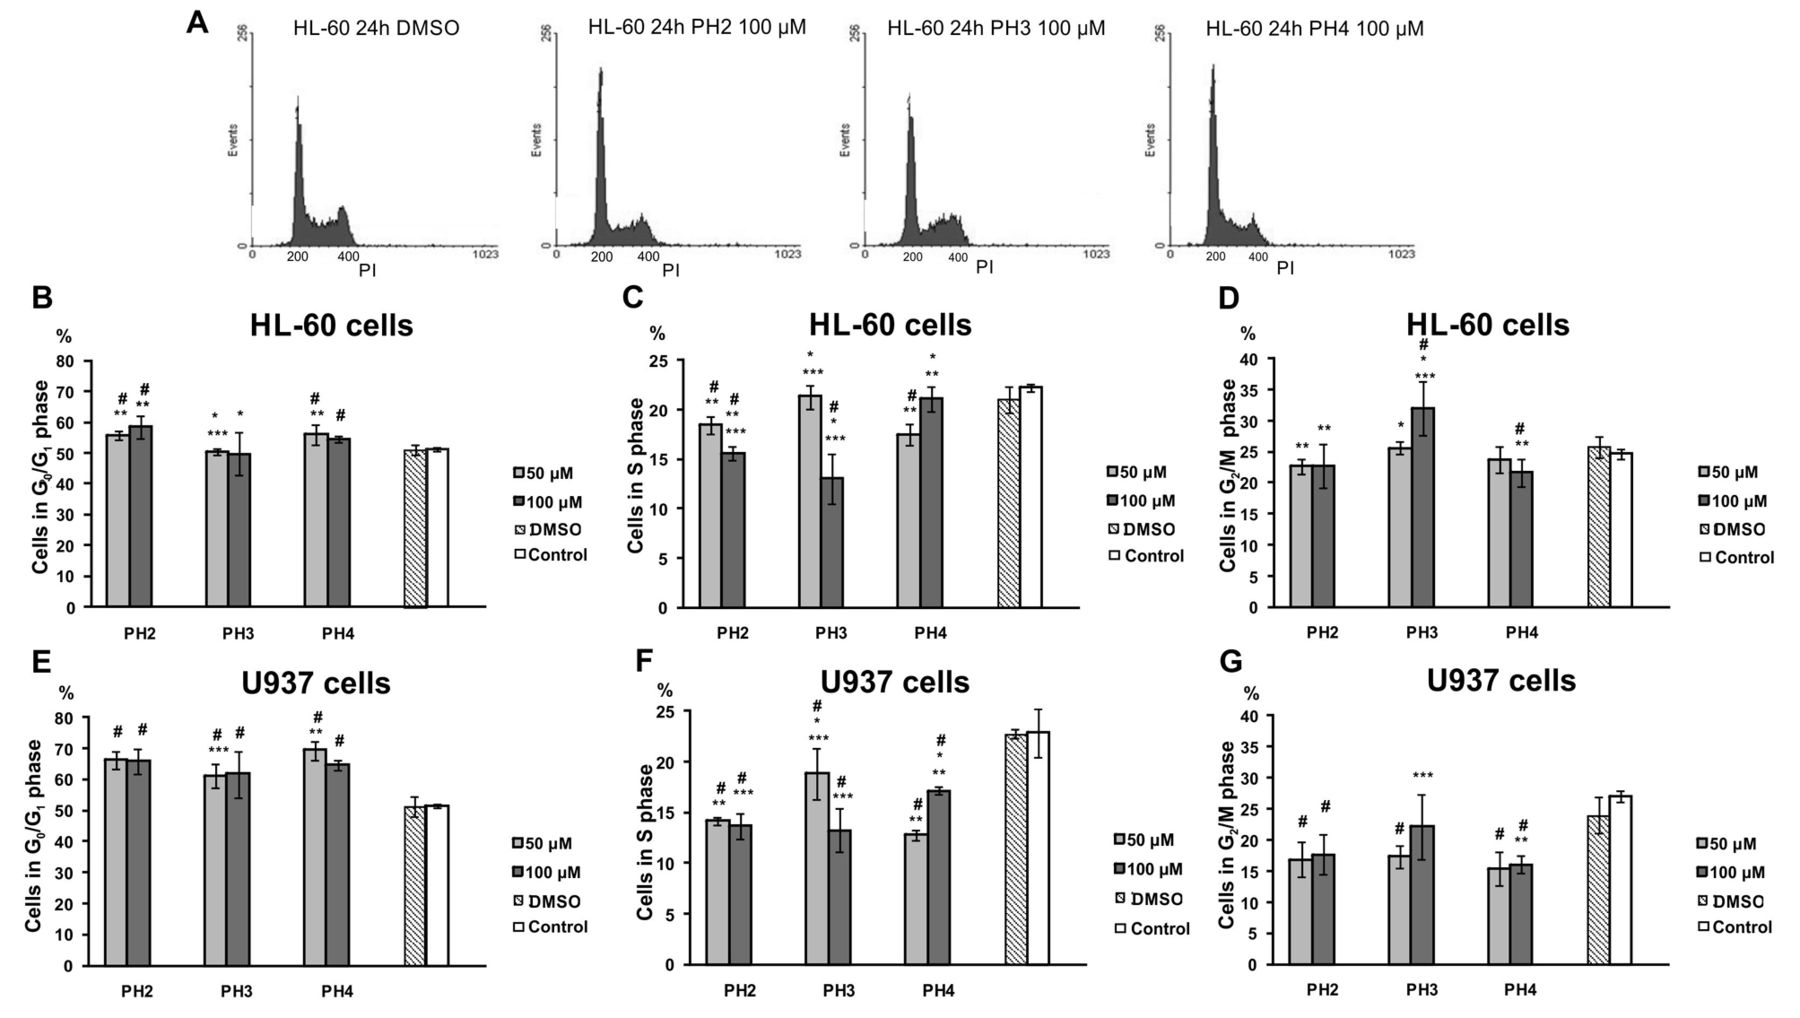
- Figure 6.
Effects of three bromoalkyl phenytoin derivatives, PH2, PH3 and PH4, on cell-cycle distribution of HL-60 and U937 cells. Representative histograms of the cell cycle of HL-60 cells (A) obtained 24 h after their exposure to the action of DMSO only, PH2, PH3, and PH4; X axis - red fluorescence of PI. The PI/RNase solution was used for staining the total DNA. The frequency of HL-60 (B, C, D) and U937 (E, F, G) cells in the particular phases of the cell cycle determined 24 h after application of the tested agents. Values significantly different at p<0.05 according to the Tukey's multiple range test: *, **, *** between the groups of leukemia cells treated with the three phenytoin analogs, # compared to controls.
- Figure 7.
The ultrastructure of HL-60 cells observed 48 h after application of PH2, PH3, and PH4, at the concentration of 50 μM and 100 μM. Compared to the control cell ultrastructure, changes in the ultrastructure of leukemia cells exposed to the action of the bromoalkyl phenytoin derivatives including chromatin distribution, perinuclear vacuolization, variety of vacuoles in cytoplasm, mitochondrial abnormalities, swelling of endoplasmic reticulum, abnormalities in the Golgi apparatus and lysosomes, and plasma membrane impairment, are visible depending on the agent applied and its concentration. N: Nucleus; M: mitochondria; L: lysosome; ER: endoplasmic reticulum, VA: autophagic vacuole; AG: Golgi apparatus.


In this issue


Jump to section
Related Articles
Cited By...
- No citing articles found.