


Abstract
Background/Aim: Androgen-androgen receptor (AR) signal is known as a powerful driver of prostate cancer progression. We previously reported the limitation of prostate-specific antigen (PSA) at diagnosis as a prognostic biomarker of prostate cancer. Although serum total testosterone (TT) level has been reported as a prognostic biomarker for prostate cancer, its usability is still controversial. We examined the potential and characteristics of TT as a biomarker. Patients and Methods: Serum TT levels of patients who underwent prostate biopsy were measured, and prostate cancer-specific survival (PCaSS), overall survival (OS), and the correlation between staging and serum TT level were analyzed. Results: Of 379 biopsied patients, 255 were diagnosed with prostate cancer. The patients were divided into five groups according to their serum TT levels; patients with serum TT levels of <2 or ≥8 ng/ml (ENDs) had worse PCaSS and OS compared with those with middle serum TT levels between 2 and 8 ng/ml (MIDs). Moreover, ENDs showed a tendency of having castration-resistant cancer with advanced stage (T4 or N1 or M1). The TNM stage in ENDs was significantly higher than in MIDs. Conclusion: Although low serum TT level has been reported to indicate worse outcome in patients with prostate cancer, this study showed that both low as well as high serum TT levels indicate poor prognosis.
Prostate cancer is the most common malignancy and the second leading cause of cancer death in males in the United States (1). Because androgen-androgen receptor (AR) signaling promotes prostate cancer progression, standard treatment for patients with advanced prostate cancer utilizes androgen-deprivation therapy (ADT) (2). However, prostate cancer often progresses to castration-resistant prostate cancer (CRPC) after several years of ADT (3). Although prostate-specific antigen (PSA), which is an AR-controlled secreted protein, is a reliable biomarker for prostate cancer, we previously reported the limitation of PSA levels at diagnosis as a prognostic biomarker of prostate cancer. Patients with prostate cancer with low PSA levels of <3.5 ng/ml paradoxically had a more advanced stage of cancer compared with those with PSA levels between 3.5 and 10 ng/mL (4). Conversely, we also reported the reduced significance of PSA at diagnosis when the level was >100 ng/ml (5).
Although serum total testosterone (TT) has been reported as a prostate cancer prognostic biomarker, its usability is still controversial. Prostate cancer decreases the serum TT level with a negative feedback from the hypothalamic–pituitary axis (6). Although a higher serum TT level is predictive of response to ADT, indicating good prognosis in patients at the metastatic stage, it was also associated with the stage progression of prostate cancer (7). In this study, we examined the potential and characteristics of TT as a prostate cancer biomarker by analyzing serum TT levels of patients with prostate cancer diagnosed by prostate cancer biopsy.
Patients and Methods
Patients. Japanese patients who underwent prostate biopsy and who were diagnosed with prostate cancer at the Kanazawa University Hospital between 2007 and 2013 were enrolled in the study. Serum TT levels of patients at diagnosis were measured, and prostate cancer-specific survival (PCaSS), overall survival (OS), CRPC-free survival (CFS), and the correlation between TNM stage and serum TT level and between Gleason score (GS) and serum TT levels were analyzed using patient charts. Serum levels of each biomarker were measured using commercially available kits according to the suppliers' instruction manuals: TT (Roche, Basel, Switzerland), PSA (Beckman Coulter, Brea, CA, USA), and CCL2 (R&D Systems, Minneapolis, MN, USA). Studies were performed after receiving approval from the Medical Ethics Committee of Kanazawa University.

Correlation between age and serum TT level and between PSA and serum TT level. (A) The correlation between age and serum TT level was analyzed [p=0.9935 and Pearson's correlation coefficient (r)=0.0005]. (B) The correlation between age and serum TT level was analyzed (p=0.3836 and r=−0.0548) and r was calculated (n=255).
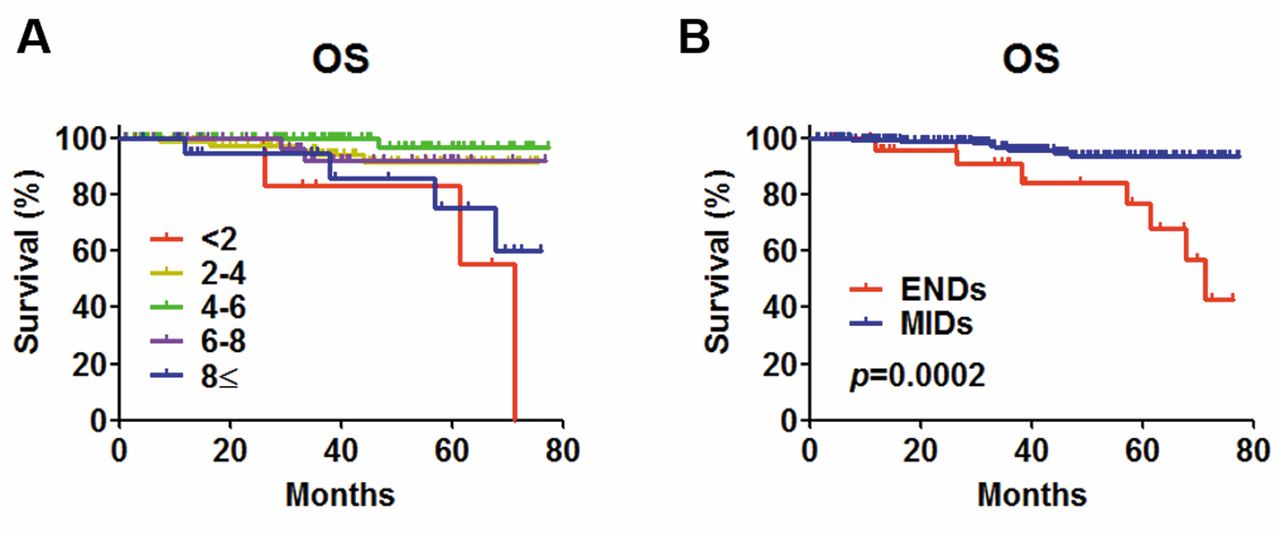
Kaplan–Meier analyses of OS based on serum TT level. (A) Patients were divided into five groups according to their serum TT levels per every 2 ng/mL. (B) Patients with the lowest (<2 ng/ml, n=7) or highest (≥8 ng/ml, n=21) serum TT levels were defined as ENDs and those with a middle serum TT levels including 2≤ TT <4 (n=95), ≤4 TT <6 (n=94), and ≤6 TT <8 ng/ml (n=38) were defined as MIDs. OS of ENDs and MIDs were analyzed (p=0.0002). Log-rank test was used for the comparison of survival distributions.
Definitions. We used the sixth edition of the TNM Classification of Malignant Tumors (Union for International Cancer Control) for the determination of TNM staging. The highest calculated GS at biopsy was used in this study. ADT included surgical castration, monotherapy using a luteinizing hormone-releasing hormone (LH-RH) analog or antagonist, and combined therapy using antiandrogens and an LH-RH analog or antagonist. CRPC was defined as the status of at least three consecutive elevations of PSA level or a change in antiandrogen due to disease progression.
Statistical analyses. Statistical analyses were performed using commercially available GraphPad Prism software (GraphPad, San Diego, CA, USA). Comparisons between the two groups were made using unpaired two-sided t-tests, Fisher's exact tests, and Chi-squared tests for trends. OS, PCaSS, and CFS were estimated using the Kaplan–Meier method. Log-rank test was used for comparison of survival distributions. In all analyses, a p-value of <0.05 was considered statistically significant.
Results
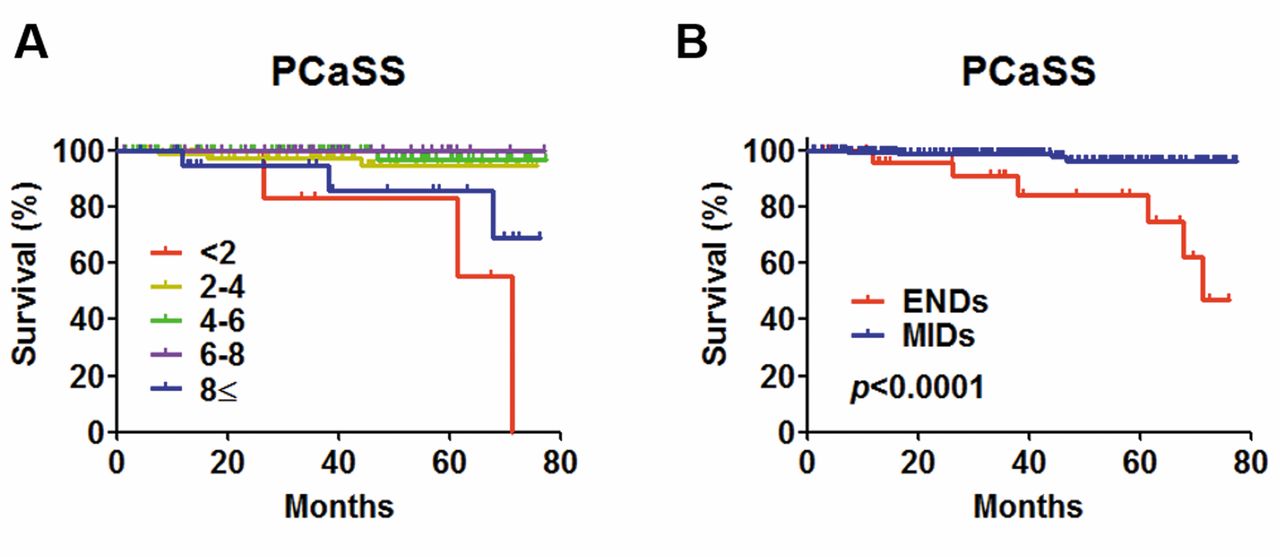
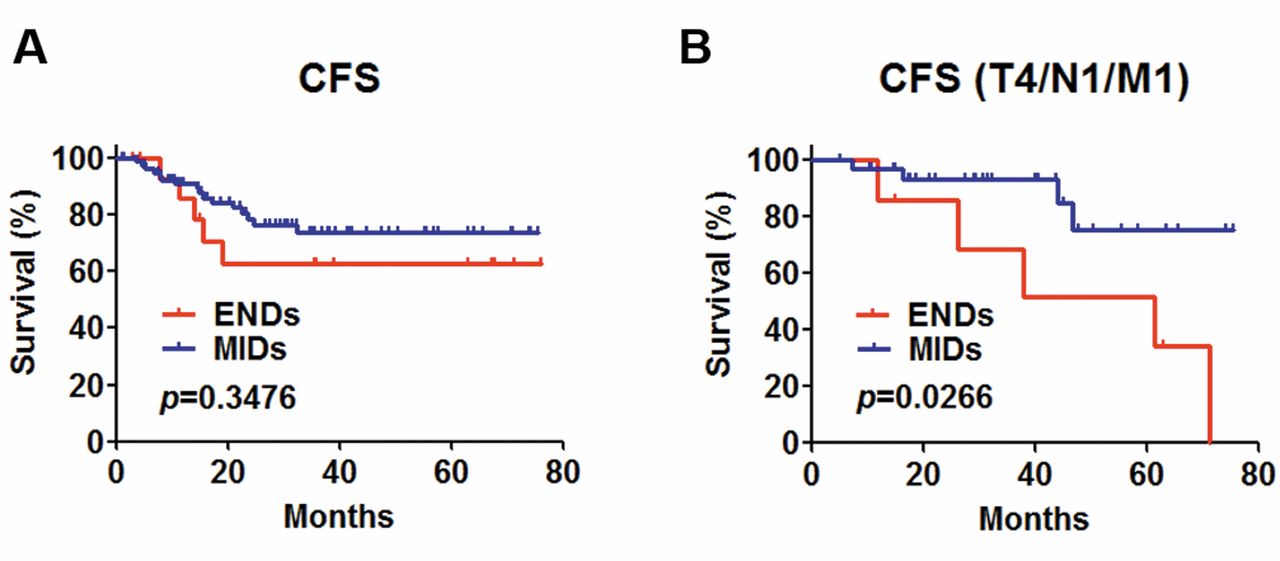
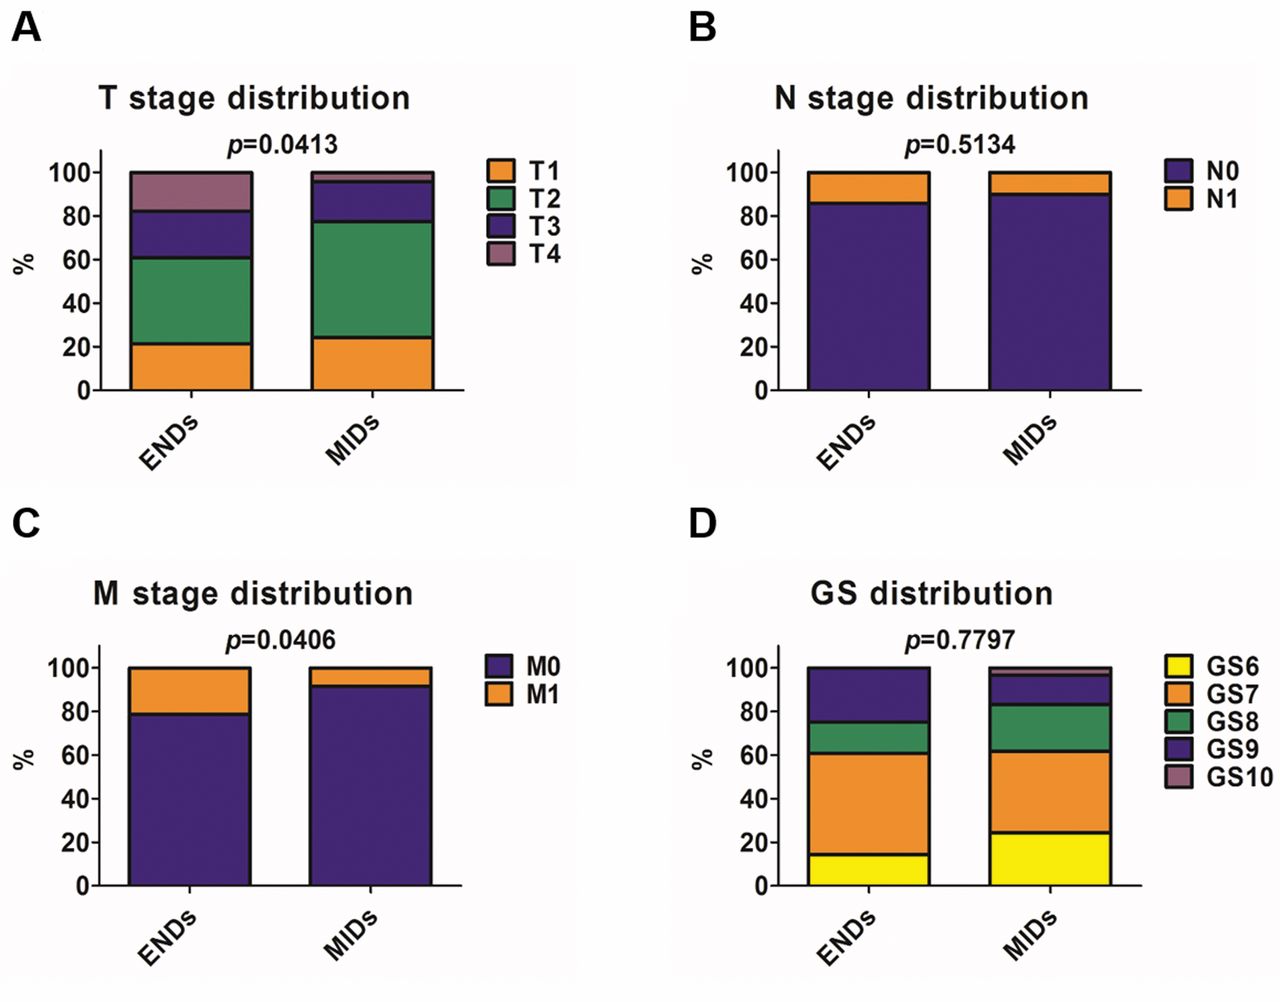
Of 379 biopsied patients, 255 were diagnosed with prostate cancer. Median age and serum TT level was 69 years (range=46-89) and 4.6 ng/mL (range=1.411.7), respectively. There were no significant correlations between TT and age and between TT and PSA (Figure 1A and B), consistent with our previous report on men without cancer (8). The patients were divided into five groups according to their serum TT levels at diagnosis: (i) patients with a low serum TT level, i.e., <2 (n=7) and (ii) those with a high serum TT level, i.e., ≥8 ng/mL (n=21), were together defined as “ENDs,” and (iii) those with a middle serum TT level between ≥2 and <4 ng/mL (n=95), (iv) those with a level between ≥4 and <6 ng/mL (n=94), and (v) those with a level between ≥6 and <8 ng/mL (n=38), were together termed as “MIDs” (Figure 2A and B). ENDs had worse OS and PCaSS compared with MIDs (Figure 3A and B). Moreover, ENDs showed worse CFS with advanced stage (T4 or N1 or M1) (Figure 4A and B). Higher T and M stages were observed in ENDs than in MIDs (Figure 5A and C). There were no significant differences in N stage and GS between ENDs and MIDs (Figures 5B and D). However, the percentage of GS=6 in ENDs and MIDs was 14.3% and 24.2%, respectively, and the percentage of GS=9 or 10 in ENDs and MIDs was 25.0% and 16.7%, respectively, indicating that ENDs tended to have higher GS than MIDs. Overall patient characteristics are shown in Table I. Although there were no differences in treatment between ENDs and MIDs, age, serum CCL2 level, and TT were higher in ENDs than in MIDs. Because 75% of ENDs had a serum TT level of ≥8 ng/ml, the serum TT level in ENDs was significantly higher than that in MIDs. To compare patients with a serum TT level from <2 and ≥8 ng/ml, patient's characteristics in ENDs were shown in Table II. Interestingly, the CCL2 level in patients with serum TT level of <2 ng/mL was significantly higher than in those with serum TT level of ≥8 ng/ml.

Kaplan–Meier analyses of PCaSS based on serum TT level. (A) Patients were divided into five groups according to their serum TT levels per every 2 ng/ml. (B) ENDs and MIDs were analyzed (p<0.0001). Log-rank test was used for comparison of survival distributions.

Kaplan–Meier analyses of CFS based on serum TT level. (A) ENDs and MIDs were analyzed (p=0.3476). (B) ENDs and MIDs with advanced stages that indicate T4 or N1 or M1 were analyzed (p=0.0266). Log-rank test was used for the comparison of survival distributions.

Distribution of TNM and GS according to serum TT level. (A) T stage (p=0.0413), (B) N stage (p=0.5134), (C) M stage (p=0.0406), and (D) GS (p=0.7797) distribution were analyzed. Chi-squared tests for trends (A and D) and Fisher's exact tests (B and C) were performed for comparisons between the two groups.
Discussion
The mechanism of prostate cancer progression is complicated and still has not been fully elucidated. As the latest studies revealed the importance of interaction among cells within tumor microenvironment through the long non-coding RNAs and exosome, the development of novel biomarkers indicating accurately patients' survivals are expected (9, 10). However, because novel technologies may take some time to be applied for real-world clinical aspect, conventional techniques, such as measurement of serum protein levels, may be still applicable as biomarker. Windrichova et al. recently reported circulating MIC1/GDF15 is a powerful biomarker for bone metastatic disease such as prostate cancer (11). Low serum TT level has been also reported as a predictive biomarker indicating worse outcomes in patients with prostate cancer. TT is an essential hormone in male body and its dysfunction causes a variety of disorder such as sexual, psychological, cardiovascular, and endocrinological problems. However, accurate mechanisms of some TT functions are still veiled. For example, although ADT has been reported not to be a factor of urination disorder after prostate radiotherapy, replacement of testosterone conversely improves in voiding symptoms (12, 13). This study showed that not only low but also high serum TT level could indicate poor prognosis, looking like inconsistent (Figure 6). However, the fact that ENDs indicates worse survival is reasonable based on our previous studies that showed that low (<3.5 ng/ml) as well as high PSA level might indicate poor prognosis. The proliferation of prostate cancer cells depends on the androgen-AR signaling activity. Furthermore, PSA is an AR-controlled gene, and serum PSA level reflects AR activity of prostate cancer cells. However, we sometimes encounter cases of very aggressive prostate cancer with a low PSA level, suggesting that poor prognosis of patients with low serum TT and PSA levels may be due to signals other than androgen/AR. Conversely, poor prognosis of patients with high serum TT level may depend on the androgen/AR signaling as it was reported that higher serum TT level is also associated with the stage progression of prostate cancer.

Schematic prognosis model of patients with prostate cancer based on the initial serum TT level. Both low and high serum TT levels may indicate worse prognosis compared with moderate (normal) serum TT level.
Overall patients' background.
ENDs patients' background.
Interestingly, patients with a low serum TT level conversely had a high serum CCL2 level compared with those with a high serum TT level as shown in Table II. Human CCL2 was identified in 1987 (14, 15) and was originally reported as a chemical mediator attracting mononuclear cells to an inflammatory tissue (15, 16). CCL2 is secreted by prostate cancer cells during ADT and induces prostate cancer cell migration/invasion via CCL2-dependent STAT3 activation and EMT pathways (17, 18). These results support the conclusion that low serum TT level induces prostate cancer progression via CCL2, which is a potential driver of prostate cancer progression.
This study had a number of limitations. The small sample size may have prevented the determination of the precise statistical significance of differences between groups. Larger prospective studies with longer follow-up periods and data from other ethnic backgrounds are needed to confirm our findings. Moreover, as a variety of treatments, including radical prostatectomy, radiation, and ADT were performed, some outcomes may not have been impacted by only TT. However, this is the first report that showed that both high and low serum TT levels are useful biomarkers for predicting prognosis of patients with prostate cancer. These findings may help clinicians predict OS, PCaSS, and CFS and plan an appropriate treatment and a follow-up schedule after diagnosis.
To our knowledge, the present study is the first to investigate serum TT levels using a cohort of prostate cancer samples, and it reveals the predictive value of serum TT levels as a biomarker of prostate cancer. Serum TT levels at diagnosis may serve as a useful tool to improve the prediction of survival and the efficacy of ADT in patients with prostate cancer.
Footnotes
Conflicts of Interest
The Authors declare that they have no conflicts of interest.
- Received August 8, 2017.
- Revision received August 23, 2017.
- Accepted August 24, 2017.
- Copyright© 2017, International Institute of Anticancer Research (Dr. George J. Delinasios), All rights reserved
References
In this issue


Jump to section
Related Articles
Cited By...
- No citing articles found.