


Abstract
Background/Aim: Russian Federation is among the high-incidence countries for gastric cancer (GC), with the incidence being projected to continue increasing. Using a non-invasive blood test with four stomach-specific biomarkers (pepsinogen-I (PG-I) and –II (PG-II), amidated gastrin-17 (G-17) and Helicobacter pylori (HP) IgG antibodies) in a hospital-based screening setting, we aimed to determine the prevalence of GC risk conditions: HP-infection and atrophic gastritis (AG). Patients and Methods: A population-derived cohort of 918 asymptomatic subjects (646 women and 272 men) with a mean age of 51.8 years (range=26-83) was examined with the GastroPanel® (GP) test. GP results were verified by gastroscopy and biopsies (the Updated Sydney System (USS) classification for all test-positive AG cases and for random 5% test-negatives (n=263) to correct for the verification bias. Results: Of the 918 subjects, only 199 (21.7%) tested completely normal, while 76.7% (704/918) had HP-infection. Altogether, in 99 subjects (10.8%), GP suggested AG: atrophic gastritis in the antrum (AGA) (n=21), atrophic gastritis in the corpus (AGC) (n=69) or atrophic pangastritis (AGpan) (n=9). The overall concordance between GP and USS classification was 82.5% (217/263) with weighted kappa intra-class correlation coefficient (ICC)=0.875 (95% confidence interval (CI)=0.840-0.901). The sensitivity/specificity balance in receiver operating characteristic (ROC) analysis for PG-I as a marker of moderate/severe AGC (AGC2+) had area under the curve (AUC)=0.895 (95%CI=0.837-0.953). Using the AGC2+ end-point, verification bias-corrected specificity of PGI reached 96.4% (95%CI=94.7-97.9) and that of PGI/PGII ratio 94.6% (95%CI=92.6-96.3), with inevitable erosion in sensitivities. Conclusion: While capable of detecting the subjects at risk for GC (HP and/or AG), GP should be the cost-effective means to break the current ominous trend in GC incidence in Russian Federation.
- GastroPanel
- gastric cancer
- screening
- population-based
- risk factors
- Helicobacter pylori
- atrophic gastritis
- antrum
- corpus
- biomarker
- pepsinogens
- gastrin-17
- verification bias
Globally, gastric cancer (GC) remains the fifth most common malignancy with almost one million new cases annually (1). Russia is among the high-risk countries with over 38,000 incident cases and 33,000 annual deaths due to GC (1, 2). This translates to annual incidence rates of 24.5/100.000 among males and 10.8/100.000 among women with respective mortality rates of 20.6 and 8.7 (1). This uniformly poor outcome of GC is due to the fact that, in most settings, the disease has progressed beyond reach of curative therapy at the time of diagnosis. This is also the case in Russia, where, e.g., in Novosibirsk, stage III and IV GC represent 70% of all newly diagnosed cases (3, 4). To improve the ominous disease outcome, early detection of GC is mandatory.
A systematic screening of the risk groups by stomach-specific biomarkers might provide a potential solution (5-12). Atrophic gastritis (AG) and its causative etiological agent Helicobacter pylori (HP) infection are well-established precursor lesions of non-gardia GC (13-19). Population-based screening by endoscopy for detection of these GC precursors is not feasible except, perhaps, in Japan (11). Therefore, a non-invasive diagnostic test for detection of AG and HP would be urgently needed (4-8). For some time, serum pepsinogen (PG) tests have been used for this purpose (9, 11); however, their impact on global GC mortality has been questioned (20-22).
To meet the increasing demand, the GastroPanel® test (hereafter, GP) was designed in the late 1990's by Biohit Oyj representing the first non-invasive diagnostic test for stomach health (8, 23, 24). This 4-biomarker panel is based on stomach physiology, including three markers of mucosal atrophy (PG-I and PG-II for the corpus; G-17 for the antrum), combined with the test of HP IgG antibodies. When endoscopic biopsy is used as the gold standard, GP identifies moderate/severe AG with acceptable sensitivity (71%-83%) and high specificity (95-98%) (8, 12, 25).
During the past decade, GP has been tested in different settings, mostly in the diagnosis of stomach health among symptomatic (dyspeptic) subjects (5, 8, 26-32). As repeatedly emphasized (23-25), GP is not a test for an overt GC but designed for screening of the subjects at risk for GC, i.e. those with HP-infection and AG. Until now, however, GP test has not been extensively validated in population-based screening of these risk groups (4, 6, 7, 33-35). The present study is the first where the GP test was used in a population-based screening setting to assess the prevalence of HP-infection and AG in a high-incidence country of GC (Russian Federation) (1-4). Being a screening study with incomplete verification by the gold standard (gastroscopic biopsy), the performance indicators (sensitivity and specificity) of GP were also corrected for the verification bias (36, 37).
Patients and Methods
Study design. The present study is a population-based screening with the Biohit GastroPanel® test for the risk of GC. The special aim was to assess the prevalence of HP-infection and AG, the two most important risk conditions for GC (13-19). The target groups consists of i) asymptomatic volunteers (from local enterprises) and ii) those tested as part of their annual health monitoring in a local clinic.
Patients. This screening trial was conducted by two clinics in St. Petersburg (Russian Federation): a) The Leningrad Regional Oncological Dispensary (LROD); and b) The Federal State Institute of Public Health “The Nikiforov Russian Center of Emergency and Radiation Medicine” (FSTPH). Between July 2013 and February 2015, a total of 926 subjects were enrolled in the study by the two clinics. Due to the technical failure of laboratory testing (n=8), the final cohort included 918 subjects: 646 women and 272 men with a mean age of 51.8 years (standard deviation (SD)=8.0 years, median=52.3, range=25.9-82.6). Women were slightly older, mean age=52.4 (SD=7.5) years than men (50.5±9.1 years) (p=0.001), with an age range of 27-79 and 26-82 years, respectively.
Enrollment of the study subjects took place among healthy volunteers. The research team of LROD made targeted visits to local enterprises and factories looking after asymptomatic volunteers to participate in the study. On this occasion, every subject was asked to consent to the study and sign a written consent to participate. Eligible study subjects were adult females and males with no age limits. The subjects were considered non-eligible if they had an upcoming or a recent referral to hospital for gastroscopy (due to abdominal symptoms). The FSTPH organized annual health controls for their staff, including the GP testing and gastroscopy. While only the GP test-positives were subjected to gastroscopy at LROD, also GP test-negatives underwent gastroscopy at FSTPH.
Rational use of the GP examination necessitates some preparatory measures of the patients (8, 25, 33, 34). Detailed instructions were given to each test subject at the time of his/her consenting to participate and their compliance was controlled before taking the blood sample. Most importantly, the patients are not allowed to drink, eat or smoke for at least 4 hours before blood sampling. The patients are allowed to take their prescribed regular medication, except for the proton-pump inhibitors (PPI), H2-blockers or medication neutralizing gastric acid secretion, all listed in the GP patient instructions (33, 34).
Sample collection for GastroPanel®. The GP test is a combination of four biomarkers analyzed in a single blood sample using an ELISA technique: (i) Pepsinogen I (PG-I), (ii) Pepsinogen II (PG-II), (iii) Gastrin-17 (G-17) and (iv) H. pylori antibody (HpAb) (8, 25, 33, 34). A minimum of 2 ml EDTA plasma from a fasting blood sample was taken into an EDTA tube. Use of Gastrin-17 stabilizer (100 μl/2 ml plasma) (Cat. No. 601 050 or 601 051; Biohit Oyj, Helsinki, Finland) allows the sample transfer at room temperature (20-25°C) and permits the ELISA tests within 4 days from the sample collection.
Sample processing. All samples were processed for ELISA according to the instructions of the manufacturer in the laboratories of the two clinics (33, 34). If the sample could not be analyzed within 4 days, it was stored frozen at −20°C. To simplify the study logistics in the clinics, only the fasting G-17 (G-17b) was measured and G-17 test was not repeated following a stimulation by a protein drink (G-17s) (8, 25, 33, 34).
Evaluation of the marker panel results. The results of the GP testing (in Excel format) were submitted to Biohit Oyj (Helsinki, Finland) for final analysis using the GastroSoft® (Biohit Oyj) interpretation software (8, 25). The classification used by the software is based on the Updated Sydney System (USS) for classification of gastritis (5-8, 12, 23-25, 48). Based on the clinically validated cut-off values for each biomarker (25), the software classifies the GP results into one of the five categories: i) normal result, ii) HP-infection (with no atrophy), iii) atrophic gastritis in the corpus (AGC), iv) atrophic gastritis in the antrum (AGA) and v) atrophic pangastritis (AGpan) (8, 25).
Gastroscopy and biopsy procedures. This screening setting represents an incomplete study design (36, 37) where the screening test results were verified by the gold standard (gastroscopy and biopsies) (LROD) only in subjects whose GP results suggested AG (AGA, AGC or AGpan). To enable calculating the GP performance indicators and to make corrections for the verification bias, a random sample of 5% (45/918) GP test negatives were invited for gastroscopy (FSTPH) (36, 37).
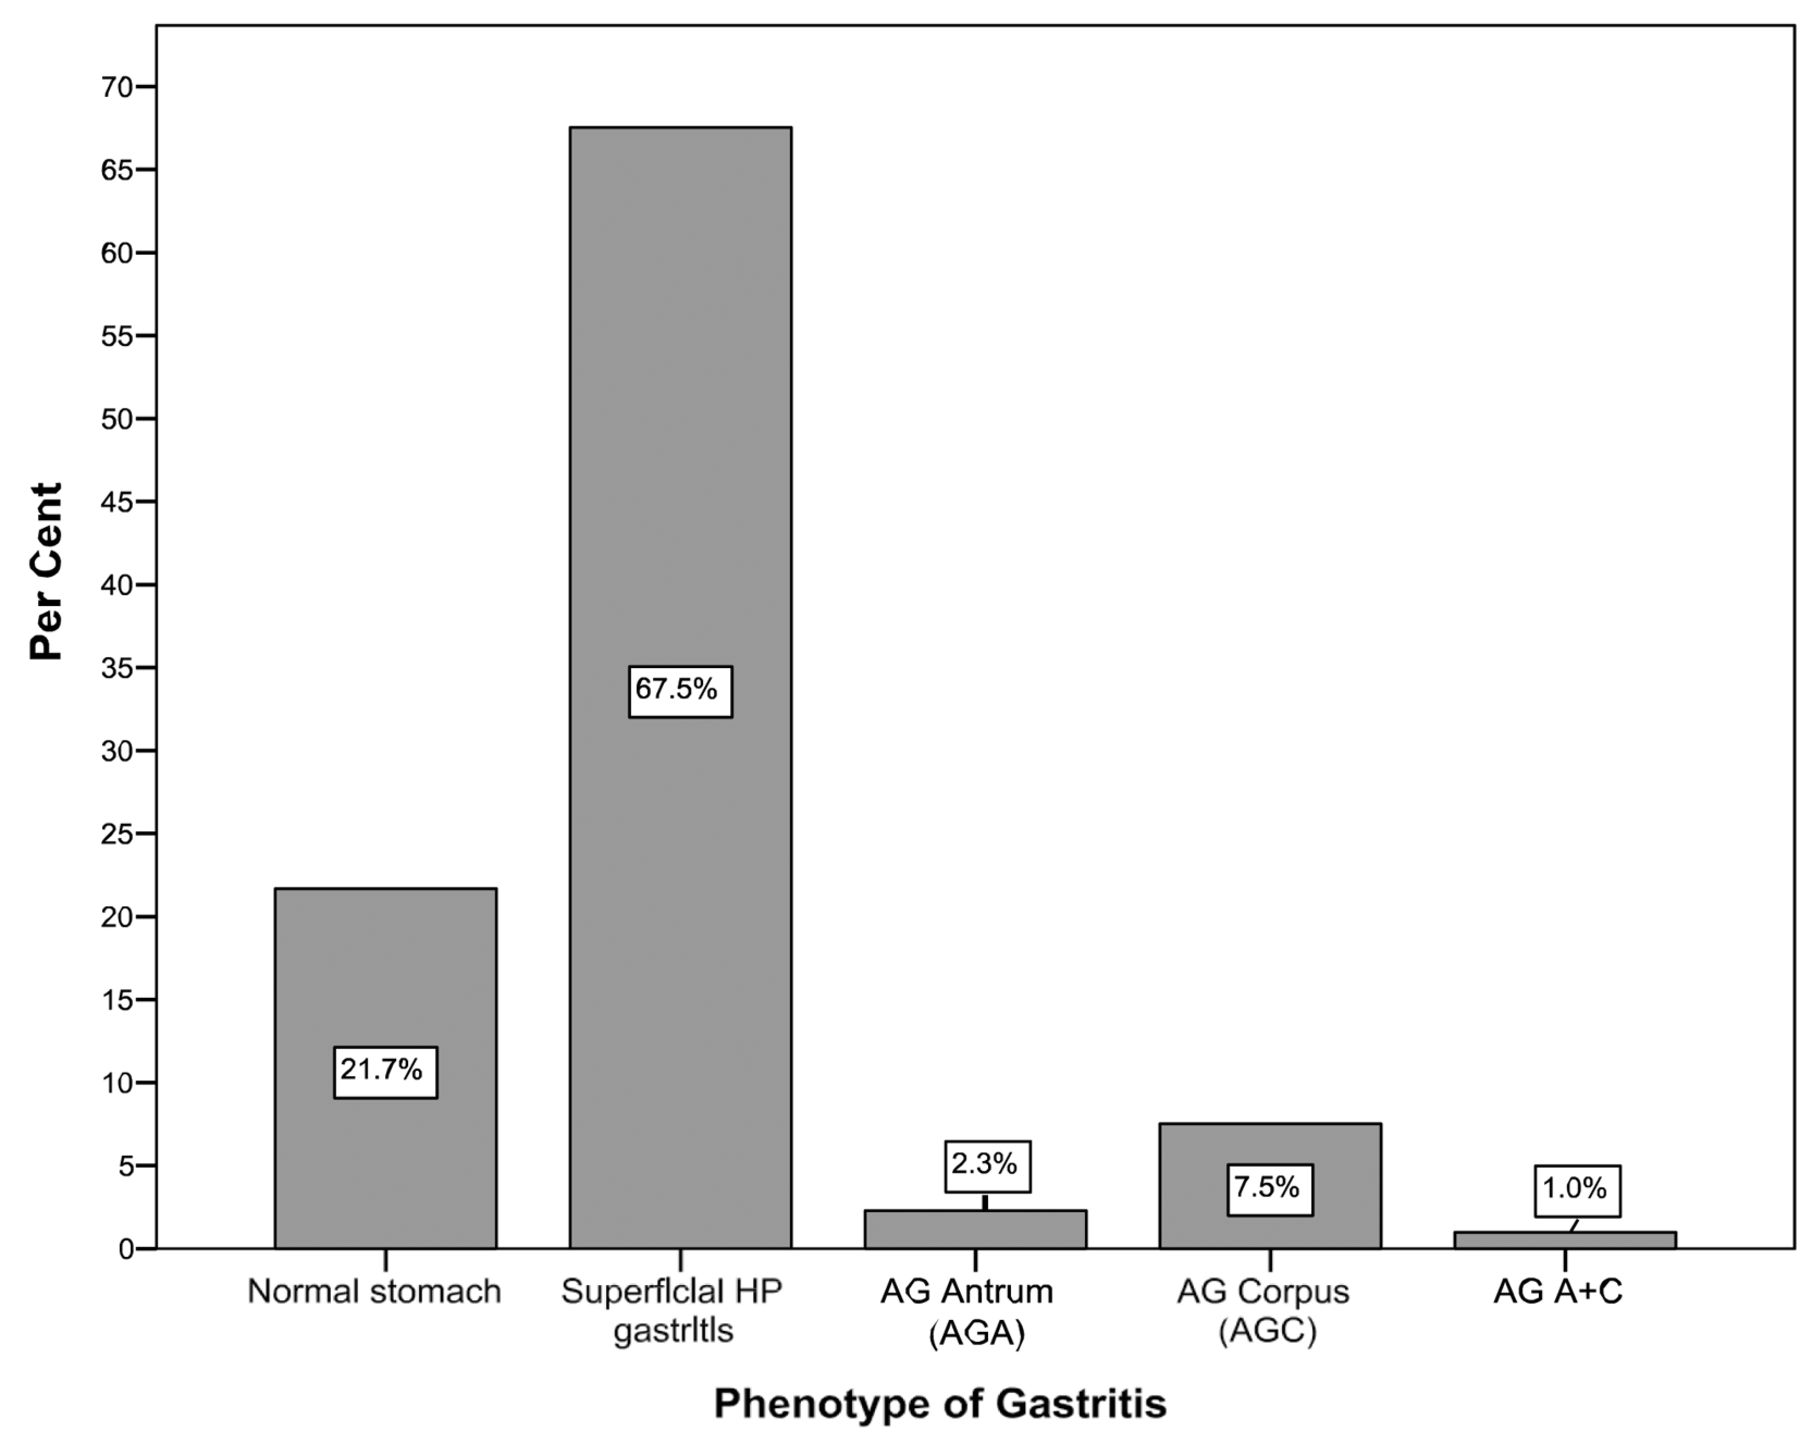
Prevalence of the five diagnostic categories of GastroPanel.
All patients who underwent gastroscopic examination were subjected to biopsy sampling from the antrum and corpus, according to the principles of the USS (8, 13). The optimal biopsy protocol following the USS recommends routine biopsies from the antrum and corpus, at least two biopsies from each. To facilitate the pathology reading, the two biopsies from the antrum were immersed into one and the same formalin tube, whereas those from the corpus into another tube, to be embedded into separate paraffin blocks.
Interpretation of the biopsies. All gastroscopy biopsies were examined by expert pathologists at both institutes. The diagnoses were reported using the USS for classification of gastritis (8, 12, 13) using the same five diagnostic categories as the GP test (25).
Statistical analyses. All statistical analyses were performed using the SPSS 23.0.0.2 for Windows (IBM, Armonk, NY, USA) and STATA/SE 14.1 software (Stata Corp., College Station, TX, USA). Frequency tables were analyzed using the Chi-square test, with likelihood ratio (LR) or Fischer's exact test being used to assess the significance levels between the categorical variables. Odds ratios (OR) and their 95% confidence intervals (95%CI) were calculated where appropriate, using the exact method. Differences in the means of continuous variables were analyzed using the non-parametric tests (Mann-Whitney, Kruskal- Wallis), with the mean (95%CI) values being derived from analysis of variance (ANOVA). Performance indicators: sensitivity (SE), specificity (SP), positive predictive value (PPV), negative predictive value (NPV) and their 95%CI of the GP biomarkers (PGI and PGI/PGII, as well as G-17) in predicting biopsy-confirmed AGC and AGA, respectively, were calculated using STATA/SE software and the algorithm introduced by Seed et al. (34), which also calculates the area under receiver operating characteristic (ROC) curve (AUC). The performance of different tests was compared using the ROC curve comparison test in STATA. All performance indicators were also re-calculated by correcting for the verification bias (37), using the algorithm described by Reichenheim et al. (36) (STATA). In this procedure, the 95%CIs were derived using the parametric bootstrap method with the option of 10,000 simulations. In all tests, p<0.05 values were regarded statistically significant.
Results
Figure 1 summarizes the distribution of the GP results in the cohort. Of the 918 subjects with complete GP results, only 199 (21.7%) tested completely normal (healthy stomach), whereas the vast majority, 67.5% (n=620), had HP-infection (with no AG). Altogether, 99 subjects (10.8%) had GP results consistent with mucosal atrophy, including AG of the antrum (n=21), corpus (n=69) or both (AGpan) (n=9). The distribution of these diagnostic categories by gender was not significantly different (p=0.291); however, the pattern was related to age (p=0.044) with a clear increase of AGC in parallel with increasing age (data not shown).

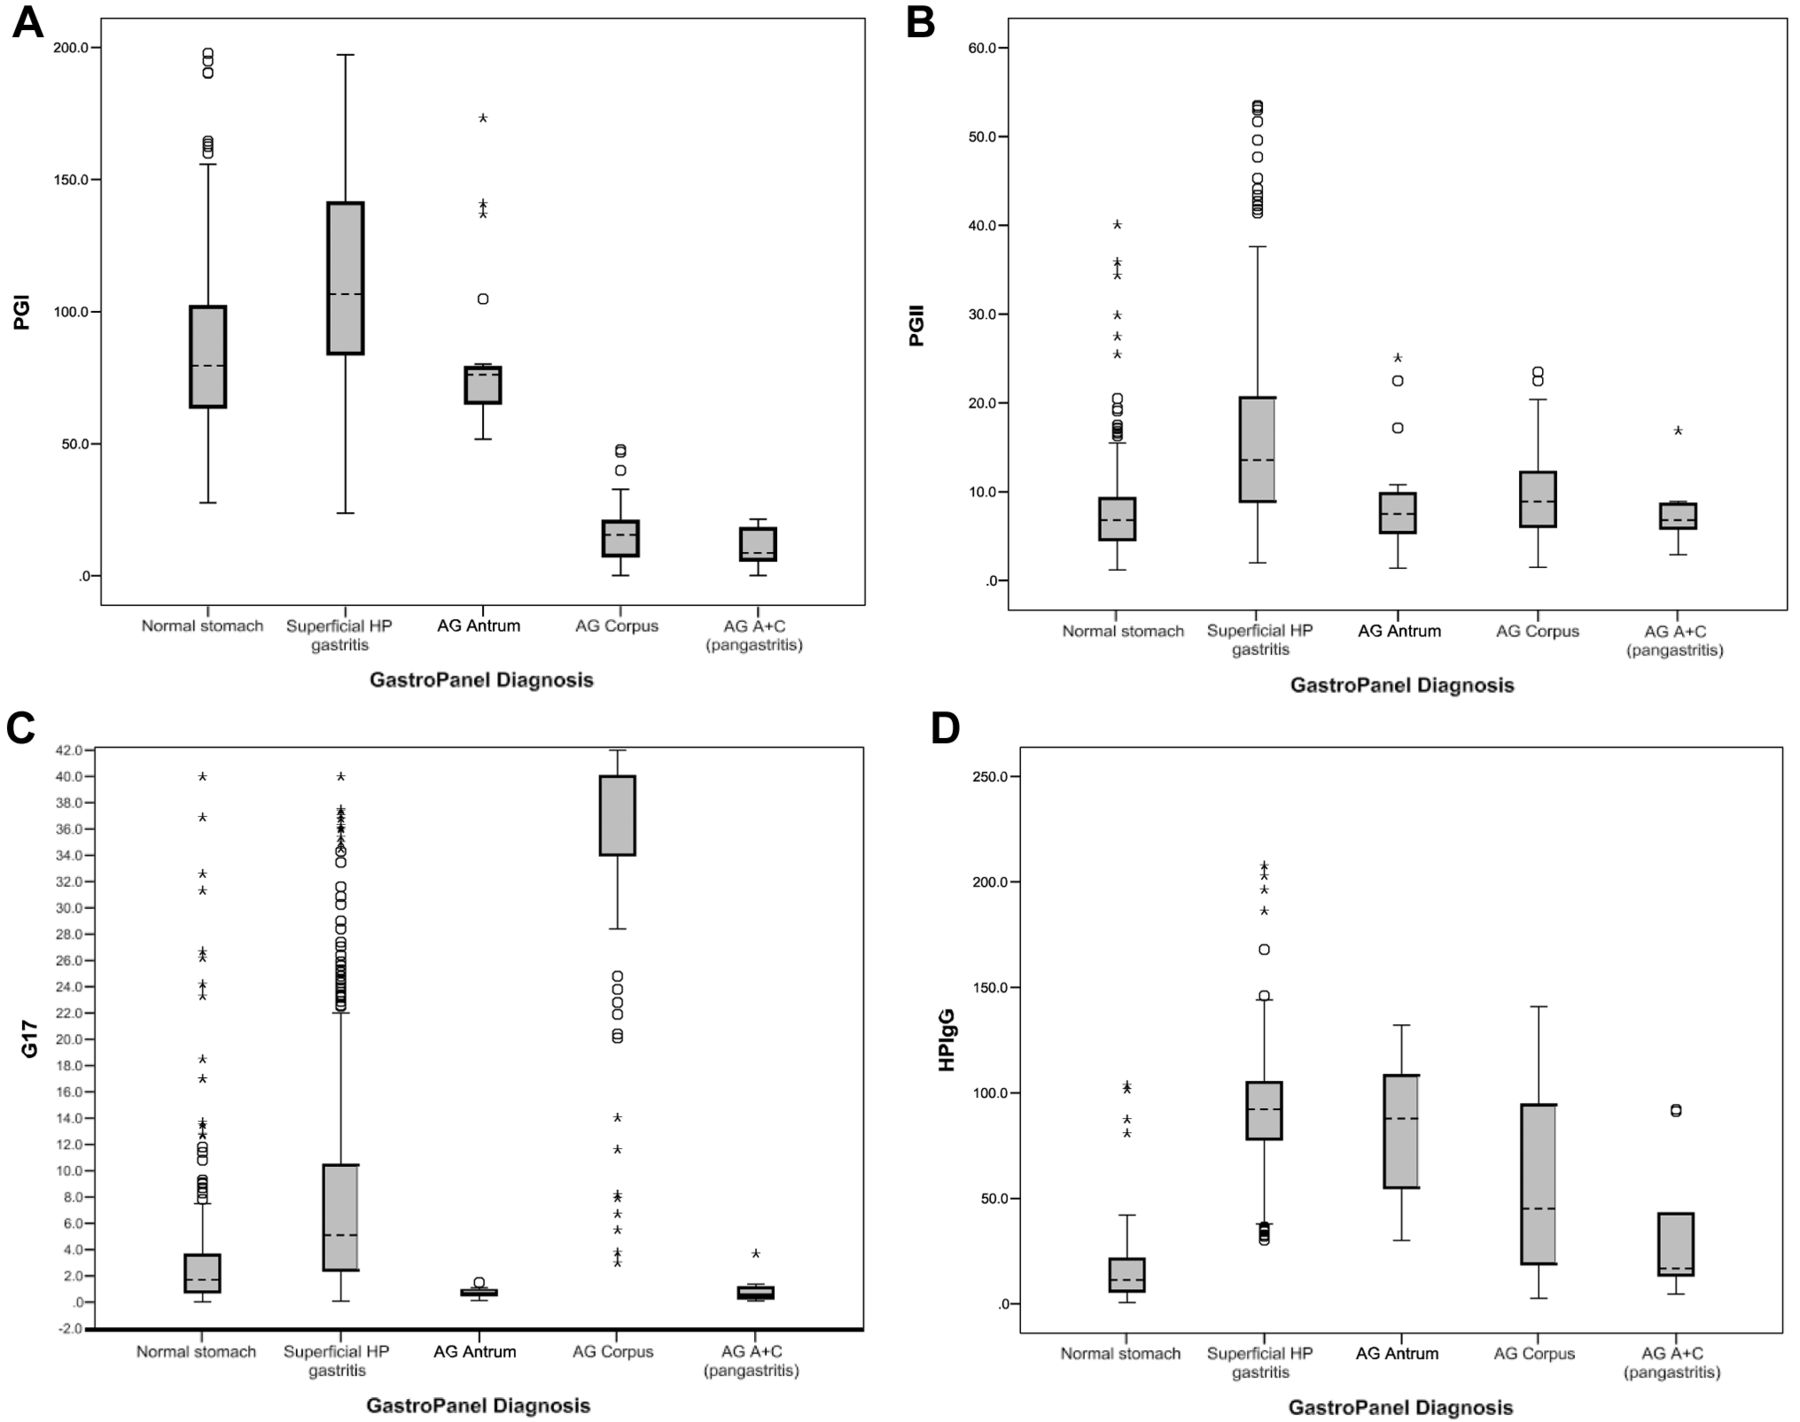
Results (Mean±95% confidence interval (CI)) of the four biomarkers across the five diagnostic categories of GastroPanel. A: Levels of PG-I by diagnostic categories, p=0.0001; B: Levels of PG-II by diagnostic categories, p=0.0001; C: Levels of G-17s by diagnostic categories p=0.0001; D: Levels of HP-Ab by diagnostic categories p=0.0001.
Figure 2 illustrates the serum biomarker levels stratified by the 5 diagnostic categories of GP. By definition, the levels of the four biomarkers are significantly different across the diagnostic categories (all with p=0.0001). The levels of PG-I are within normal cut-off values (30-160 μg/l) in categories of healthy stomach, HP-gastritis and AGA (Figure 2A) but there is a dramatic decline of the levels in AGC and AGpan with mean (95%CI) values of 15.7 (13.1-18.2) and 10.6 (4.4-16.8), respectively. As to PG-II (Figure 2B), the highest values (15.8; 95%CI=15.0-16.5) are detected in HP-associated non-AG, being the only condition where the reference levels (3-15 μg/l) were exceeded. PG-II levels are the lowest in subjects with AGpan; 7.6 (95%CI=4.6-10.7).
G-17b (basal) values were above the upper reference range (7 pmol/l) in HP-associated gastritis and in AGC with mean levels of 8.6 (95%CI=7.8-9.3) and 33.6 (95%CI =30.7-36.5), respectively. In AGA, G-17b levels were below the lower reference range (1 pmol/l) with mean values of 0.7 (95%CI=0.5-0.8) (Figure 2C). In subjects with healthy stomach (n=199), mean HP-Ab titres were 15.0 (95%CI=13.0-17.1) (Figure 2D). In all other categories, HP-Ab titres were elevated, reaching a peak of 90.3 (95%CI=88.3-92.2) in HP-associated non-AG, followed by AGA (82.4; 95%CI=68.2-96.6).
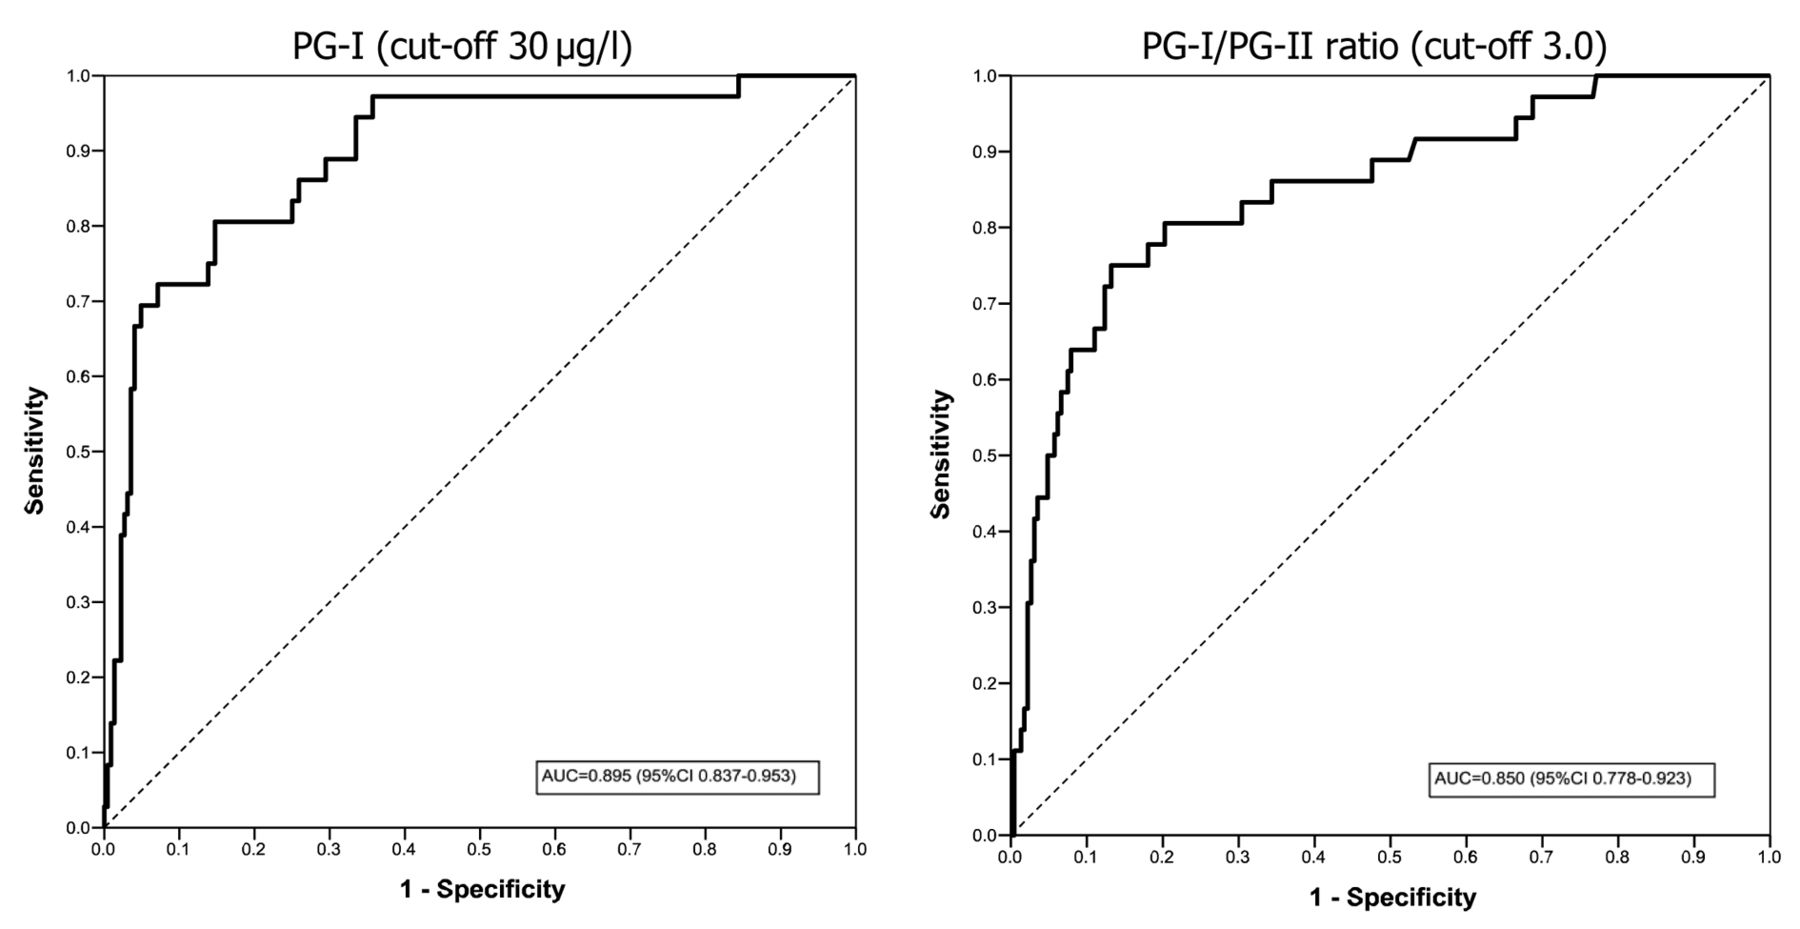
ROC analysis for PGI and PGI/PGII ratio as a marker of moderate/severe AG of the corpus. ROC, receiver operating characteristics; AUC, area under ROC curve; PG-I, Pepsinogen-I; PG-II, Pepsinogen-II; AG, atrophic gastritis
When related to gender and age, the values of the 4 GP biomarkers showed some trends. The mean levels of PGI were lower (96.9) in women than in men (103.9) (p=0.038). In contrast, G-17b levels were higher in women (9.7) than in men (7.5) (p=0.007). The other markers were not significantly different between the genders. PGI and PGII levels did not show a significant difference when stratified by the age groups; p=0.63 and p=0.141, respectively. PGI/PGII ratio declined significantly in parallel with increasing age from 10.0 (below 30 years of age) down to 0.25 (in those >80 years of age) (p=0.003). The opposite was true with G-17b values that significantly increased from 5.7 to 40 from those <30 years of age to those >80 years (p=0.005). Also, HP-Ab levels were significantly different across the age range (p=0.028) but with no direct or inverse trend.
Table I depicts the serum biomarker levels stratified by the USS classification of the gastric biopsies. Altogether, biopsy confirmation was obtained from 263 subjects of which 42 (15.9%) were classified as normal, 132 (50.2%) as HP-associated gastritis, 30 (11.4%) as AGA, 31 (11.8%) as AGC and 28 (10.6%) as AGpan. The levels of the biomarkers across the different USS categories show a similar pattern as illustrated in Figure 2 for the 5 GP categories.
GP test is optimized for the USS classification of gastritis, with an excellent concordance being established between the two (Table II). For all five categories, the overall agreement is 74.5%. When the confirmed AGpan cases are considered as a correct rating for both AGA and AGC, the overall agreement further improves to 82.5% (217/263). Using the regular (Cohen's) kappa test, the agreement between GP and USS is substantial (k=0.610) but exceeds the 0.8 boundary of almost perfect, when weighted kappa intra-class correlation coefficient (ICC) is used to calculate the agreement.
ROC analysis was used to test the sensitivity/specificity balance of PG-I and PG-I/PG-II ratio as a marker of moderate/severe AGC (Figure 3). AUC is excellent for both, far exceeding the almost perfect boundary. PGI alone seems to be a slightly better predictor of AGC2+ than the PG-I/PG-II ratio (ROC comparison test; p=0.394). ROC analysis was also performed for G-17b as a marker of moderate/severe AGA (data not shown). G-17b (with the 1.0 pmol/l cut-off) discriminates AGA2+ only with moderate AUC=0.553 (95%CI=0.479-0.628).
The performance indicators of the GP test were calculated separately for G-17b and PG-I (PG-I/PG-II) markers and the AGA2+ and AGC2+ end-points, respectively (Table III). Due to the incomplete study design, the indicators were also corrected for the verification bias. As to the accuracy of G-17b in detection of AGA2+, sensitivity is unsatisfactory low (26.3%) but specificity is acceptable (84.4%). Correction for the verification bias further improves the latter but compromises sensitivity. Using AGC2+ end-point, both PG-I and PG-I/PG-II ratio show good sensitivity and excellent specificity, with PG-I being slightly better (AUC=0.812 vs. AUC=0.767). Correction for the verification bias improves the specificity but compromises the sensitivity, slightly (but not significantly) eroding also on the AUC values.
GastroPanel biomarker levels across the USS diagnostic categories in gastric biopsies.
Agreement between the GastroPanel® diagnoses and the USS classification of gastric biopsies.
Discussion
In contrast to most Western countries, where the incidence of GC has dramatically declined during the past several decades (1, 8, 14, 15, 18, 19, 38), no such trend has been witnessed in Russian Federation (2-5). On the contrary, it is estimated that the current numbers (n=38,417) of incident GC cases will continue increasing, exceeding 42,000 by 2030 (1). In countries where adequately documented, the declining trends in GC incidence have been attributed to a marked reduction in the exposure to the key risk factors, most notably HP-infection (39-45) and AG (14-19, 38, 46). Whether this concept holds true in the Russian Federation remains to be elucidated because the previous data are incomplete concerning the population prevalence of HP-infection and AG (4, 47).
In the present cohort of 918 subjects tested by GP, only 199 (21.7%) were interpreted as having a healthy stomach, whereas the vast majority, 67.5% (n=620), were classified as HP-infection with superficial, non-AG. These figures are very similar to those recently reported in a similar type of hospital-based screening study in Astana (Kazakhstan) (5). When all cases testing HP-positive are counted, HP prevalence in the present series is 76.7% (704/918), being practically identical (76.5%) to that in Astana (5). These prevalence rates of HP-infection exceeding 75% are in sharp contrast to those recently reported in two Nordic countries (Finland and Sweden) where the overall prevalence of HP-infection was only 19% (34) and 28.7% (33) and the stomach was classified as healthy in 77% and 62.5%, respectively. In those two studies, the prevalence of AG was only 3.5% (34) and 6.5% (33), as compared with 14.1% in the Astana cohort (5) and 10.8% in the present study (Figure 1).
The GP test is based on combined analysis of PG-I, PG-II, amidated G-17 and HP-antibodies, designed to give information on both the structure and function of the stomach mucosa (8, 23-25, 48). The five diagnostic categories assigned by the GastroSoft® software are characterized by significantly different biomarker profiles (Figure 2). Based on previous validation studies (24, 25, 33, 38, 44), the levels of PG-I decrease in AG of the corpus (and in pangastritis) but remain within the normal range in all other conditions. The PG-II levels reflect mucosal inflammation, with the highest values being detected in HP-associated non-AG. G-17b levels are highest in AG of the corpus because of the missing negative feedback loop by the acid from an atrophic corpus mucosa, thus resulting in uninhibited secretion of G-17 by the normal antral mucosa after protein stimulation. By definition, when antral mucosa is atrophic and G cells are depleted, G-17 secretion remains very low also after protein stimulation (25, 29-32, 48). The profile of the 4 GP biomarkers in the present series follows the predicted patterns with no oddities (Figure 2A-D). Because of the established close correlation between the 5 diagnostic categories of GP and those of the USS classification (12, 25, 33, 44, 48, 49), the biomarker profile shown in Figure 2 (for GP) is very similar to that in Table I (for USS histology).
Performance indicators of the GastroPanel® in diagnosing moderate/severe atrophic gastritis (AGA2+ and AGC2+).
In the present screening setting, biopsy confirmation was available for 263 cases (Table I), making possible to calculate the agreement between the GP diagnoses and the USS classification (Table II). Calculating the overall agreement as non-adjusted to the 3 AG categories (AGA, AGC, AGpan), the overall agreement is 74.5%. When the AGpan diagnosis is considered as a correct ranking for both AGA and AGC, the overall agreement improves to 82.5% (217/263). When weighted kappa is used to assess the reproducibility between the two classifications, the ICC is 0.875 (95%CI=0.840-0.901) (Table II). This indicates an “almost perfect” agreement and favorably competes with the best biopsy-confirmed GP validation series published from Finland (8) and Sweden (33) during the phase of the GP test development.
As a quantitative test, GP biomarker levels can be analyzed for test performance by the ROC test (Figure 3). This should be performed separately for the markers of antrum (G-17) and corpus (PG-I, PG-II, PG-I/PG-II ratio), using AGA and AGC as the end-points (4-8, 26-35). In this respect, it is important to re-iterate that the appropriate study end-points in these calculations should always be the biopsy-confirmed moderate-severe AG (AG2+). This is simply due to the fact that mild AG in both the antrum (AGA) and corpus (AGC) is a poorly reproducible diagnosis (8, 24, 25, 48, 49) and should not be used as study end-point because of a potential misclassification bias (25).
When ROC analysis was used to test the sensitivity/specificity balance of PG-I and PG-I/PG-II ratio as a marker of AGC2+ (Figure 3), PGI alone seems to be a slightly better predictor than the PG-I/PG-II ratio (ROC comparison test; p=0.394). The AUC value of PG-I approaching 0.900 is an indication of an excellent sensitivity/specificity balance of this biomarker as a predictor of AGC2+, fully comparable with the results obtained in our validation study (8). Although not necessarily reported in the original papers, this type of AUC data can be reconstructed for several published studies (26-35). These data are consistent in demonstrating that PG-I and PG-I/PG-II ratio are sensitive and highly specific predictors of AGC, with some minor variance being due to the different cut-off values used in different studies, as well as pending on the accuracy of histological diagnosis of AG, as recently discussed (25). This experience obtained with GP testing also corroborates the results reported with the studies using PG-I and PG-II as stand-alone markers of AGC well before the era of the GastroPanel® test (9-11).
The biomarker-based diagnosis of AGA, in turn, is a more complex issue (25). For the purpose of diagnosing the structure and function of the antrum, the full GP test includes G-17 as fourth biomarker to complement PG-I, PG-II and HP Ab (25). G-17 is a well-established biomarker of the G cells in the gastric antrum, subject to progressive reduction in number in antral atrophy (8, 12, 48, 49). Compared with PG-I and PG-II, the physiologic regulation of G-17 is more complex, however. Importantly, low levels of G-17 are not exclusively caused by antral AG but, also, invariably result from high gastric acid output from the corpus. On the other way round, G-17 is up-regulated through a negative feedback loop by a low acid content of the corpus caused by either i) AGC or ii) more frequently, a prolonged use of PPI medication (12, 25, 34, 48, 49). Consequently, any biomarker that is being regulated by more than one trigger cannot be a highly specific marker of only one of those.
In the case of fasting G-17 (G-17b), the below-cut-off values can be due to either AGA or high acid output of the corpus (12, 25). Accordingly, in GP testing, an accurate distinction between AGA and high acid output, as the cause of low G-17b levels, can only be made by measuring G-17 levels after a protein-rich meal stimulation (12, 25, 48-50). Failure to increase G-17 output, after such stimulation, is a specific indicator of AGA. Furthermore, AGA is invariably associated with HP-infection (39-45) and diagnosis should not be made in HP-negative cases in whom the low G-17 output is considered as an indicator of high acid output (12, 25).
In the present study, only the basal G-17 levels were measured, precluding the possibility for making the distinction between AGA and high acid output as the cause of low G-17b levels (Table I). Not unexpectedly, the performance indicators, calculated for G-17b using the AGA2+ end-point, are not particularly good: sensitivity 26.3% and specificity 84.4%, AUC=0.553 (Table III). However, these figures are very similar as reported in those few GP studies where G-17b as indicator of AGA has been evaluated (29, 30, 32). When properly done, however, and G-17s (with cut-off 3.0 pmol/l) is used instead of G-17b, the values for sensitivity and specificity are improved to 50.0% and 97.3%, respectively (8).
While presenting the performance indicators of GP biomarkers in diagnosis of the AGA and AGC end-points, both uncorrected figures and figures corrected for verification bias were calculated (Table III). This is because of the “incomplete study design” of the present screening trial where only GP test-positive cases were verified by gastroscopy and biopsies. Verification bias occurs in all studies where the disease status verification with the gold standard is influenced by the result of the screening tests (36, 37, 51, 52). Thus, practically, all screening studies have an inherent design leading to verification-biased sampling because biopsy verification of all screened subjects is rarely possible. In the present study, the verification bias, due to incomplete use of the confirmatory gastroscopy and biopsies, is inevitable because only 263 out of 918 screened subjects were biopsied. However, a random sample of 5% GP-negative subjects invited for gastroscopy and biopsies enabled us to correct the figures for this verification bias (36). This type of correction inevitably compromises test sensitivity but improves test specificity (36, 37, 51, 52) without effect on PPV and NPV (Table III). In this case, however, the change was not dramatic enough to make the uncorrected and corrected AUC values significantly different. The highest specificity (96.4%) was obtained for PG-I after correcting for verification bias, but at the expense of eroded sensitivity (52.4%). In the GP studies published so far (8, 26-35), only the uncorrected performance indicators have been reported because these studies were not true population-based screening settings. The uncorrected indicators of PG-I and PG-I/PG-II, in the present study, are fully comparable with (or better than) those reported in most of these works but slightly inferior to those obtained in our validation study with PG-I sensitivity of 80.0% and specificity 98.1% in diagnosis of AGC2+ (8).
This is the first population-based study where this non-invasive biomarker test was used to estimate the population prevalence of the GC risk factors in a high-incidence country. The GP results in this Russian cohort are distressing while disclosing an i) extremely high prevalence of HP-infection (76.7%) and ii) alarming prevalence of AG (10.8%). Given that these two conditions represent the single most important risk factors of GC, these data are in perfect alignment with the high incidence of GC in this country. The study provides valuable information for the decision makers concerning the intervention strategies to revert the rising trend of GC incidence in Russia (1-4, 47). While capable of detecting the subjects at risk for GC, the non-invasive GastroPanel® test should be the cost-effective means in interfering with the current rising trend in GC incidence in this country, if implemented in a population-based screening.
Footnotes
This article is freely accessible online.
- Received June 6, 2016.
- Revision received June 27, 2016.
- Accepted June 28, 2016.
- Copyright© 2016 International Institute of Anticancer Research (Dr. John G. Delinassios), All rights reserved
References
In this issue


Jump to section
Related Articles
Cited By...
- Management of Helicobacter pylori infection: the Maastricht VI/Florence consensus report
- Accuracy of Serum Biomarker Panel (GastroPanel(R)) in the Diagnosis of Atrophic Gastritis of the Corpus. Systematic Review and Meta-analysis
- Non-invasive Screening of Autoimmune Atrophic Gastritis in Asymptomatic Subjects by Serological Biomarker Test (GastroPanel(R))
- Helicobacter pylori (Hp) IgG ELISA of the New-Generation GastroPanel(R) Is Highly Accurate in Diagnosis of Hp-Infection in Gastroscopy Referral Patients
- Feasibility of combined screening for upper gastrointestinal adenocarcinoma risk by serology and Cytosponge testing: the SUGAR study
- A Panel of Serum Biomarkers (GastroPanel(R)) in Non-invasive Diagnosis of Atrophic Gastritis. Systematic Review and Meta-analysis