


Abstract
Background/Aim: Exposure to 45% fat diet in utero and during nursing increased body weight and small intestinal tumor numbers in adult F1 multiple intestinal neoplasia (Min/+) mice, implicating that early-life obesogenic conditions predispose for obesity and intestinal tumorigenesis later in life. In this study, it was examined whether these effects were transferred to the next two generations. Results: In F2 mice, exposed to the obesogenic diet as germ cells within the embryonic F1 mice, there were no consistent differences in body weight, blood glucose levels or small intestinal tumor numbers whether their mother or father, both, or no parents were exposed to 45% vs. 10% fat diet. In F3 mice, never exposed to obesogenic diet, no differences were found in any end-points, whether both grandparents were exposed to 45% or 10% fat, or not. Conclusion: The effects of early-life high-fat diet on adult obesity and intestinal tumorigenesis were not inherited transgenera-tionally.
Abbreviations: ANOVA, Analysis of variance; Apc, adenomatous polyposis coli; AUC, area under the curve; BMI, body mass index; Min, multiple intestinal neoplasia; OECD, Organisation for Economic Co-operation and Development; PCR, polymerase chain reaction; SD, standard deviation; Wnt, Wingless-related integration site.
A parallel increase in overweight/obesity and many forms of cancer has been observed in most countries around the world in the past two - three decades. Cancer is now the second leading cause of mortality in the Organisation for Economic Co-operation and Development (OECD) countries (1). In Norway, colorectal cancer is the second most prevalent cancer in both women and men, after breast cancer and prostate cancer, respectively (2). Overweight and/or obesity are associated with increased risk, incidence, mortality or poor prognosis for many types of cancers, including colon cancer (3-6). Body fatness and abdominal fatness are both evaluated as convincing increasing risks of colorectal cancer (7, 8). Maternal obesity during pregnancy is a serious health issue with a prevalence of overweight or obesity in adult women of above 40% in many OECD countries (9).
The rapid rise of obesity is suggested to be driven mainly by environmental factors. Although there has been focus on the role of current diet, recent insights have also stressed the importance of nutrition during early life in the development of metabolic disorders. The phenotype of an individual can be driven by in utero and early postnatal environmental conditions determined by the nutritional status of the mother (10). This has given rise to the perception of “developmental programming” and the concept “developmental origins of health and disease” (DOHaD). It is proposed that conditions present during a critical window of development can lead to permanent programmed alterations in physiological systems and adverse outcomes later in life (10, 11).
The “fetal origins of adult disease hypothesis” was originally put forward by David Barker and colleagues, which stated that environmental factors, especially nutrition, act in early life to program the risks for early onset of diseases, such as hypertension, diabetes, coronary heart disease, metabolic disorders and mental illnesses in adult life and premature death (10-12). Although the initial fetal origins hypothesis was primarily concerned with undernutrition and malnutrition, recent epidemiological and animal studies have examined the effects of overnutrition during critical periods of fetal development and the offspring's subsequent risk of developing the same chronic diseases as associated with fetal growth restriction (13).
The Min (multiple intestinal neoplasia) mouse is heterozygous for a germline non-sense mutation in the tumor suppressor gene adenomatous polyposis coli (Apc) leading to a truncated non-functional APC protein and, therefore, develops multiple spontaneous adenomas in the small intestine and to a much lesser degree in the colon (14, 15). Apc is a key component in the Wingless-related integration site (Wnt) signaling pathway (16, 17). The Min mouse is a model for the inherited cancer disorder familial adenomatous polyposis (FAP), as well as for sporadic colorectal cancer, in humans (18-20).
In a recent study, we have shown that exposure to obesogenic conditions in the form of a 45% fat diet in utero and during the nursing period resulted in higher body weight in the adult C57BL/6J-Min/+ mice and their wild-type (+/+) siblings and increased number of small intestinal tumors in Min/+ offspring as adults compared with a 10% fat diet (21). As a continuation of this experiment, these mice were bred in further two generations. Blood glucose levels were measured to study the hypothesis of disrupted blood glucose regulation as a link between obesity and intestinal tumorigenesis (22, 23).
In the present study, it was examined whether the effects on body weight and intestinal tumorigenesis observed in the F1 mice after exposure to obesogenic conditions early in life, i.e. in the intrauterine and nursing periods (21), were heritable in a transgenerational manner to the following F2 and F3 generations.
Materials and Methods
Mice. Female C57BL/6J-Apc+/+ (wild-type) mice were mated with C57BL/6J-ApcMin/+ males, using proven breeders having had a litter on a regular breeding diet (2018 Teklad Global 18% Protein Rodent Diet from Harlan Industries Inc., Indianapolis, IN, USA) before the experimental litters on special diets with 10% or 45% fat (described below). Both females and males were bred at the Norwegian Institute of Public Health, Oslo, Norway. C57BL/6J-ApcMin/+ males were originally purchased from the Jackson Laboratory (Bar Harbour, ME, USA). To minimize the genetic drift from the colony at the Jackson Laboratory, both females and males in the breeding stock at our institute have been replaced regularly. Homozygous mutant ApcMin/Min (Apc−/−) mice die during the embryonal stages (24); therefore, only two genotypes were obtainable from these crosses. The Min mutation was propagated through males to avoid interference with pregnancy from any anemia caused by the intestinal adenomas in females (14).
Genotyping of the offspring for the Apc gene was performed with allele-specific polymerase chain reaction (PCR) using DNA extracted from ~2 mm2 samples obtained by ear puncture for identification of individual mice at weaning, as described previously (25).
The mice were housed in air flow IVC racks (Innovive Inc., San Diego, CA, USA) in 100% PET plastic disposable cages on Nestpak Aspen 4HK bedding (Datesand Ltd., Manchester, UK) in a room with 12-h light/dark cycle and controlled humidity (55±5%) and temperature (20-24°C). Diet and water were given ad libitum.
The study was performed in strict accordance with the laws and regulations for animal experiments in Norway. The protocols were approved by the Norwegian Animal Research Authority (NARA) (permit number 4628). Cervical dislocation was performed under ZRF cocktail anesthesia (containing 3.3 mg zolazepam, 3.3 mg tiletamine, 0.5 mg xylazine and 2.6 μg fentanyl per ml 0.9% NaCl), before dissection of organs after death.
Experimental diets. The F0 dams used for breeding the experimental F1 offspring in our previous experiment (21) were given either a 10% fat or a 45% fat diet of purified ingredients from Research Diets Inc. (New Brunswick, NJ, USA). The D12451 diet, containing 20%, 35% and 45% of kcal from protein, carbohydrates and fat, respectively, was used as a high-fat diet. The D12450H diet, containing 20%, 70% and 10% of kcal from protein, carbohydrates and fat, respectively, was used as a matching control low-fat diet. The amount of sucrose was 17% of the calories in both diets. The high-fat diet had 4.73 kcal/g, whereas the low-fat diet had 3.85 kcal/g, i.e. the high-fat diet contained 22.9% more kcal per gram diet.
Breeding and dietary exposure of F1, F2 and F3 mice. The dams in the F0 generation were given either a 10% fat diet or a 45% fat diet during their pregnancy and nursing periods (21) (Figure 1). The F1 mice were exposed to the 45% fat diet or the 10% fat diet from Research Diets Inc. in utero and during nursing, then the 10% fat diet from weaning to termination. The data from this experiment is reported as data on F1 mice in the present study. These F1 mice were bred to produce F2 mice, taking care to mate non-siblings. The F2 mice were potentially exposed to the obesogenic diet as germ cells within the embryonic F1 mice. The F3 generation was never exposed to the obesogenic diet and, therefore, any effects observed in F3 are considered to be transgenerational and permanent (26, 27). In F2, the obesogenic influence was transferred either via the maternal or the paternal lineage or both or none of the parental lineages. The mothers of the F2 and F3 mice were given a regular breeding diet (2018 Teklad Global 18% Protein Rodent Diet from Harlan Industries Inc.) during mating, pregnancy and nursing. The fathers received a standard maintenance diet, SDS RM1 (E) from SDS Special Services (Essex, UK). The mice in the F2 and F3 generations received the standard maintenance diet SDS RM1 (E) after weaning until termination at 11 weeks (the Min/+ mice), before onset of noticeable anemia caused by their tumors, or at 23 weeks of age (the wild-type mice). During such long time periods, despite the best efforts, environmental influences may vary between the generations. Therefore, negative control groups without ancestral exposure to the high-fat diet were included in both the F2 and F3 generations.
In addition to two experimental groups from the F1 generation reported in our previous study (21), six new experimental groups were used in this experiment, in total 8 experimental groups given the two diets with 45% or 10% fat in three periods; in utero, during nursing and from weaning to termination (Figure 1). Thus, the 8 dietary treatment groups were the following: F1 mice exposed to a 10% fat diet throughout life (F1 10+10+10) or exposed to a 45% fat diet in utero and during nursing, i.e. through their mothers, their mother's milk and own intake, and thereafter a 10% fat diet from weaning to termination (F1 45+45+10), F2 mice exposed to the obesogenic influence of the 45% fat diet either via the maternal (F2 45×10) or the paternal (F2 10×45) F1 lineage or both (F2 45×45) or none (F2 10×10) of these parental lineages and F3 mice exposed to the obesogenic influence of the 45% fat diet via both (F3 45×45) or none (F3 10×10) of the maternal or the paternal lineages. In F2 and F3, the parental mice not being influenced by the 45% fat diet were influenced by the 10% fat diet. The number of mice (n) in each dietary treatment group is given in the figure legends.
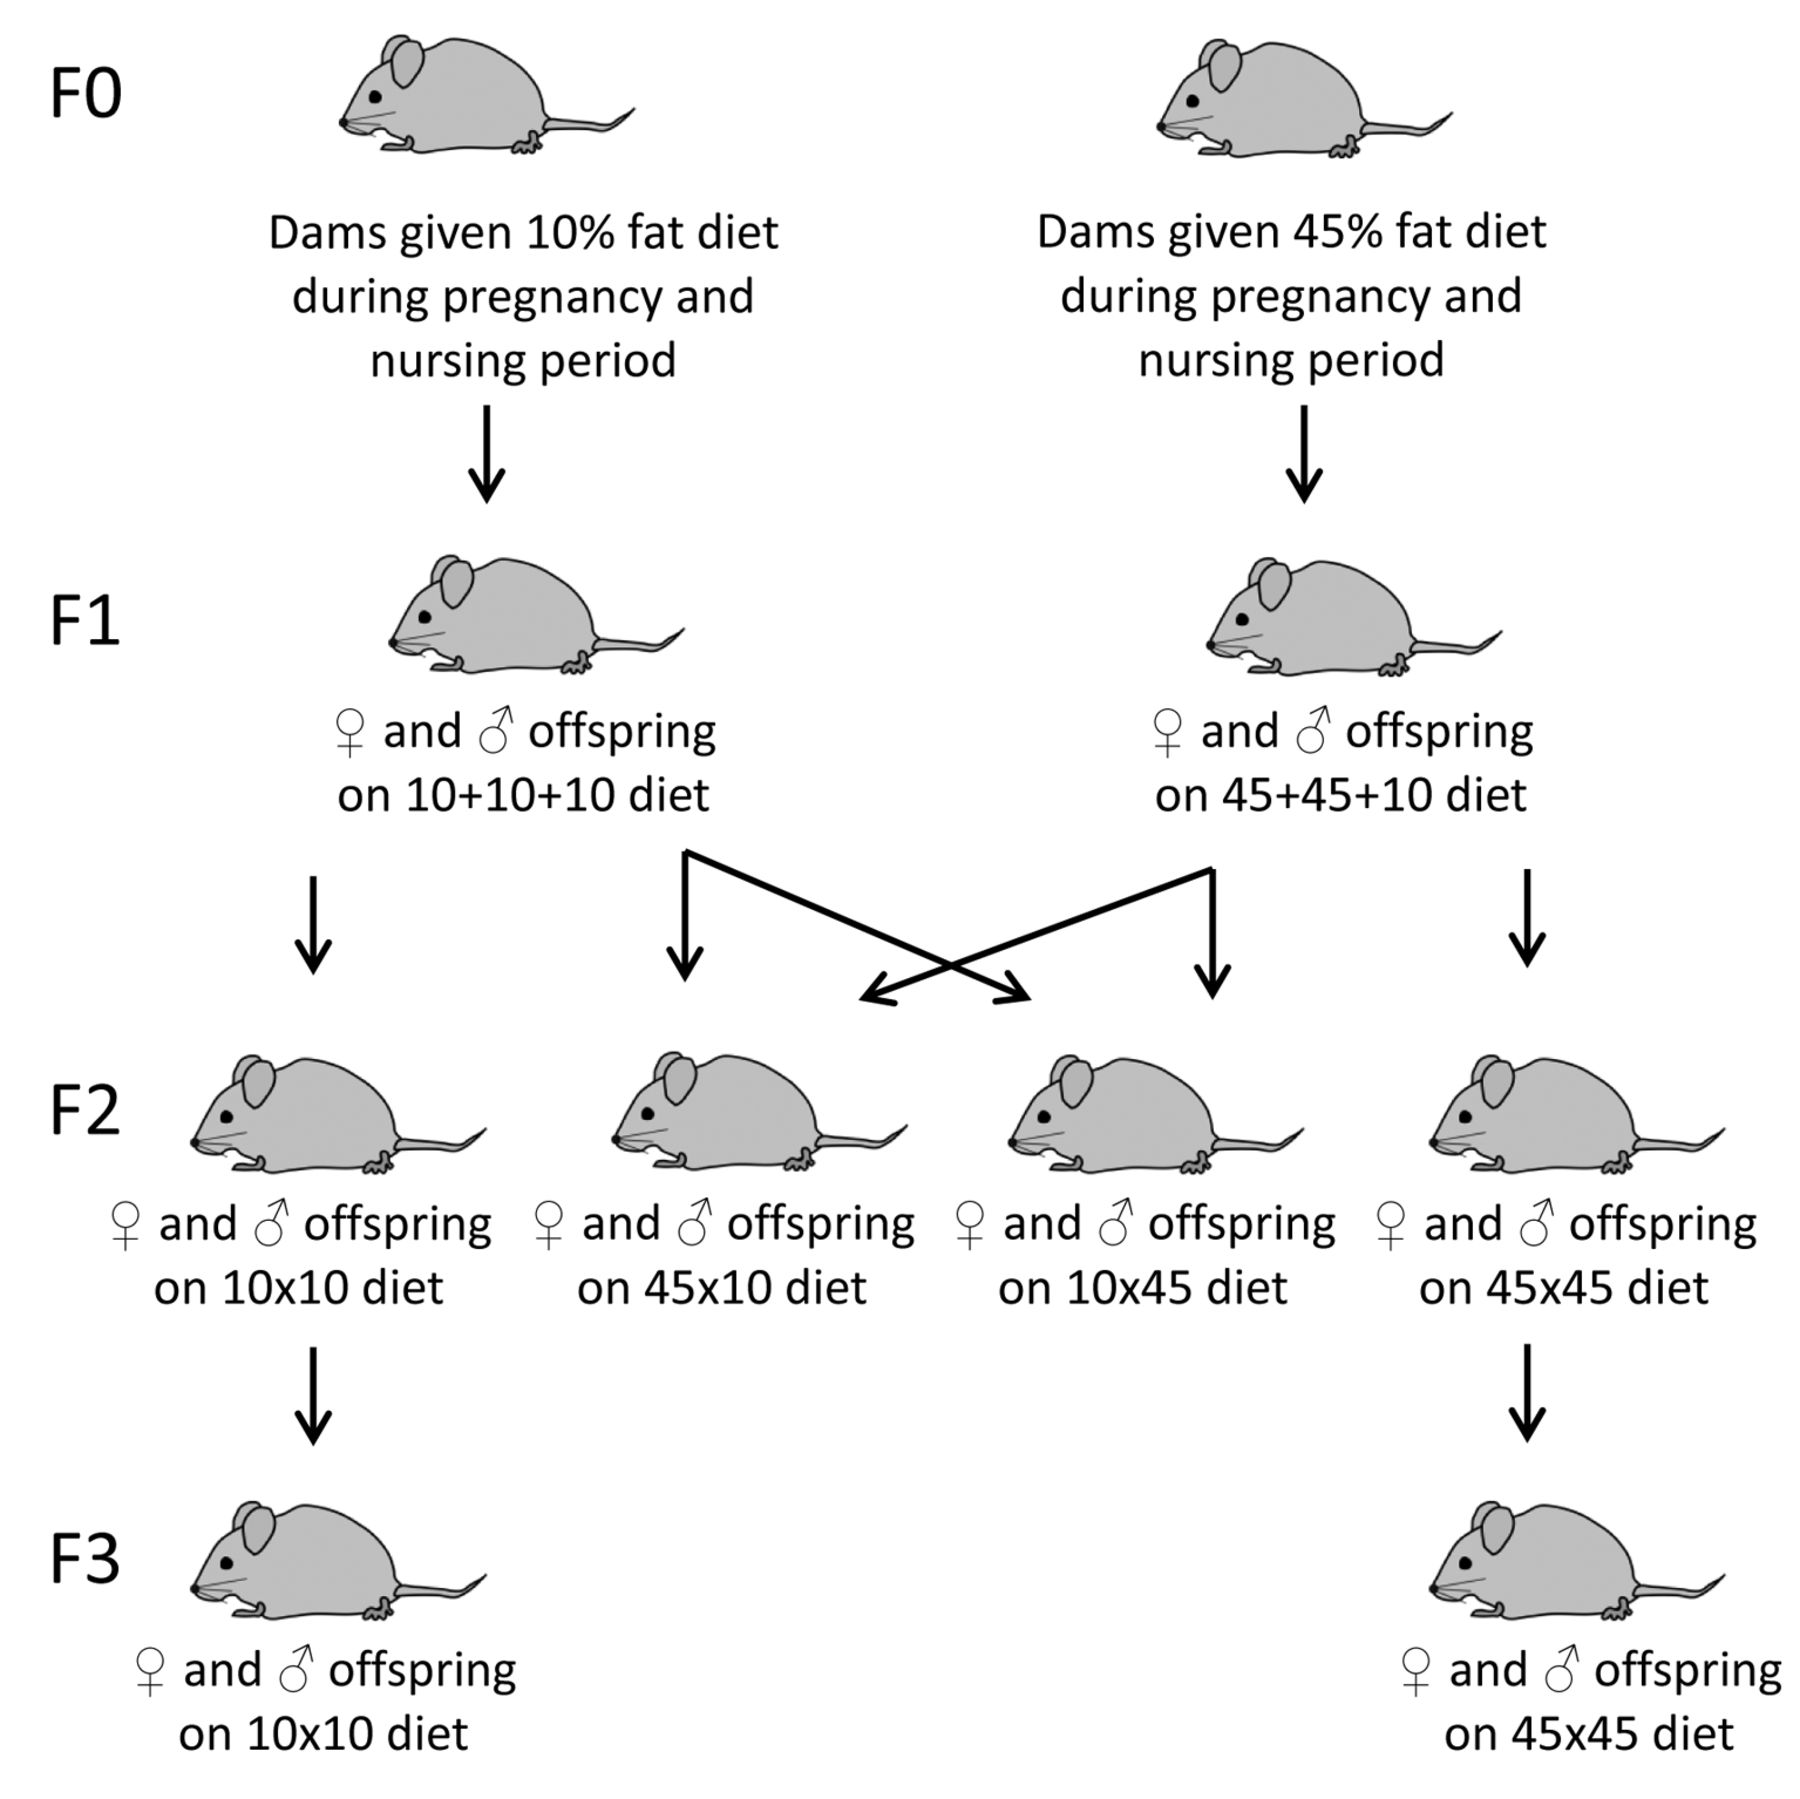
Experimental design. The dams in the F0 generation were given either a 10% fat diet or a 45% fat diet during their pregnancy and nursing periods. Their offspring in the next three generations, F1, F2 and F3, were used in this experiment and constitute the following dietary treatment groups: F1 10+10+10: Mice in the F1 generation were exposed to a 10% fat diet throughout life, i.e. in each of the three periods in utero, during nursing and from weaning to termination. F1 45+45+10: Mice in the F1 generation were exposed to a 45% fat diet in utero and during nursing and 10% fat diet from weaning to termination. F2 10×10: Mice in the F2 generation had both parents being exposed to 10% fat diet in utero and during nursing. F2 45×10: Mice in the F2 generation had their mothers exposed to 45% fat diet and their fathers exposed to 10% fat diet in utero and during nursing. F2 10×45: Mice in the F2 generation had their mothers exposed to 10% fat diet and their fathers exposed to 45% fat diet in utero and during nursing. F2 45×45: Mice in the F2 generation had both parents exposed to 45% fat diet in utero and during nursing. F3 10×10: Mice in the F3 generation had both grandparents exposed to 10% fat diet in utero and during nursing. F3 45×45: Mice in the F3 generation had both grandparents exposed to 45% fat diet in utero and during nursing.
Recording and evaluation of body weight. Body weight of the offspring was registered on day 3-4 after birth and thereafter weekly from weaning at 3 weeks of age until termination of the Min/+ mice at 11 weeks of age. The wild-type mice were terminated at 23 weeks of age to study the effects on body weight, organ weights and blood glucose levels at older age. However, the body weight of the wild-type mice was also evaluated at 11 weeks of age, for comparison with the Min/+ mice terminated at 11 weeks. Body weight data were evaluated in three ways, as in our previous study (21); as body weight development expressed as area under the curve (AUC) calculated for the offspring from day 3-4 to week 11 (Min/+ and wild-type mice) and from week 12 to 23 (wild-type mice), using the trapezoidal rule in SigmaPlot 12.3 (Systat Software Inc., San Jose, CA, USA), or as body weight or as body mass index (BMI), both at 11 weeks for the Min/+ mice and at 23 weeks for the wild-type mice. Nasoanal length was recorded at termination to calculate BMI as body weight/nasoanal length2 (in g/cm2).
Blood glucose measurements. Non-fasted blood glucose was measured with a glucometer (FreeStyle Freedom Lite; Abbott Diabetes Care Inc., Alameda, CA, USA) in all the mice by puncture of the saphenous vein in the hind leg at termination, i.e. at 11 and 23 weeks of age for the Min/+ mice and wild-type mice, respectively.
Scoring of small intestinal and colonic tumors. The effects of a high-fat diet were studied on spontaneous tumorigenesis induced by the inherited mutation in the Apc gene. Colon and small intestine were removed separately, rinsed in ice-cold phosphate buffered saline (PBS) and slit open along the longitudinal axis. Intestinal tissues were then spread flat between sheets of filter paper and fixed for at least 48 h in 10% neutral buffered formalin prior to staining with 0.2% methylene blue (Sigma-Aldrich Norway AS, Oslo, Norway). Number, diameter and localization of tumors in the small intestine and colon were scored by transillumination in an inverse light microscope at a magnification of ×20. The scoring was done in order of consecutive mouse numbers unaware of their treatment. Diameters of tumors were scored with an eyepiece graticule. Tumor position along the intestines was registered in cm from the stomach. For each experimental group, incidence of tumors (number of mice with tumors/number of mice in the group), tumor number (mean number of tumors/mouse±standard deviation (SD)) and tumor diameter in mm (mean of all tumors in all mice in the group±SD) were calculated, for small intestine and colon separately.
Absolute and relative organ weights. The liver and spleen were dissected and weighed at termination and the data were evaluated as absolute organ weight (in gram) or as relative organ weight (in %) calculated as absolute organ weight/body weight ×100.
Statistical analyses. The data were evaluated on several levels, first on all mice and then further stratified on Apc genotype, gender, generation and dietary treatment group. The data are presented as mean±SD and were analysed using SigmaPlot 12.3 (Systat Software Inc.). The incidence of colonic tumors was analysed by Fischer exact test (two-tailed probability). For evaluation of all other data, analysis of variance (ANOVA) was used with an appropriate multiple comparison procedure. When testing the influence of a single factor, one-way ANOVA with the Holm-Sidak test for multiple comparisons was used for parametric data or the Kruskal-Wallis ANOVA on ranks with Dunn's test for multiple comparisons was used for non-parametric data. When testing the influence of two factors together, the data were analysed by two-way ANOVA, with the Holm-Sidak test for multiple comparisons. A p-value of <0.05 was considered statistically significant.
Results
Body weight as AUC from day 3-4 to week 11, body weight and BMI at week 11 in Min/+ and wild-type mice. The body weight development over time was evaluated statistically for each dietary treatment group as area under the curve (AUC) from day 3-4 to week 11 for Min/+ female (Figure 2A) and male (Figure 2B) mice and for wild-type (+/+) female (Figure 2C) and male (Figure 2D) mice. The Min/+ mice had a lower AUC compared to wild-type mice, based on all mice and in females and males separately (p<0.001 for all comparisons). This was observed in the F1 (p=0.019) and F2 (p=0.002) generation, but did not reach significance in the F3 generation. Both Min/+ and wild-type male mice had larger AUC than females, which was apparent in all three generations and in all dietary treatment groups (p<0.001 for all comparisons).
In both Min/+ and wild-type mice (Figure 2), the AUC values were higher in the F1 generation than in F2 and F3 generations (p-values were 0.012 to <0.001), whereas the values were not significantly different between the F2 and F3 generations. For each gender separate, there were no significant differences between any of the generations in the Min/+ females, whereas AUC was higher in the F1 generation compared with the F2 generation in wild-type females (p=0.017). In the males separate, the AUC values were higher in the F1 generation than in the F2 and F3 generations both in Min/+ and wild-type mice (p-values were 0.005 to <0.001). AUC was not significantly different between the F2 and F3 generations in Min/+ or wild-type mice, based on all mice or each gender separate.
In the subgroup female Min/+ mice (Figure 2A), the only significant difference in the dietary treatment groups between the generations was that the F3 mice exposed to a 45% fat diet via both ancestors had higher AUC than the F2 mice with a maternal 45% fat dietary exposure (p=0.014). In the male Min/+ mice (Figure 2B), the only significant differences were that the F1 mice exposed to a 45 % fat diet had higher AUC than the F2 mice exposed via both ancestors to a 10% fat diet (p=0.008) and the F2 mice exposed via both ancestors to a 45% diet (p=0.001) and higher than the F3 mice exposed via both ancestors to a 10% diet (p=0.003). In the female wild-type mice (Figure 2C), the significant differences in the dietary treatment groups between generations were that F1 mice exposed to a 45 % fat diet had higher AUC than F2 mice with maternal exposure to a 45% fat diet (p<0.001) and F2 mice with paternal exposure to a 45% fat diet (p=0.003) and compared to F3 mice exposed via both ancestors to a 10% fat diet (p=0.015). The F3 females exposed to a 45% fat diet via both ancestors had higher AUC than the F2 mice exposed via maternal 45% fat diet (p=0.047). In the wild-type males (Figure 2D), the F1 mice exposed to a 45 % fat diet had higher AUC than the F2 mice with maternal exposure to a 45% fat diet (p=0.032) and the F3 mice exposed via both ancestors to a 10% fat diet (p=0.041).
When comparing the differences in AUC between the dietary treatment groups within the generations, there were no significant differences between exposure to a 45% fat diet or a 10% fat diet within the F2 or F3 generations in either the female or male Min/+ mice (Figures 2A, B) or even in female or male Min/+ and wild-type mice together or in all mice. In the female wild-type mice (Figure 2C), as well as in Min/+ and wild-type females together, the F2 mice exposed via both ancestors to a 45% fat diet had higher AUC than the F2 mice with only maternal exposure to a 45% fat diet (p<0.001 for both comparisons). In the male wild-type mice (Figure 2D), there were no significant differences in AUC between the dietary treatment groups within the generations.

Body weight development as area under the curve (AUC). AUC (arbitrary units, mean±SD) is calculated from day 3-4 to week 11 in (A) Min/+ females, (B) Min/+ males, (C) wild-type females and (D) wild-type males, as well as from age 12 to 23 weeks for (E) wild-type females and (F) wild-type males. The dietary treatment groups (n=21-33) are as explained in the legend to Figure 1. a-fWithin each figure (each subgroup), dietary treatment groups with similar letters were significantly different (p<0.05) for comparisons between or within (letters in bold) the generations.
When body weight was evaluated in Min/+ mice as terminal body weight or terminal BMI at 11 weeks, the results were essentially similar as reported above for body weight development as AUC from day 3-4 to week 11 (data not shown). There were only a few inconsistent differences in which dietary treatment groups that were significantly different between the generations, going in opposite directions. There were no significant differences between exposure to a 45% or a 10% fat diet within the F1, F2 or F3 generations.
Body weight as AUC from week 12 to 23, body weight and BMI at week 23 in wild-type mice. The wild-type mice were not terminated until 23 weeks of age to study the impact of early-life exposure to a 45% fat diet in older mice. The body weight development of the wild-type mice offspring was evaluated statistically as AUC from week 12 to week 23 for each dietary treatment group, for females (Figure 2E) and males (Figure 2F). The male wild-type mice were significantly heavier than the females also at this age, which was apparent in all three generations and in all dietary treatment groups (p<0.001 for all comparisons).
The AUC values were higher in the F1 generation than in the F2 and F3 generations, based on all mice and in both the females and males separately (p<0.001 for all comparisons) (Figures 2E, F). AUC was significantly higher in the F3 generation compared to the F2 generation for both genders together (p=0.046); however, this comparison did not reach significance for each gender separate. In the subgroup female wild-type mice (Figure 2E), the F1 mice exposed to a 10 % fat diet had higher AUC than the F2 mice with either maternal or paternal exposure to a 45% fat diet (p=0.010 and p=0.015, respectively). Also, F1 mice exposed to a 45 % fat diet had higher AUC than F2 mice exposed via both ancestors to a 10% fat diet (p=0.003) and F2 mice with both a maternal (p<0.001) and a paternal (p<0.001) 45% fat dietary exposure. The F1 mice exposed to a 45 % fat diet also had higher AUC than the F3 mice exposed via both ancestors to a 10% fat diet (p=0.003). In the male wild-type mice (Figure 2F), the significant differences were that the F1 mice exposed to a 45 % fat diet had higher AUC than the F2 mice exposed via both ancestors to a 10% fat diet (p=0.006), F2 mice with both a maternal (p=0.001) and a paternal (p=0.002) 45% fat dietary exposure and the F3 mice exposed via both ancestors to a 10% fat diet (p=0.005).
When comparing differences in AUC between dietary treatment groups within the generations, there were no significant differences between exposure to a 45% fat diet or a 10% fat diet within F2 or F3 generations either in female (Figure 2E) or male (Figure 2F) wild-type mice or in both genders together.
When body weight was evaluated in the wild-type mice as terminal body weight or terminal BMI at 23 weeks, the results were essentially similar as reported above for body weight development as AUC from week 12 to week 23 (data not shown). There were only a few inconsistent differences in which dietary treatment groups that were significantly different between the generations, going in opposite directions. There were no significant differences between exposure to a 45% fat diet or a 10% fat diet within the F1, F2 or F3 generations.
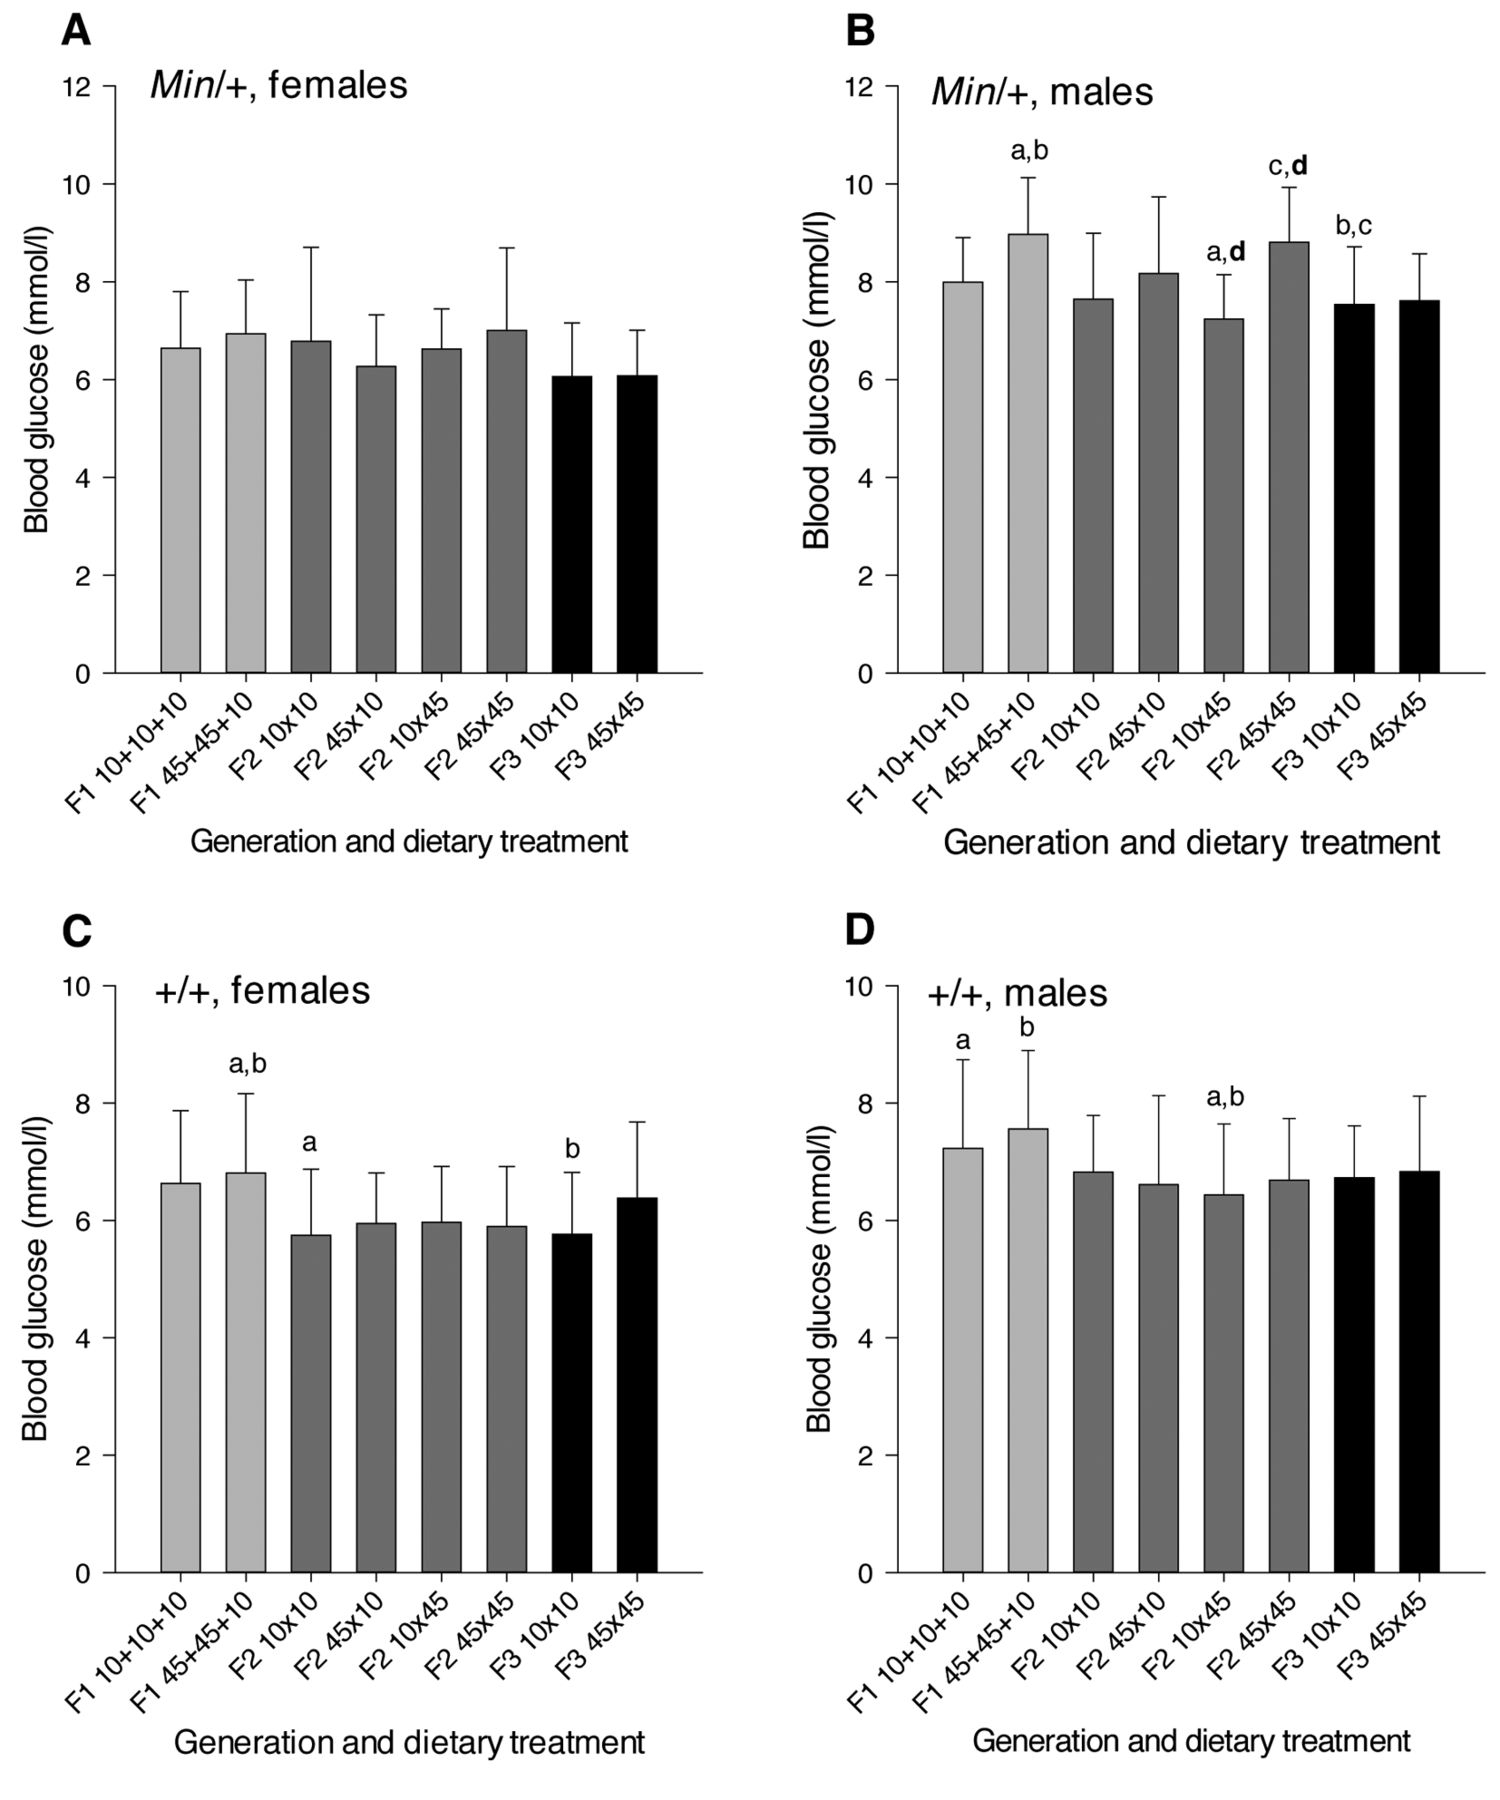
Blood glucose levels. To test the hypothesis that obesity may affect intestinal tumorigenesis by disturbing the blood glucose regulation, blood glucose levels (non-fasted) were measured in mice at termination, i.e. at week 11 for the Min/+ females (Figure 3A) and males (Figure 3B), as well as at week 23 for the wild-type females (Figure 3C) and males (Figure 3D). The blood glucose levels were significantly higher in male compared with female mice, which was apparent in all three generations of both Min/+ and wild-type mice (p-values were 0.003 to <0.001). This was also the case for all of the dietary treatment groups in Min/+ mice (p-values were 0.023 to <0.001), except in the F2 Min/+ mice with paternal exposure to a 45% diet. In the wild-type mice, the blood glucose levels were significantly higher in males than females in F1 mice exposed to a 45% fat diet (p=0.015) and in F2 mice with both parents given a 10% fat diet (p<0.001) or a 45% fat diet (p=0.005), whereas these comparisons did not reach significance for the other dietary treatment groups.
In Min/+ mice (Figures 3A, B), the blood glucose values were higher in the F1 generation than in the F3 generation (p=0.001), while the F2 generation had higher values than the F3 generation (p=0.002) in females and males together. In females separately, the F2 generation had higher blood glucose levels than the F3 generation (p=0.014) and, in males separately, the F1 generation had higher levels than the F3 generation (p=0.023). In wild-type mice (Figures 3C, D), the F1 generation had higher blood glucose values than both the F2 and F3 generations, based on all mice and females or males separately (p-values were 0.017 to <0.001), whereas the values were not significantly different between the F2 and F3 generations.
In the subgroup Min/+ female mice (Figure 3A), there were no significant differences between generations. In male Min/+ mice (Figure 3B), the F1 mice exposed to a 45% fat diet had higher blood glucose values than the F2 mice having a paternal exposure to a 45% fat diet (p=0.006) and the F3 mice exposed via both ancestors to a 10% fat diet (p=0.042). The F2 mice exposed via both ancestors to a 45% fat diet had higher blood glucose levels than the F3 mice exposed via both ancestors to a 10% fat diet (p=0.003). In the wild-type females (Figure 3C), the F1 mice exposed to a 45% fat diet had higher blood glucose values than the F2 mice exposed via both ancestors to a 10% fat diet (p=0.014) and the F3 mice exposed via both ancestors to a 10% fat diet (p=0.035). In the wild-type males (Figure 3D), the F1 mice exposed to either a 10% or a 45% fat diet had higher blood glucose values than the F2 mice having a paternal exposure to a 45% fat diet (p=0.005 and p=0.043, respectively).

Blood glucose levels. Non-fasted blood glucose levels (mmol/l, mean±SD) were measured in (A) Min/+ females, (B) Min/+ males, (C) wild-type females and (D) wild-type males. The dietary treatment groups (n=9-33) are as explained in Figure 1. a-dWithin each figure, dietary treatment groups with similar letters were significantly different (p<0.05) for comparisons between or within (letters in bold) the generations.
When comparing differences in blood glucose levels between the dietary treatment groups within generations, there were no significant differences in Min/+ female mice or in the female or male wild-type mice. In the male Min/+ mice (Figure 3B), the F2 mice having both maternal and paternal exposure to a 45% fat diet had higher blood glucose values than the F2 mice having only paternal high-fat exposure (p<0.001).
Number of small intestinal tumors. All Min/+ mice had small intestinal tumors (adenomas), independent of dietary exposures, confirming 100% incidence of small intestinal tumors as is commonly found in the Min/+ mice (25, 28). The number of small intestinal tumors was not significantly different between the genders, based on all mice or in any of the three generations or in any of the dietary treatment groups; shown separately for females (Figure 4A) and males (Figure 4B).
The numbers of small intestinal tumors were significantly lower in the F1 generation compared with both the F2 or F3 generations, in all mice and in females or males separately (p<0.001 for all comparisons), whereas the tumor numbers were not significantly different between the F2 and F3 generations (Figure 4). When comparing the number of small intestinal tumors between the generations, both dietary treatment groups in the F1 generation in both genders had lower number of tumors than all dietary treatment groups both in the F2 and F3 generations (p-values were 0.011 to <0.001), whereas there were no significant differences between any of the dietary treatment groups in the F2 vs. in the F3 generation (Figure 4).
When comparing the numbers of small intestinal tumors between the dietary treatment groups within each generation, there were no significant differences between any of the dietary treatment groups within the F2 or F3 generations in either gender separate (Figure 4) or in both genders together. In the F1 generation, the mice on a 45% fat diet had higher number of small intestinal tumors than the mice on a 10% fat diet in females and males together and in males separately (p<0.05 for both comparisons) (21) (Figure 4).
Two F3 wild-type mice with both grandparents on 45% fat diet had one tumor each in the middle third of the small intestine; one (diameter=1.5 mm) in a female and one (diameter=1.6 mm) in a male.
Size of small intestinal tumors. The small intestinal tumors had diameters of 0.2-3.9 mm. The males had larger tumor diameters than the females based on all mice and in the F2 and F3 generations (p<0.001 for all comparisons), whereas this difference was not significant in the F1 generation (Figure 5). Males also had significantly larger tumors than the females within all dietary treatment groups in the F2 and F3 generations (p<0.001 for all comparisons). In the F1 generation, in the mice exposed to a 10% fat diet males had larger tumors than females (p=0.036), whereas female mice exposed to a 45% fat diet had larger tumors than the males (p=0.006). Because of the significant differences in tumor diameters between the genders, the data are treated statistically for females (Figure 5A) and males (Figure 5B) separately.
The diameters of the small intestinal tumors were significantly higher in the F1 generation compared with both the F2 or F3 generations and the tumor diameters were significantly higher in the F2 generation than in the F3 generation, in all mice and in females or males separately (p<0.001 for all comparisons) (Figure 5). The mice exposed to both a 10% fat diet and a 45% fat diet in the F1 generation had larger tumors than all the dietary treatment groups in the F2 and F3 generations, both in females and males (p ≤ 0.001 for all comparisons).
In the F1 mice, the diameters of the small intestinal tumors were significantly higher with a 45% fat diet than with a 10% fat diet in females (p=0.003) and both genders together (p=0.035), but not in males separately (21) (Figure 5). In the F2 females (Figure 5A), the mice with either maternal or paternal exposure to a 45% fat diet were not significantly different from the tumor diameter in the mice exposed via both ancestors to a 10% fat diet, whereas the mice exposed via both ancestors to a 45% fat diet had larger tumors than the other three dietary treatment groups (p-values were 0.023 to <0.001). In the F2 males (Figure 5B), the mice exposed via both ancestors to a 45% fat diet or had paternal exposure to a 45% diet had smaller tumors than the mice exposed via both ancestors to a 10% fat diet (p=0.008 and p<0.001, respectively), whereas the other dietary treatment groups were not significantly different within the F2 generation. In the F3 females (Figure 5A), the mice exposed via both ancestors to a 45% fat diet had smaller tumors than the mice exposed via both ancestors to a 10% fat diet (p=0.006). In the F3 males (Figure 5B), the tumor diameter was not significantly different between the two diets.
Colonic tumors. In the C57BL/6J strain, the small intestine is the main target organ for spontaneous tumorigenesis caused by the Min mutation. Very few tumors (diameters=0.8-6.0 mm) were found in the colon compared with in the small intestine and only in some of the mice; consistent with results found in our previous experiments with Min/+ mice (25, 28). The results were essentially similar to in the small intestine but there were significantly higher incidence and number of colonic tumors in males than in females (p-values were 0.044 to <0.001) (data not shown). There were significantly higher numbers of colonic tumors in the F2 and F3 generations vs. in the F1 generation in both genders (p-values were 0.032 to <0.001) but no differences between the F2 and F3 generations (data not shown). There were no significant differences in incidence, number or diameter of colonic tumors between any of the dietary treatment groups within the F1, F2 or F3 generations, either in female or male mice (data not shown).
Localization of tumors along the small intestine and colon. In both genders, the majority of tumors were localized in the distal two-thirds (in the middle and distal parts) of the small intestine and the few colonic tumors present were localized mainly in the middle to distal parts of the colon, in the mice in all dietary treatment groups (data not shown), as has usually been found in our previous experiments with Min/+ mice (25, 28).
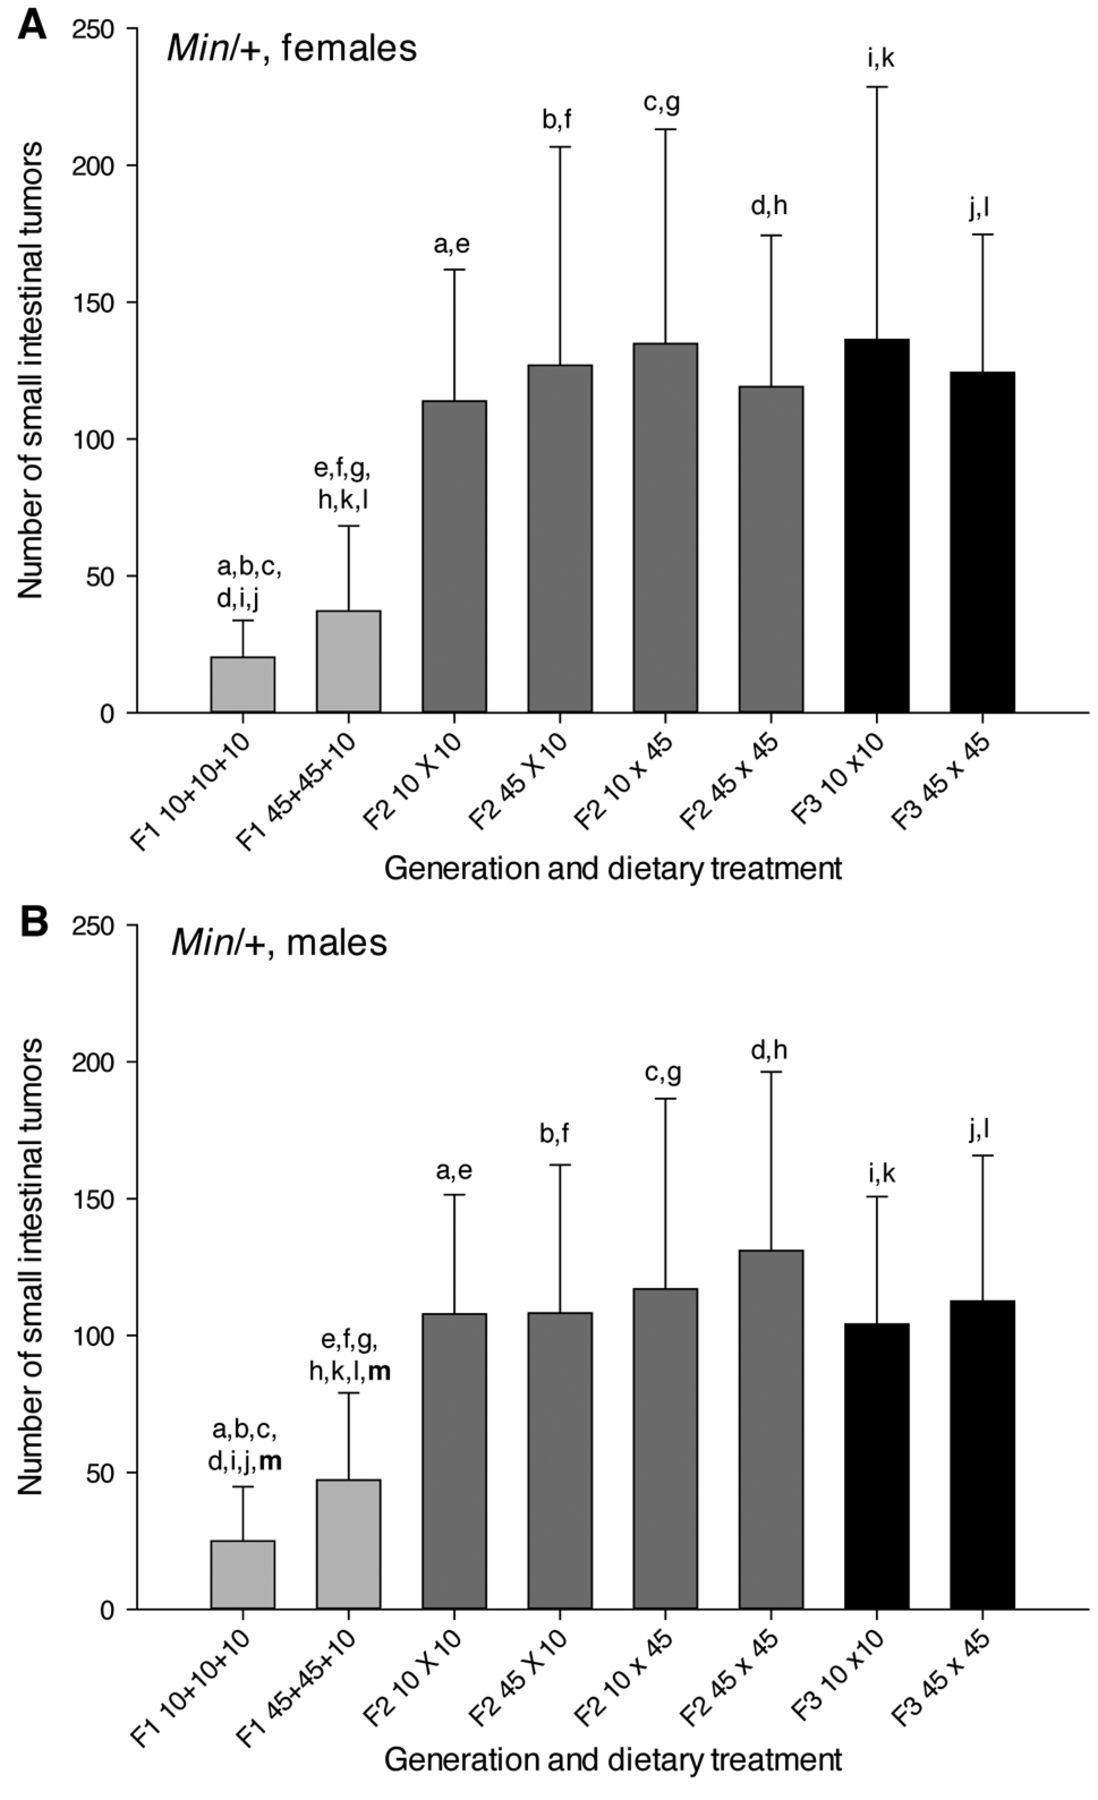
The number of small intestinal tumors in Min/+ mice. The number of small intestinal tumors (mean±SD) is shown for (A) female and (B) male mice. The dietary treatment groups (n=22-32) are as explained in Figure 1. a-mWithin each figure, dietary treatment groups with similar letters were significantly different (p<0.05) for comparisons between or within (letters in bold) the generations.
Absolute and relative liver and spleen weights. To examine if the obesogenic treatment could affect organ weights, in addition to body weight, the absolute and relative weights of liver and spleen were measured at termination of the Min/+ mice at 11 weeks of age and of the wild-type mice at 23 weeks of age, in the F1, F2 and F3 generations. There were some significant, but non-consistent, differences between the genders and between generations for these end-points; however, there were no significant differences in absolute or relative liver weight, or in absolute or relative spleen weight, between the dietary treatment group within the same generation, in any gender or generation (data not shown).
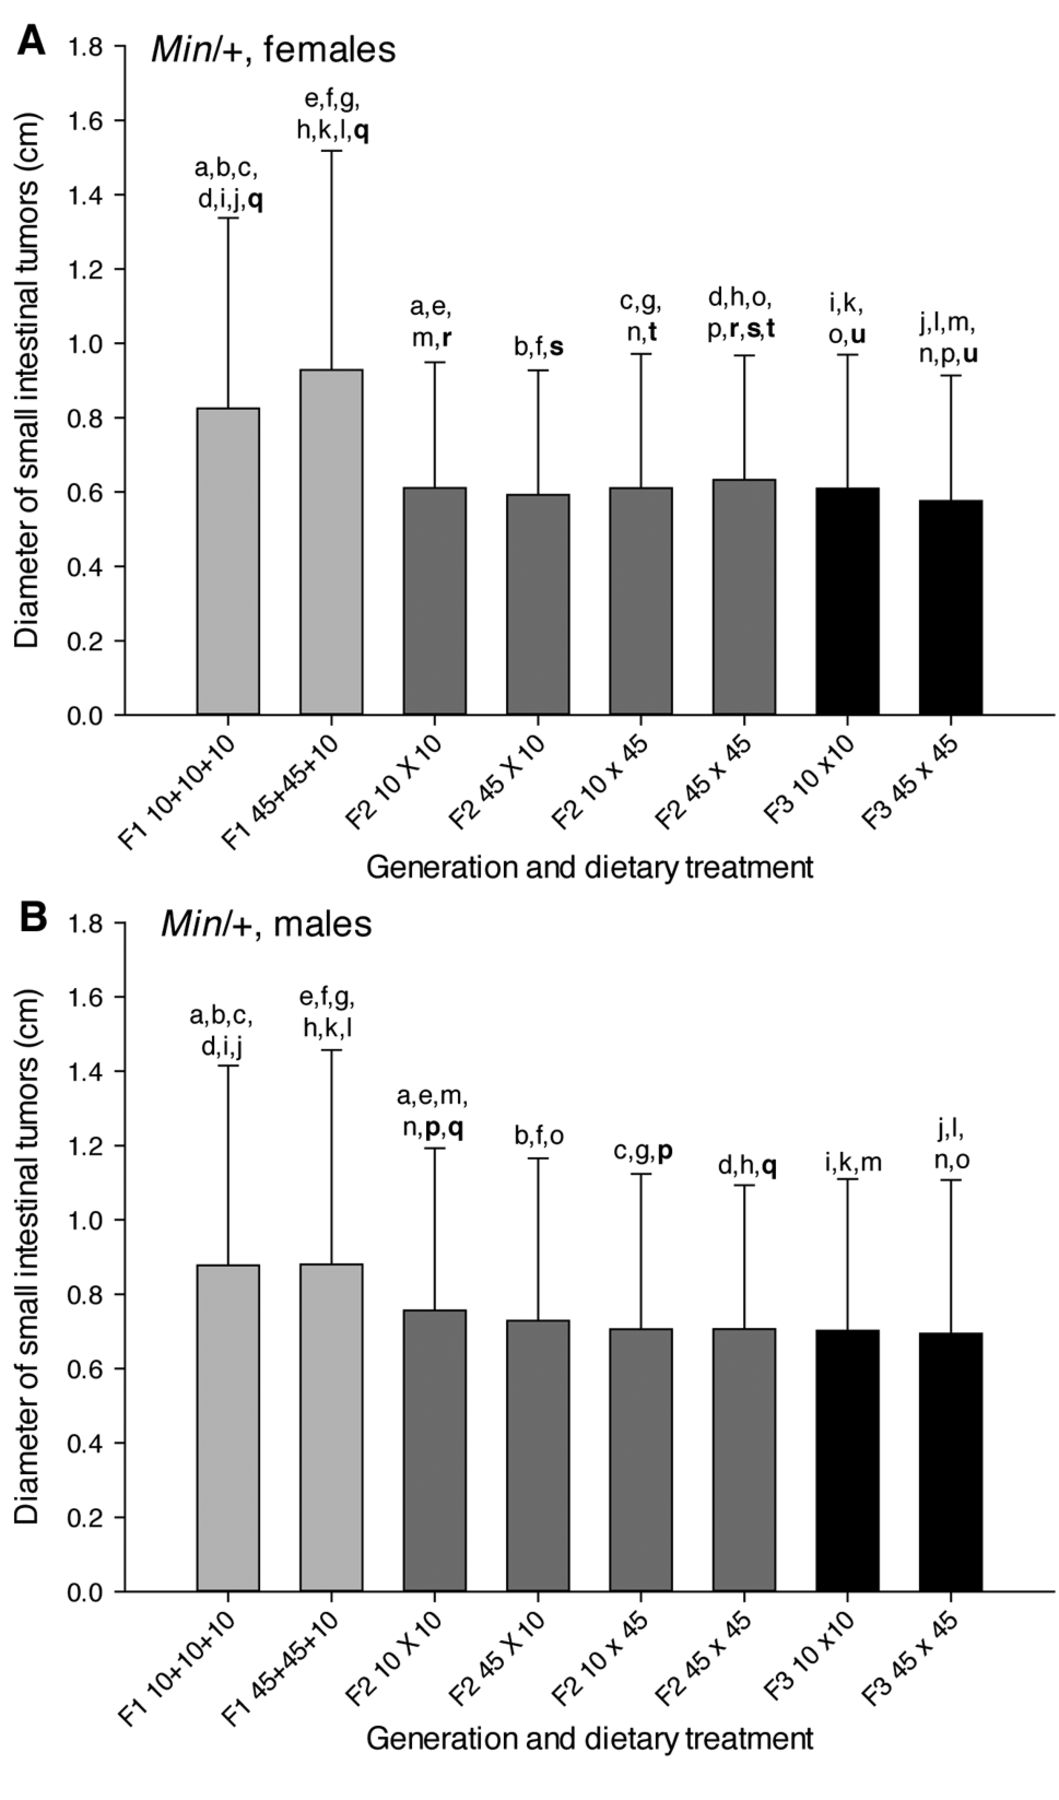
The diameter of small intestinal tumors in Min/+ mice. The diameter (in mm) of small intestinal tumors (mean±SD) is shown for (A) female and (B) male mice. The dietary treatment groups (n=22-32) are as explained in Figure 1. a-uWithin each figure, dietary treatment groups with similar letters were significantly different (p<0.05) for comparisons between or within (letters in bold) the generations.
Discussion
In our previous study (21), we showed that early-life exposure to a 45% fat diet, i.e. exposure during both the in utero and nursing periods, significantly increased body weight as AUC from day 3-4 to week 11 compared to exposure to a 10% fat diet during the same periods in the F1 generation. This was statistically significant when evaluating both Min/+ and wild-type mice and both genders together (p<0.001) and also in the subgroup of Min/+ and wild-type males together (p=0.010). In the present study, when comparing differences in body weight as AUC between the influence of a 45% fat diet vs. a 10% fat diet within the F2 or F3 generations, there were no significant differences either in both genders together or in females or males separately, in Min/+ mice (Figures 2A, B) or in wild-type mice (Figures 2C, D) at 11 weeks of age. Therefore, the effects on adult body weight by early-life exposure to a 45% fat diet did not appear to be transferred to the following two generations.
Similarly, in wild-type mice at 23 weeks of age, there were no significant differences in body weight as AUC between the influence of a 45% fat diet vs. a 10% fat diet within the F2 or F3 generations either in both genders together or in females or males separately (Figures 2E, F). However, this is in accordance with the results shown previously in the F1 generation for body weight development at this age (21). Apparently, the effect on body weight of early-life exposure to a high-fat diet disappears between 11 and 23 weeks of age in these mice. However, since this is after they become reproductively active, in theory, the observed effects in F1 could have been transferred to the next generation.
In accordance with the lack of effects on body weight by the 45% fat diet in the F2 and F3 generations, there were no effects on absolute or relative liver weight or on absolute or relative spleen weight.
The ability of an external factor, such as diet, to induce a transgenerational phenotype requires a genetic or epigenetic event mediated through the germ line (26). Whether the effects observed in the F1 generation on body weight were induced by genetic or epigenetic modifications is not known. However, since these effects were not detected in the following F2 and F3 generations, they were more likely caused by reversible epigenetic modifications than irreversible genetic events.
Epidemiological studies have demonstrated a correlation between parental obesity and development of obesity in their children, with most impact being seen with two obese parents (29, 30). Therefore, obesity in a human being may be influenced by transgenerational effects from the parents or, possibly, even from the grandparents. Although little is known about the underlying mechanisms for transgenerational transfer of obesity in humans, one study demonstrated a correlation between the epigenetic gene promoter methylation of umbilical cord tissue DNA from the neonates and maternal pregnancy diet or the children's adiposity at nine years of age (31).
Blood glucose levels were measured to study the hypothesis of disrupted blood glucose regulation as a link between obesity and intestinal tumorigenesis (22, 23). In a previous study with ob/ob mice, which are getting obese because of a mutated leptin gene (32), we found that genetically-induced obesity caused hyperglucosemia and insulinemia and that a 45% fat diet further increased glucose, but not insulin levels, in plasma (33). In the present study, the male Min/+ mice in the F2 generation, having both maternal and paternal exposure to a 45% fat diet, had higher blood glucose values than the F2 mice having only paternal high-fat exposure (p<0.001) (Figure 3B). However, the mice in these two groups did not have higher blood glucose levels than mice in the dietary treatment group given a 10% fat diet via both parental linages. The lack of effects on the blood glucose levels of a 45% fat diet compared to a 10% fat diet within the same generation in both Min/+ and wild-type mice is similar to the results shown previously in the F1 generation (21).
When comparing the numbers of small intestinal (or colonic) tumors between the dietary treatment groups within each generation, there were no significant differences between any of the dietary treatment groups within the F2 or F3 generations in either gender (Figure 4). This was in contrast to the F1 generation where the mice on a 45% fat diet had a higher number of small intestinal tumors than the mice on a 10% fat diet both in females and males together and in males separately (p<0.05 for both comparisons) (Figure 4) (21). Therefore, the effects on intestinal tumorigenesis in adult mice by early-life exposure to a 45% fat diet did not appear to be transferred to the following two generations.
Environmental factors, such as chemical carcinogens, may promote a transgenerational susceptibility to cancer by causing, for instance, increased inactivation and penetrance of tumor suppressor genes (34, 35). In Min/+, the intestinal tumors arise when the remaining wild-type allele of Apc loses its function. This could happen either by genetic changes, such as a mutation or by homologous mitotic recombination, or the wild-type allele can be epigenetically silenced (36, 37).
In F1 females (p=0.003) (Figure 5A) and both genders together (p=0.035), the small intestinal tumors in mice exposed to a 45% fat diet had larger tumor diameters than mice exposed to a 10% fat diet, which could indicate a possible effect on tumor growth from this early-life high-fat diet exposure. However, this was not seen in the males separately (Figure 5B). In the F2 males (Figure 5B), the mice exposed via both ancestors to a 45% fat diet or had paternal exposure to a 45% diet had smaller tumors than the mice exposed via both ancestors to a 10% fat diet (p=0.008 and p<0.001, respectively), that could indicate induction of new tumors by the high-fat diet exposure. Similarly, in the F3 females (Figure 5A), the mice exposed via both ancestors to a 45% fat diet had smaller tumors than the mice exposed via both ancestors to a 10% fat diet (p=0.006). However, these results were not found in F2 females (Figure 5A) or in F3 males (Figure 5B). Therefore, since the direction of the differences in tumor diameter was not consistent between genders, generations and dietary treatment groups, it is likely that the differences are merely caused by chance because of the high number of tumors, as is often seen in Min/+ mice for diameter of small intestinal tumors.
The higher numbers (Figure 4) and lower diameters (Figure 5) of the tumors in the small intestine and colon (data not shown) in the F2 and F3 generations vs. the F1 generation may be caused by the different diets used. The dams giving birth to the F2 and F3 mice were given a regular natural ingredients breeding diet during mating, pregnancy and nursing, whereas the dams giving birth to the F1 mice were on the purified ingredients 10% or 45% fat diets, as described in Materials and Methods section. The mice in the F2 and F3 generations received a standard natural ingredients maintenance diet from weaning until termination, whereas the F1 mice were on the purified ingredients 10% or 45% fat diets. It has been shown that the choice of commercial rodent breeding and maintenance diets may strongly impact the induction of spontaneous tumors and flat aberrant crypt foci in the intestine of Min/+ mice (38). However, these dietary dissimilarities could influence the differences between the generations, but not between the dietary treatment groups within the generations, since the 10% and 45% fat diets were matched on proteins, vitamins, minerals and sucrose as percentage of the calories and the standard breeding and maintenance diets within each generation were exactly similar. Therefore, independent of background variations in spontaneous tumor numbers between generations, the comparisons within the generations show that the observed effects on tumor numbers by the 45% fat diet in the F1 generation were not transferred to the F2 and F3 generations.
In conclusion, in this study it was demonstrated that the previously observed effects of early-life exposure to a high-fat diet during intrauterine and nursing periods on obesity and intestinal tumorigenesis in adult Min/+ mice were not inherited transgenerationally.
Acknowledgements
This work was funded partly by The Research Council of Norway (Project no. 196112/H10) that had no role in study design, analysis of data, writing or publication of this paper. The Author thanks Hege Hjertholm, Tone Rasmussen and Gunvor Åkesson for excellent technical assistance with PCR genotyping, weighing of mice and staining of intestines. Victor Labay Ong is thanked for help with mouse care.
Footnotes
Conflicts of Interest
The Author declares that she has no conflicts of interest regarding this study.
- Received June 3, 2016.
- Revision received June 23, 2016.
- Accepted June 24, 2016.
- Copyright© 2016 International Institute of Anticancer Research (Dr. John G. Delinassios), All rights reserved
References
In this issue


Jump to section
Related Articles
Cited By...
- No citing articles found.