


Abstract
Background: Meningioma is the most common intracranial tumor. The aim of the present study was to correlate apparent diffusion coefficient (ADC) values with cellularity, Ki-67 and nucleic area in meningioma cases. Patients and Methods: Twenty-four meningothelial meningiomas were included in the study. Diffusion-weighted imaging was performed using a multi-slice single-shot echo-planar imaging sequence. In all lesions minimal ADC values (ADCmin), mean ADC values (ADCmean), and maximal ADC values (ADCmax) were estimated. Additionally, true ADC values (D) were calculated. All tumors were resected and analyzed histopathologically. The tumor proliferation index was estimated on Ki-67 antigen-stained specimens. Cell density was calculated in every case as an average cell count per five high-power fields. All histological samples were analyzed for estimation of nucleic size and nucleic area. The ImageJ software 1.48v was used for analysis. Analyses of the estimated parameter were performed by means of two-sided t-tests. Correlation analysis was performed using the Pearson's product moment correlation. Results: The mean values of ADCmin, ADCmean, ADCmax, and D were 0.64±0.11, 0.89±0.13, 1.15±0.27, and 0.75±0.20×10⁻³ mm2s−1, respectively. The estimated mean cell count was 1160.08±33.86 cells and the mean level of the proliferation index was 3.46±2.84%. The mean values of average nucleic area and total nucleic area were 65.42±19.38 μm2 and 64481.87±21120.02 μm2, respectively ADCmean correlated significant with Ki-67 level, average nucleic area, and total nucleic area, but not with cell count. ADCmin and D correlated significant with cell count and total nucleic area, but not with Ki-67. D was also associated with average nucleic area. ADCmax correlated slightly with cell count. Conclusion: Several relationships between ADC and histological parameters in meningioma were assessed. ADCmean was negatively associated with Ki-67 level, average nucleic area, and total nucleic area. There was no significant correlation between ADCmean and cell count. ADCmin and D correlated well with total nucleic areas and cell count, but not with Ki-67. ADCmax correlated slightly with cell count.
Meningiomas are the most common intracranial tumors (1, 2). There exist three sub-groups of meningiomas: benign or grade 1, atypical or grade 2, and malignant or grade 3 (1, 2). Grade 1 tumors occur most frequently (1). Grade 2 and 3 tumors represent up to 5-10% of all meningiomas (1). Furthermore, meningothelial tumors are a common sub-type of grade 1 meningiomas (1). As previously reported, meningiomas showed low values of apparent diffusion coefficient (ADC) (3, 4). In addition, ADC values were lower in grade 2 and 3 tumors than in grade 1 meningiomas (3, 4).
According to the literature, cellularity has been reported to be a major cause of water diffusion restriction in tissues (5, 6). There exist several reports addressing the association between ADC and cell count in different tumors and tumor-like lesions (7-9). For instance, it has been reported that ADC values correlated strongly with cell density in soft tissue sarcomas (10), laryngeal and pharyngeal carcinomas (8) cervical cancer (11), and prostatic cancer (9). However, other factors such as cell volume, volume of extracellular space, nucleic fraction play also a role in restriction of water diffusion in tissues (5, 12). The aim of the present study was to correlate ADC values with cellularity, nucleic size and nucleic area in meningioma cases.
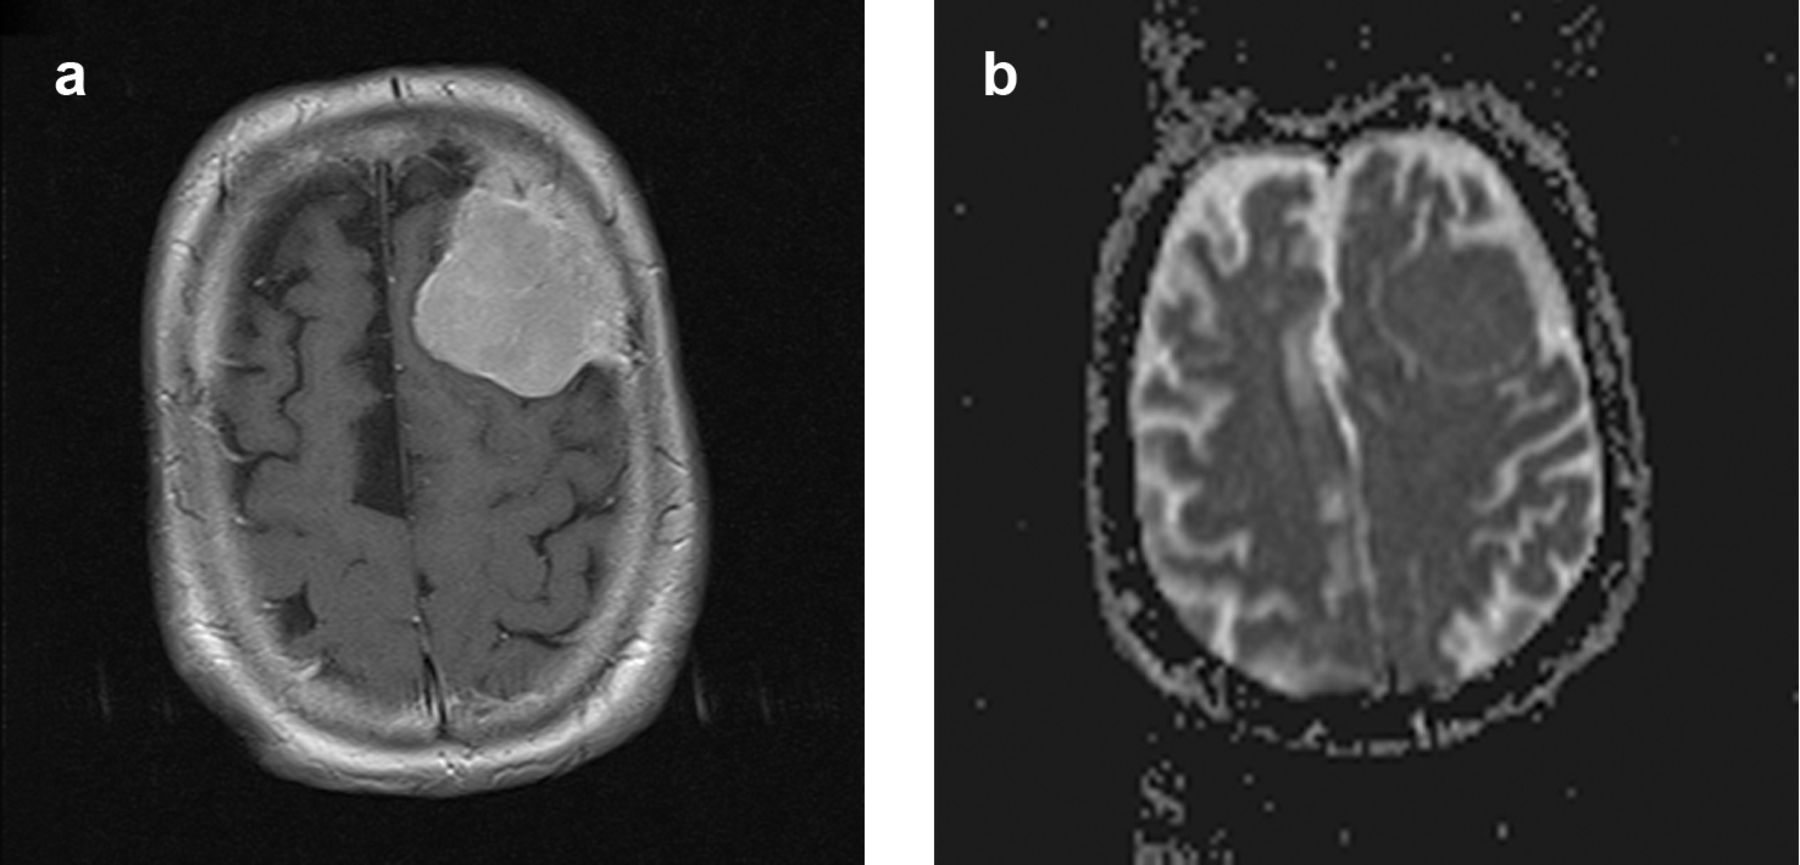


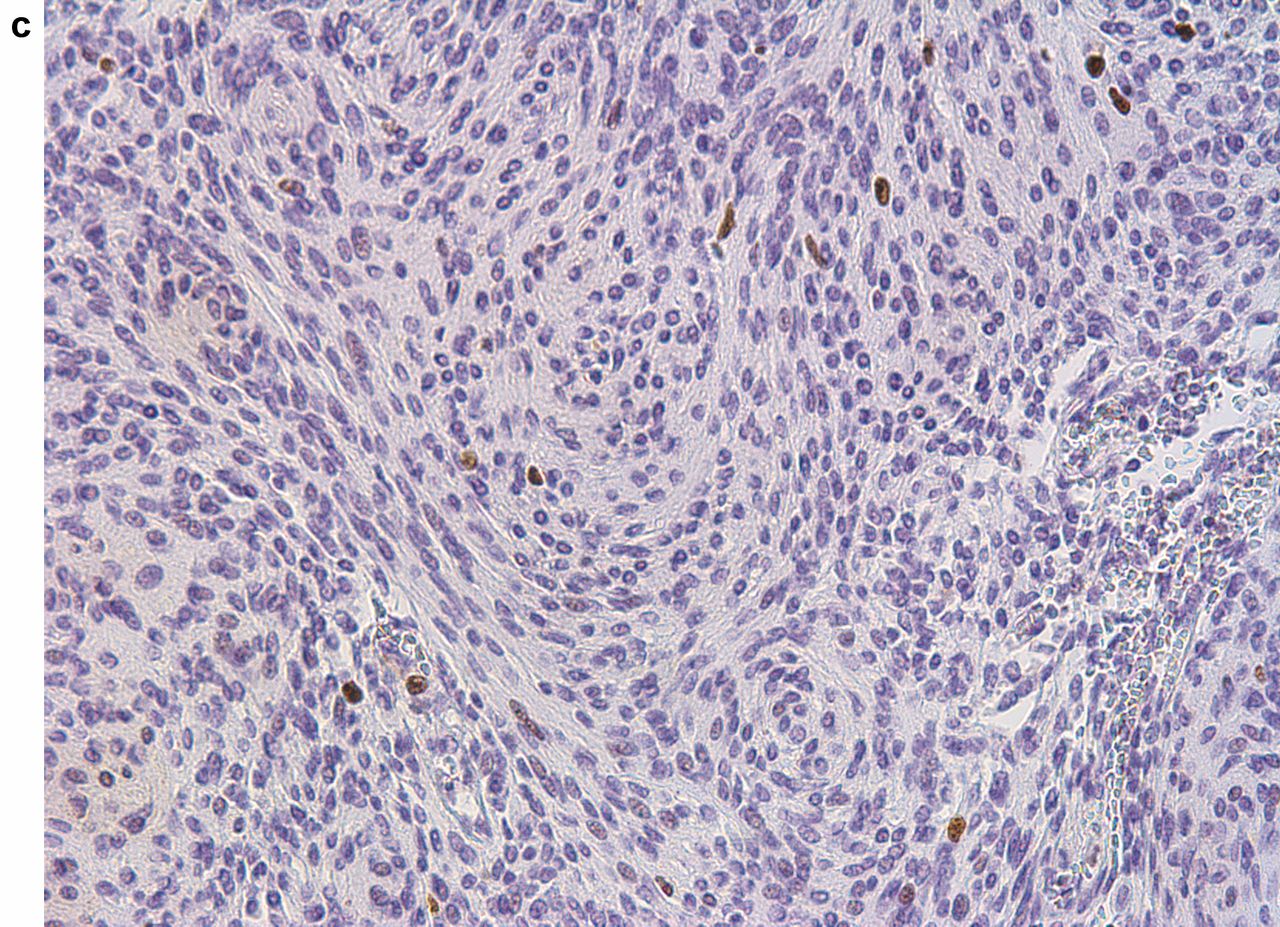
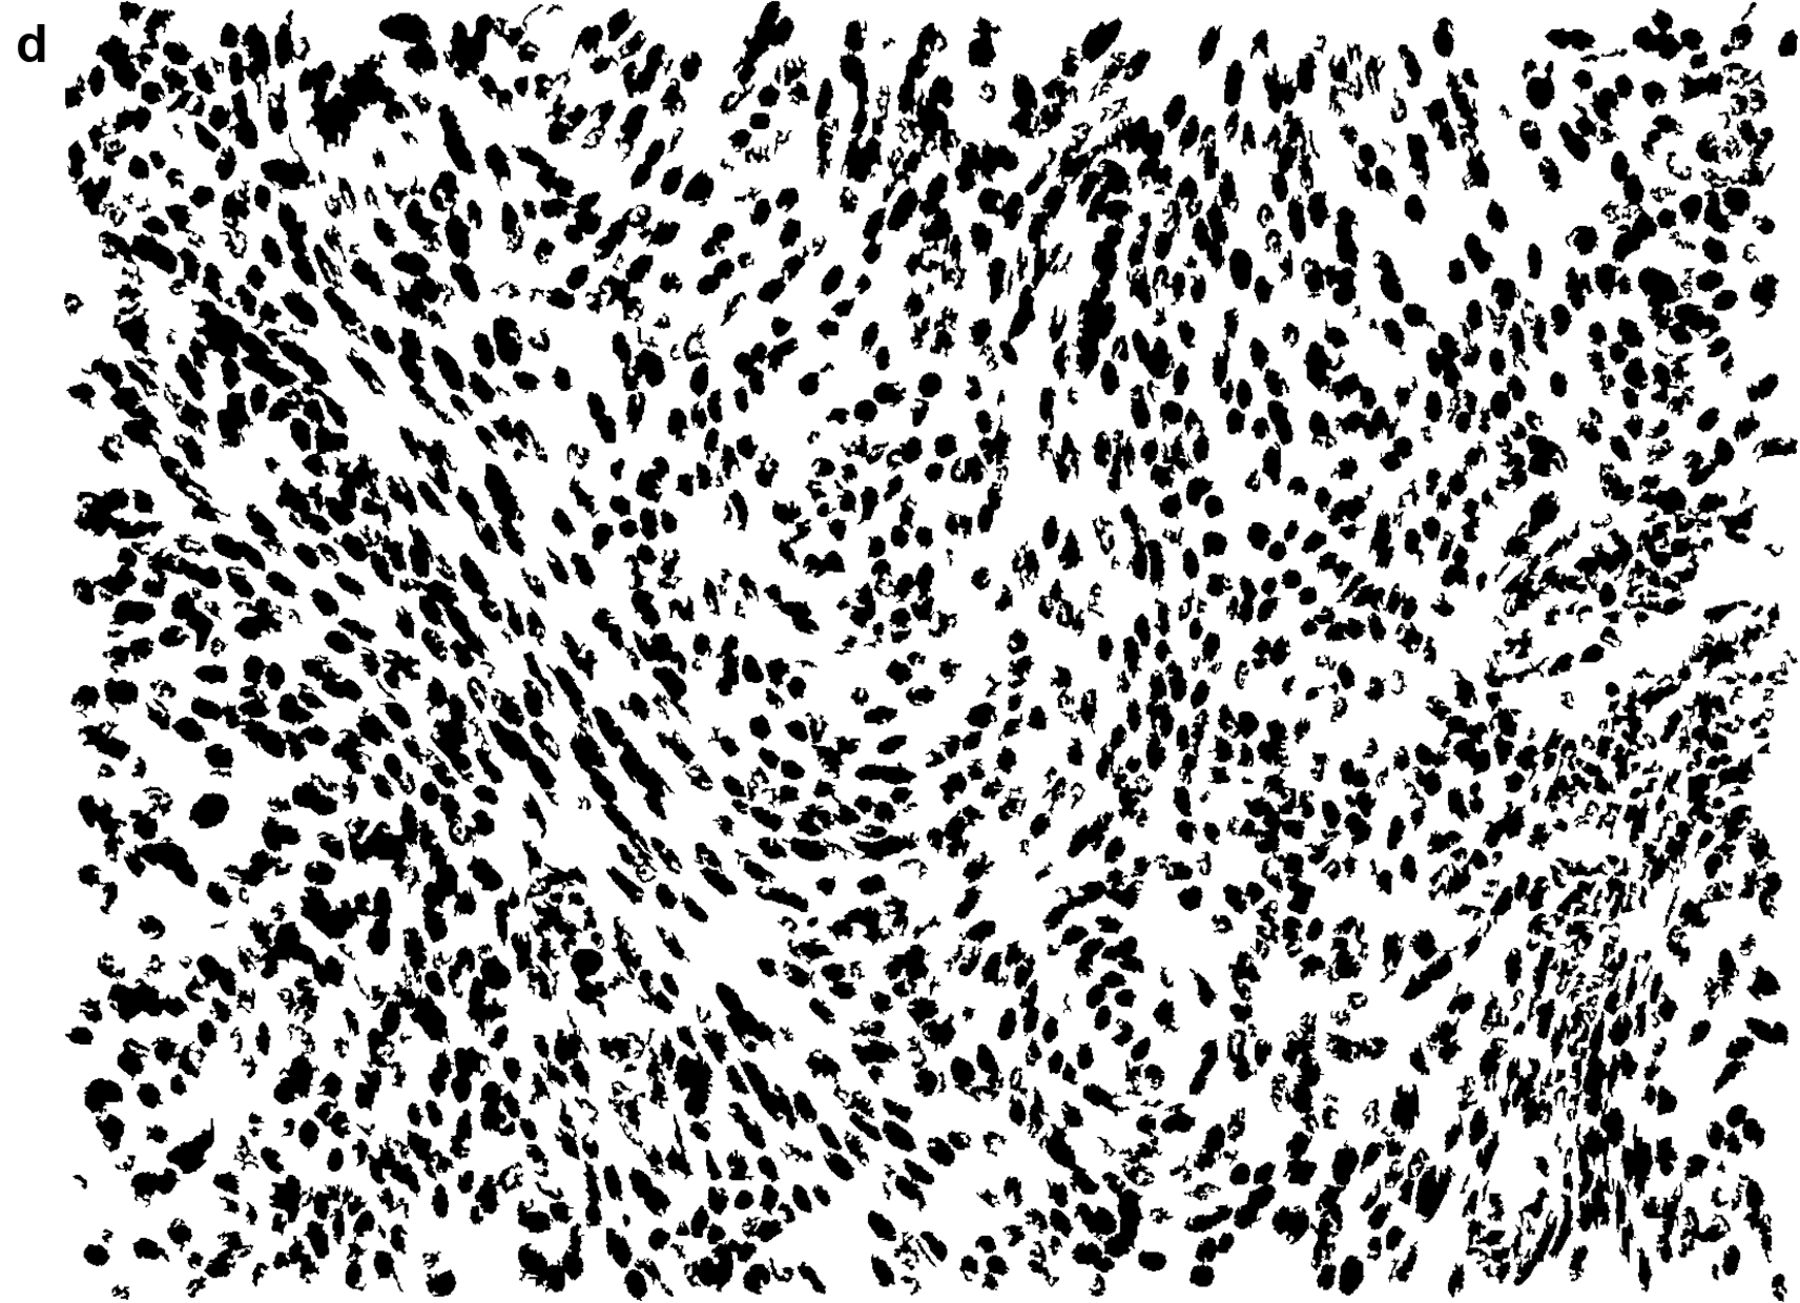
MRI and histological findings in a meningothelial meningioma. a: T1w image after intravenous administration of contrast medium showing a left-sided tumor with marked enhancement. b: ADC map of the lesion. ADCmin, ADCmean, and ADCmax are 0.51, 0.75, and 0.92×10⁻³ mm2s−1, respectively. The calculated D value is 0.55×10⁻³ mm2s−1. c: Immunohistochemical stain (MIB-1 monoclonal antibody). Cell count is 1868. Ki-67 index=2%. d: “Particles tool” analysis image. The total nucleic area is 104,610.13 μm2, the average nucleic area is 82.05 μm2.
Diffusion-weighted imaging and histopathological parameters of the investigated meningothelial meningiomas.
Patients and Methods
The study was approved by the Institutional Review Board (Martin-Luther-university Halle-Wittenberg).
Data acquisition. Magnetic resonance imaging (MRI) and histopathological findings of different meningioma identified in our database were re-analyzed retrospectively. Because of their high frequency, only meningothelial meningiomas were included in the analysis. Other inclusion criteria were: (i) good quality of diffusion weighted (DW) images; (ii) available histological material. Exclusion criteria were: (i) Tumors below 10 mm in diameter; (ii) totally/sub-totally calcified meningiomas; (iii) tumors with artifacts on DWI/ADC map; (iv) missing ADC map; (v) missing histopathological material. A total of 24 meningothelial meningiomas were included in the analysis.
Identified correlations between diffusion and histopathological parameters.
Patients. These tumors were found in 19 women and 5 men with a mean age of 57.79±15.23 years (median age=61 years; range=20-82 years). All patient records/information were anonymized and de-identified prior to analysis.
Imaging. In all patients, MRI of the head was performed using a 1.5 T device (Magnetom Vision Sonata Upgrade, Siemens, Erlangen, Germany). DWI was obtained using a multi-slice single-shot echo-planar imaging sequence (TR/TE: 5900/96 ms; FOV: 250×250 mm; slice thickness: 5 mm; acquisition matrix: 128×128), with b values of 0, 500, and 1000 s/mm2. ADC maps were generated by the implemented software according to the following equation: ADC (mm2s−1)=[ln(S0/S1000)]/1000.
Where S0 and S1000 represent the signal intensities of the images. The slice with the largest diameter of meningioma was selected for ADC calculation. In this image a polygonal region of interest (ROI) as large as possible was drawn on ADC maps around the margin of the lesion without risking partial volume effects. ROIs were placed to avoid cystic and necrotic areas as well as large vessels of the tumors. In all lesions minimal ADC values (ADCmin), mean ADC values (ADCmean), and maximal ADC values (ADCmax) were estimated (Figure 1). Additionally, true ADC values (D) were calculated according to the following equation:
 S0 and S500 are the signal intensities of the images.
Histopathological analysis. All meningiomas were surgically resected and analyzed histopathologically. In each case, the tumor proliferation index was estimated on Ki-67 antigen stained specimens by using MIB-1 monoclonal antibody (DakoCytomation, Glostrup Denmark). The area with the highest number of positive tumor nuclei was selected (Figure 1).
Cell density was calculated in every case as an average cell count per five high power fields (×400). All images were analyzed by a research microscope Jenalumar, with camera Diagnostic instruments 4.2 (Zeiss, Jena, Germany).
Furthermore, all histological samples were analyzed for estimation of nucleic size and nucleic area. The ImageJ software 1.48v (National Institute of Health Image program) was used for the analysis. First, the scaling of the images was globally set using the Analyze-Set scale command. The scaling arose from the microscope setting as 1600 pixels equal 1039 μm (scaling factor 1.54 pixels/μm or 0.42 μm2/pixels2). For quantification of nuclei a threshold was set for the RGB image (uncompressed.tif) using the Image-Adjust-Color Threshold tool. Hue and saturation remained unchanged whereas for brightness pass was unchecked and the intensity control was adjusted so that the threshold mask (red overlay) matched the nuclei coloring. Next, the threshold-selected image parts were analyzed using the Analyze Particles tool (Figure 1). Size (μm2) was set 20 to infinity meaning all areas above 20 μm2 were analyzed. Exclude on edges and include holes were checked as well as the summarize field. This resulted in a table with sample name, nuclei count, total nuclei area (pixels), and average nuclei area (pixels) estimated as total nucleic area/nucleic number. Pixel dimensions were converted to metric scale by the scaling factor given above.
Statistical analysis. For statistical analysis, the SPSS statistical software package was used (SPSS 17.0, SPSS Inc., Chicago IL, USA). Collected data were evaluated by means of descriptive statistics (absolute and relative frequencies). Categorical variables were expressed as percentages. Analyses of the estimated parameter were performed by means of two sided t-tests. Correlation analysis was performed using the Pearson's product moment correlation. p< 0.05 was taken to indicate statistical significance in all instances.
Results
The calculated values of different ADC fractions are shown in Table I. The estimated mean cell count was 1,160.08±33.86 cells and the mean level of the proliferation index was 3.46±2.84%. The mean values of average nucleic area and total nucleic area were 65.42±19.38 μm2 and 6,4481.87±21,120.02 μm2, respectively (Table I). Correlation analysis showed several associations between different ADC fractions and histopathological parameters (Table II). ADCmean correlated significant with Ki-67 level, average nucleic area, and total nucleic area, but not with cell count (Table II). ADCmin and D correlated significant with cell count and total nucleic area, but not with Ki-67 (Table II). D was also associated with average nucleic area. ADCmax correlated slightly with cell count (Table II). Furthermore, a statistically significant correlation between cell count and nucleic area was identified (r=0.58, p=0.003).
Discussion
Our study revealed associations between different ADC fractions and cell count, mean nucleic area, total nucleic area, and the Ki-67 levels in meningothelial meningioma. For various tumors, significant associations of ADC with several cell markers, such as Ki-67 have been described in the literature (13-17). Ki-67 reflects cell proliferation and is used to estimate tumor aggressiveness (14, 15). As reported previously, ADC correlated well with Ki-67 in urinary tract cancer (16, 17), breast carcinoma (18), and colorectal cancer (19). Different brain tumors, such as gliomas and neuroepithelial tumors, also showed a significant association between ADC values and Ki-67 (15, 20).
In meningioma, however, the reports concerning associations of ADC with Ki-67 were inconsistent. For instance, a low but statistically significant correlation between ADC and Ki-67 was mentioned by Tang et al. (20), but according to other authors, meningiomas showed no correlation between ADC and Ki-67 (21).
Presumably, different ADC fractions may reflect different histopathological features. In fact, in the present study, we could establish a statistically significant inverse correlation between ADCmean and Ki-67. Therefore, ADCmean values can help differentiate meningiomas with high proliferation potential from tumors with low proliferation index. However, ADCmean showed no significant correlation with cell count. Nevertheless, cell count had statistically significant correlations with ADCmin and D values. ADCmin and D, however, showed no significant associations with Ki-67. Finally, ADCmax correlated slightly with cell count.
As reported previously, tissue cellularity plays a significant role in water diffusion (6, 8-10). High cell density is usually associated with low ADC and vice versa (5, 8, 9). According to the literature, correlation analysis showed moderate-to-high negative association between ADC and cell count in squamous cell carcinomas (8), prostatic cancer (9), and cervical cancer (11). However, there were also reports, in which no relationship between ADC and tissue cellularity was found (22, 23). For instance, no significant association between cell count and ADC was identified in different lymphomas (23). Furthermore, Yoshikawa et al. (24) observed no significant correlation between cell density and ADC values in breast cancer. In meningiomas, Fatima et al. (25), found a moderate significant correlation between ADC values and cell density (r=-0.53, p=0.02).
Previously, it has been shown that other histological features, especially nucleic size or volume affected water diffusion in cell culture (5, 26-28). These experimental results were also observed in clinical practice (7, 8). For example, Langer et al. (8) identified a statistically significant inverse correlation between ADC values and percentage area of nuclei in prostatic cancer.
In the present analysis, ADCmean, ADCmin, and D correlated well with total nucleic areas. Furthermore, average nucleic area correlated significantly with ADCmean and D, but not with ADCmin. ADCmax showed no significant correlations with nucleic areas. These findings confirmed the assumption that different histopathological features may be associated with different products of DWI.
Our study suffers several limitations. Firstly, it is retrospective in nature. Secondly, it includes a small number of lesions. Thirdly, only meningothelial tumors were analyzed.
In conclusion, our analysis showed several relationships between different ADC fractions and histological parameters in meningothelial meningioma. ADCmean was negatively associated with Ki-67 level, average nucleic area, and total nucleic area. There was no significant correlation between ADCmean and cell count. ADCmin and D correlated well with total nucleic areas and cell count, but not with Ki-67. ADCmax correlated slightly with cell count.
Footnotes
Conflicts of Interest
There exist no conflicts of interest.
- Received September 1, 2015.
- Revision received September 30, 2015.
- Accepted October 3, 2015.
- Copyright© 2015 International Institute of Anticancer Research (Dr. John G. Delinassios), All rights reserved


